Open Access
Research
Gender-specific epidemiology of diabetes: a representative
cross-sectional study
Janet F Grant*
1,3, Neville Hicks
1,2, Anne W Taylor
3,
Catherine R Chittleborough
3, Patrick J Phillips
4and The North West Adelaide
Health Study Team
Address: 1Department of Public Health, The University of Adelaide, North Terrace, Adelaide, South Australia, 5000, Australia, 2Department of
Gender, Work and Social Inquiry, The University of Adelaide, North Terrace, Adelaide, South Australia, 5000, Australia, 3Population Research and
Outcome Studies, SA Health, 11 Hindmarsh Square (PO Box 287), Adelaide, South Australia, 5000, Australia and 4Endocrine and Diabetes Service,
The Queen Elizabeth Hospital, Woodville Road, Woodville, South Australia, 5011, Australia
Email: Janet F Grant* - [email protected]; Neville Hicks - [email protected];
Anne W Taylor - [email protected]; Catherine R Chittleborough - [email protected]; Patrick J Phillips - [email protected]; The North West Adelaide Health Study Team - [email protected] * Corresponding author
Abstract
Background: Diabetes and its associated complications are part of a chronic disease global epidemic that presents a public health challenge. Epidemiologists examining health differences between men and women are being challenged to recognise the biological and social constructions behind the terms 'sex' and/or 'gender', together with social epidemiology principles and the life course approach. This paper examines the epidemiology of a population with diabetes from the north-west metropolitan region of South Australia.
Methods: Data were used from a sub-population with diabetes (n = 263), from 4060 adults aged 18 years and over living in the north-west suburbs of Adelaide, South Australia. Eligible respondents were asked to participate in a telephone interview, a self-report questionnaire and a biomedical examination. Diabetes (undiagnosed and diagnosed) was determined using self-reported information and a fasting blood test administered to participants. Data were analysed using SPSS (Version 10.0) and EpiInfo (Version 6.0).
Results: Factors associated with diabetes for both men and women were being aged 40 years and over, and having a low gross annual household income, obesity and a family history of diabetes. In addition, being an ex-smoker and having low cholesterol levels were associated with diabetes among men. Among women, having a high waist-hip ratio, high blood pressure and reporting a previous cardiovascular event or mental health problem were associated with diabetes.
Conclusion: The results found that men and women with diabetes face different challenges in the management of their condition. Public health implications include a need for quality surveillance data, including epidemiological life course, social, behavioural, genetic and environmental factors. This will enrich the evidence base for health promotion professionals and allow policy makers to draw inferences and conclusions for interventions and planning purposes.
Published: 11 March 2009
International Journal for Equity in Health 2009, 8:6 doi:10.1186/1475-9276-8-6
Received: 5 August 2008 Accepted: 11 March 2009
This article is available from: http://www.equityhealthj.com/content/8/1/6
© 2009 Grant et al; licensee BioMed Central Ltd.
Background
A major challenge for public health is to halt the global epidemic of diabetes and its associated complications. For epidemiologists to successfully contribute to the reduc-tion in the prevalence of this condireduc-tion, the way in which diabetes is viewed/analysed/described needs to be changed and expanded. Traditionally, epidemiology has described people with diabetes as distinguished by sex and/or gender differences. The terms 'sex' and 'gender' have been used interchangeably or exclusively as distinct constructs – often without the recognition that sex is a biological construct and gender is a social construction that embodies particular roles and expectations [1]. Krieger [2] urges epidemiologists to be more precise about sex and/or gender difference when analysing and inter-preting population health data, and looking for differ-ences in risk or protective factors. This lack of distinction may impact upon the understanding of illness by health professionals, which potentially may influence the per-ception of and ability to manage their condition by peo-ple with diabetes. Gender is an important factor in social and life course epidemiology.
Equity principles highlight the need for men and women to be given an equal opportunity for good health and well-being, and physiological principles recognise sex and gender as determinants of health [3-7].
A number of studies have compared the differences in health between men and women, including the compari-son of those with diabetes with other related diseases or risk factors such as coronary heart disease, physical activ-ity, depression, dietary patterns or obesity [8-12]. A report [13] from the United States of America (US) focused on diabetes as a major health issue for women, using mortal-ity, morbidity and survey data to highlight that women may face different challenges across their life span than men, and that these may warrant more diverse preven-tion, management and treatment options. Other studies have explored the risk of developing diabetes and the impact of this condition on men, as well as the effect on their lifestyles [14-18].
Diabetes is a major non-communicable and chronic con-dition that causes a significant degree of mortality and morbidity. It has been recognized as a continuing health challenge for the twenty-first century, both in developed and developing countries, due in part to westernization of lifestyles, as well as increasing urbanization and economic development [19].
In Australia, based on National Health Survey data from 2004–05, the rate of self-reported type 2 diabetes in all ages was 1% higher for men than for women (3% com-pared to 2%) [20]. In South Australia (SA), from 1991 to
2003, the age-sex standardised absolute prevalence of self-reported doctor-confirmed diabetes significantly increased for both males and females (from 3.5% in 1991 to 6.7% in 2003). Of concern is the significantly higher prevalence seen among those classified as obese (6.5% in 1991 to 12.2% in 2003), and the greatest relative percent-age increases over this time among younger people percent-aged 15 to 39 years [21].
Beckles and Thompson-Reid [13] argue that a sex/gender distinction for people with diabetes is justified, particu-larly for women, because of the dominance of young women developing type 2 diabetes, the impact of gesta-tional diabetes on both the mother and baby regarding the increased risk of developing type 2 diabetes in later life, and the increasing prevalence of older women with the condition due to their greater life expectancy. Simi-larly, the report draws attention to the often greater bur-den of risk factors among women, their greater risk of developing blindness and cardiovascular disease, and the poorer survival rate and quality of life of women among those with diabetes who develop ischaemic heart disease. Further, mortality and morbidity rates for women with diabetes are higher across all causes than for women with-out diabetes.
It is important to acknowledge that many men with dia-betes may face different challenges to women on their journey through life. It is also recognised that much data are based on self-report, and that men may be less inclined to admit problems, especially if the problem is not physically limiting [15].
This work takes a step towards answering the call from MacDonald and Crawford for a population health approach that looks at men's and women's needs ration-ally, as 'sub-groups of the population' [22]. It compares the distribution, determinants and frequency of diabetes in males and females over a range of self-reported and biomedically measured health conditions and risk factors, to see if there are differences in their descriptive profiles, whilst acknowledging that these factors may vary across their life course. It examines the issue from a South Aus-tralian perspective, and incorporates baseline data obtained from a subset of adult cohort participants with diabetes.
Methods
dis-ease and risk factors [24]. The NWAH Study provides com-prehensive health information for a number of chronic diseases, including diabetes and asthma. Detailed meth-odology has been reported previously [25-27]. Ethics approval was received from the North Western Adelaide Health Service – Ethics of Human Research Committee (refs 45/99 & 83/2002).
All households in the north western metropolitan areas of Adelaide with a telephone connected and a number listed in the Electronic White Pages directory were eligible for selection for the study. Each randomly selected household was sent an introductory letter explaining the study and advising that they could expect a telephone call in the next few weeks. To ensure random selection within the house-hold, the adult aged 18 years and over to have the last birthday was selected and interviewed about a number of health conditions (diabetes, asthma, bronchitis, emphy-sema, heart attack, stroke and angina, and mental health conditions such as anxiety, depression, a stress-related or any other mental health problem) and demographics, using the Computer Assisted Telephone Interviewing (CATI) system. Respondents were then invited to attend a clinic for a health assessment at either of two major teach-ing hospitals. Up to ten call-backs were made to the selected household to obtain the interview, and no replacements were made for refusal or non-response.
People who agreed to take part in the study were mailed an information pack that included a questionnaire that incorporated questions on quality of life, mental health, risk factors and health service utilisation. Demographic information included age, sex, marital status, highest edu-cational level achieved, work status, total income of the household (before tax), and country of birth.
To define alcohol risk, respondents were asked the number of standard drinks they would usually have on a weekly and daily basis. Their alcohol risk was categorised according to the criteria used in the National Heart Foun-dation Risk Prevalence study [28]. The physical activity questions from the Australian National Health Surveys (conducted in 1989/90, 1995 and 2001) were used in this study to also enable comparison with national data – the now recommended Active Australia questions had not been formulated when the study was initiated. Sufficient physical activity was defined as at least 150 minutes per week of walking, moderate activity or vigorous activity [29].
Informed consent was sought from participants at the commencement of the clinic visit. A number of proce-dures were then conducted including a fasting blood test, performed to determine cholesterol, triglyceride, glucose and glycated haemoglobin levels. People were considered
to have diabetes if they reported being told by a doctor they had diabetes, or if their fasting glucose level was greater than or equal to 7.0 mmol/L [30]. Two blood pres-sure meapres-surements were taken five to ten minutes apart using a standard, calibrated blood pressure sphygmoma-nometer, while the participant was relaxed and seated. The average of these two recorded measures were used in the analyses. Height was measured to the nearest 0.5 cen-timetres using a stadiometer, and weight to the nearest 0.1 kilogram in light clothing and without shoes using stand-ard digital scales. Body mass index (BMI) was calculated as weight (kg)/height (m)2. Overweight was defined as BMI ≥ 25.0 and obesity as BMI ≥ 30.0 using World Health Organization guidelines [30]. Waist circumference was measured to the nearest 0.1 centimetre using an inelastic tape maintained in a horizontal plane, with the subject standing comfortably with weight distributed evenly on both feet. The measurement was taken at the level of the narrowest part of the waist. The mean of three measure-ments was calculated. Hip circumference was also meas-ured using an inelastic tape, at the level of the maximum posterior extension of the buttocks. Three measurements were taken and the average of the three was calculated. A high waist-hip ratio was defined as > 1.0 for males and > 0.85 for females [31].
Statistical analyses
The data were weighted to the 1999 Estimated Resident Population [32] by age group, sex, region and probability of selection in the household, to ensure that the sample was representative of the population in the northern and western regions of Adelaide. The data were analysed using SPSS (Version 10.0) [33] and EpiInfo (Version 6.0) [33,34]. Weighted frequencies and general tables were produced.
assessed based on previous findings in the literature any dramatic changes in the odds ratios during the multivari-ate analysis [36]. If confounding existed, then the variable was removed from the model.
Results
Of the total eligible sample (n = 8213), 71.2% (n = 5850) took part in the initial telephone interview and 49.4% (n = 4060) attended the clinic. The response rate for attend-ance at the clinic among those who were interviewed was 69.4%, where 1988 were males and 2071 were females. The overall prevalence of diabetes was 6.0% (95% CI 5.8
to 7.8). The prevalence of diabetes among males was 7.2% (95% CI 6.1 to 8.4) and 5.8% (95% CI 4.9 to 7.0) among females.
Table 1 describes the demographic profile of the study population, stratified by gender. Tables 2 and 3 describe the demographic, health condition and risk factor related variables tested for association with diabetes among men and women respectively.
For men with diabetes, high statistically significant varia-bles included age over 40 years, being on a low gross
Table 1: Demographic characteristics of NWAH Study participants
Men Women
Variable n % n %
Age group
18 to 29 years 512 25.7 484 23.4
30 to 39 years 387 19.5 381 19.5
40 to 49 years 378 19.0 377 18.2
50 to 59 years 284 48.6 300 14.5
60 to 69 years 207 10.4 226 10.9
70 years and over 221 11.1 302 14.6
Area of residence
Western suburbs 901 45.3 952 46.0
Northern suburbs 1088 54.7 1119 54.0
Highest education level obtained
Secondary 709 35.6 1043 50.4
Trade/Apprenticeship/Certificate/Diploma 966 48.6 675 32.6
Bachelor degree or higher 235 11.8 239 11.5
Not stated 79 4.0 114 5.5
Gross annual household income
Up to $20,000 366 18.4 536 25.9
$20,001–40,000 526 26.5 482 23.3
$40,001–60,000 490 24.7 409 19.7
More than $60,000 499 25.1 493 23.8
Not stated 106 5.3 152 7.3
Country of birth
Australia 1389 69.8 1477 71.3
UK or Ireland 312 15.7 334 16.1
Europe 179 9.0 153 7.4
Asia, Other 104 5.2 88 4.2
Not stated 5 0.3 20 1.0
Marital status
Married or living with partner 1249 62.8 1277 61.6
Separated or divorced 152 7.6 178 8.6
Widowed 50 2.5 182 8.8
Never married 529 26.6 410 19.8
Not stated 8 0.4 25 1.2
Work status
Full time employed 1065 53.6 472 22.8
Part time or casual employed 207 10.4 521 25.2
Unemployed 105 5.3 68 3.3
Home duties or retired 409 20.6 831 40.1
Student/Other 187 9.4 145 7.0
Not stated 15 0.8 34 1.6
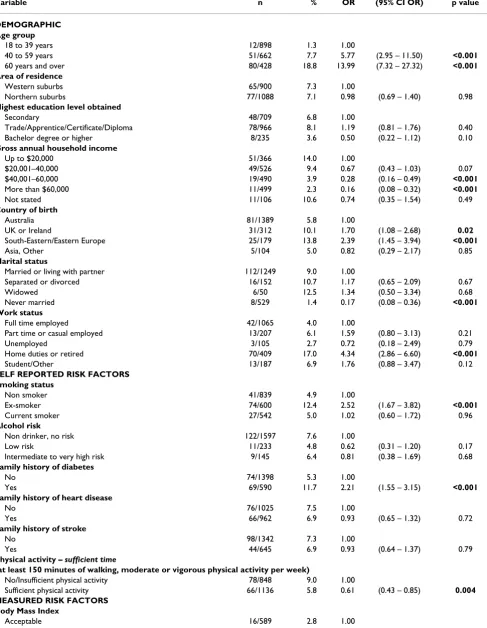
Table 2: Bivariate Odds Ratios for variables tested for association with diabetes among men
Variable n % OR (95% CI OR) p value
DEMOGRAPHIC Age group
18 to 39 years 12/898 1.3 1.00
40 to 59 years 51/662 7.7 5.77 (2.95 – 11.50) <0.001
60 years and over 80/428 18.8 13.99 (7.32 – 27.32) <0.001
Area of residence
Western suburbs 65/900 7.3 1.00
Northern suburbs 77/1088 7.1 0.98 (0.69 – 1.40) 0.98
Highest education level obtained
Secondary 48/709 6.8 1.00
Trade/Apprentice/Certificate/Diploma 78/966 8.1 1.19 (0.81 – 1.76) 0.40
Bachelor degree or higher 8/235 3.6 0.50 (0.22 – 1.12) 0.10
Gross annual household income
Up to $20,000 51/366 14.0 1.00
$20,001–40,000 49/526 9.4 0.67 (0.43 – 1.03) 0.07
$40,001–60,000 19/490 3.9 0.28 (0.16 – 0.49) <0.001
More than $60,000 11/499 2.3 0.16 (0.08 – 0.32) <0.001
Not stated 11/106 10.6 0.74 (0.35 – 1.54) 0.49
Country of birth
Australia 81/1389 5.8 1.00
UK or Ireland 31/312 10.1 1.70 (1.08 – 2.68) 0.02
South-Eastern/Eastern Europe 25/179 13.8 2.39 (1.45 – 3.94) <0.001
Asia, Other 5/104 5.0 0.82 (0.29 – 2.17) 0.85
Marital status
Married or living with partner 112/1249 9.0 1.00
Separated or divorced 16/152 10.7 1.17 (0.65 – 2.09) 0.67
Widowed 6/50 12.5 1.34 (0.50 – 3.34) 0.68
Never married 8/529 1.4 0.17 (0.08 – 0.36) <0.001
Work status
Full time employed 42/1065 4.0 1.00
Part time or casual employed 13/207 6.1 1.59 (0.80 – 3.13) 0.21
Unemployed 3/105 2.7 0.72 (0.18 – 2.49) 0.79
Home duties or retired 70/409 17.0 4.34 (2.86 – 6.60) <0.001
Student/Other 13/187 6.9 1.76 (0.88 – 3.47) 0.12
SELF REPORTED RISK FACTORS Smoking status
Non smoker 41/839 4.9 1.00
Ex-smoker 74/600 12.4 2.52 (1.67 – 3.82) <0.001
Current smoker 27/542 5.0 1.02 (0.60 – 1.72) 0.96
Alcohol risk
Non drinker, no risk 122/1597 7.6 1.00
Low risk 11/233 4.8 0.62 (0.31 – 1.20) 0.17
Intermediate to very high risk 9/145 6.4 0.81 (0.38 – 1.69) 0.68
Family history of diabetes
No 74/1398 5.3 1.00
Yes 69/590 11.7 2.21 (1.55 – 3.15) <0.001
Family history of heart disease
No 76/1025 7.5 1.00
Yes 66/962 6.9 0.93 (0.65 – 1.32) 0.72
Family history of stroke
No 98/1342 7.3 1.00
Yes 44/645 6.9 0.93 (0.64 – 1.37) 0.79
Physical activity – sufficient time
(at least 150 minutes of walking, moderate or vigorous physical activity per week)
No/Insufficient physical activity 78/848 9.0 1.00
Sufficient physical activity 66/1136 5.8 0.61 (0.43 – 0.85) 0.004 MEASURED RISK FACTORS
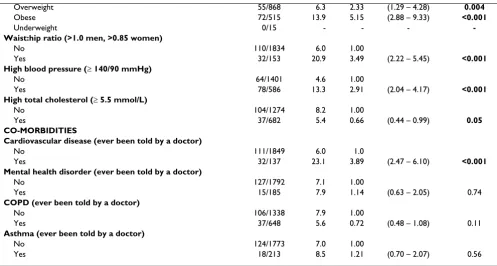
Body Mass Index
annual household income, having been born in South Eastern/Eastern Europe, undertaking home duties or being retired, being an ex-smoker, having a family history of diabetes, being obese, having a high waist-hip ratio and blood pressure, and reporting cardiovascular disease.
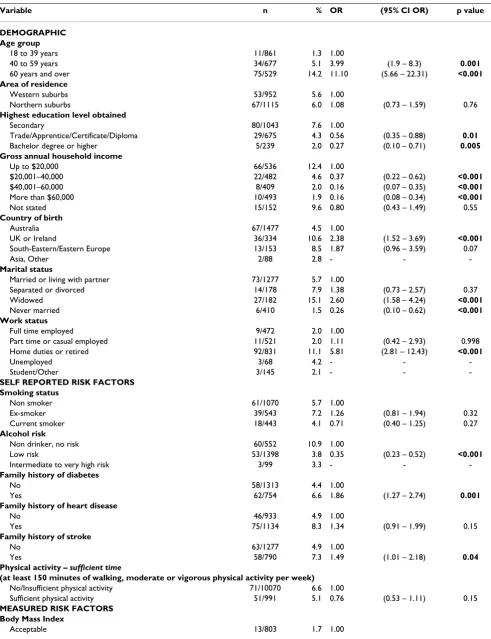
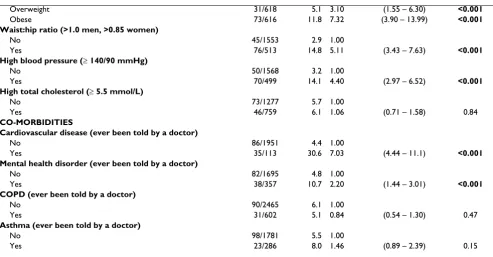
For women with diabetes, high statistically significant var-iables included age over 60 years, being on a low gross annual household income, having been born in the United Kingdom/Ireland, being widowed, undertaking home duties or being retired, being overweight or obese, having a high waist-hip ratio and blood pressure, and reporting cardiovascular disease and at least one mental health condition.
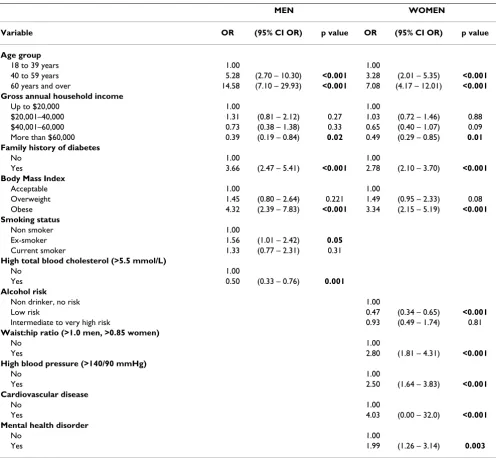
Table 4 shows the multivariate associations. There were four variables that were statistically significantly associ-ated with diabetes for both men and women with diabe-tes. Both groups were more likely to be aged 40 years and over, to be obese and to have a family history of diabetes, whilst being less likely to earn more than $60,000.
Further, men with diabetes were statistically significantly more likely than men without diabetes to be an ex-smoker, and statistically significantly less likely to have high cholesterol.
The multivariate model for women shows that women with diabetes were statistically significantly more likely than women without diabetes to have a high waist-hip ratio, high blood pressure, and to report a past
cardiovas-cular event (heart attack, stroke or angina) and/or a men-tal health problem (anxiety, depression, stress-related and/or other mental health problem), whilst significantly less likely to be a low risk drinker.
Discussion
These local results support recent studies from the US and Canada that found gender differences in health and soci-oeconomic inequalities [37], suggesting the value of mod-els that include a wide range of health and health-determinant variables whilst affirming the need to exam-ine gender differences in health more closely.
Firstly in examining the shared variables for both men and women, it was found that older age, a family history of diabetes, low gross annual household income and obesity remained significant in the final multivariate models.
It has been well established that both age (as a social struc-tural factor) and family history of diabetes (as a genetic/ shared environment factor) are risk factors for developing the condition. Whilst neither of these factors can be altered by an individual, early knowledge may help pre-vent or at least delay the onset of diabetes. This could also have benefits when looking at this in the long term, if the condition could be prevented in one generation, provid-ing a lessenprovid-ing of risk in their offsprprovid-ing.
Similarly a low household income, as another social struc-tural factor, was consistent in both groups and it is acknowledged that people on lower incomes generally
Overweight 55/868 6.3 2.33 (1.29 – 4.28) 0.004
Obese 72/515 13.9 5.15 (2.88 – 9.33) <0.001
Underweight 0/15 - - -
-Waist:hip ratio (>1.0 men, >0.85 women)
No 110/1834 6.0 1.00
Yes 32/153 20.9 3.49 (2.22 – 5.45) <0.001
High blood pressure (≥ 140/90 mmHg)
No 64/1401 4.6 1.00
Yes 78/586 13.3 2.91 (2.04 – 4.17) <0.001
High total cholesterol (≥ 5.5 mmol/L)
No 104/1274 8.2 1.00
Yes 37/682 5.4 0.66 (0.44 – 0.99) 0.05
CO-MORBIDITIES
Cardiovascular disease (ever been told by a doctor)
No 111/1849 6.0 1.0
Yes 32/137 23.1 3.89 (2.47 – 6.10) <0.001
Mental health disorder (ever been told by a doctor)
No 127/1792 7.1 1.00
Yes 15/185 7.9 1.14 (0.63 – 2.05) 0.74
COPD (ever been told by a doctor)
No 106/1338 7.9 1.00
Yes 37/648 5.6 0.72 (0.48 – 1.08) 0.11
Asthma (ever been told by a doctor)
No 124/1773 7.0 1.00
Yes 18/213 8.5 1.21 (0.70 – 2.07) 0.56
OR Odds Ratio; CI Confidence Intervals
Table 3: Bivariate Odds Ratios for variables tested for association with diabetes among women
Variable n % OR (95% CI OR) p value
DEMOGRAPHIC Age group
18 to 39 years 11/861 1.3 1.00
40 to 59 years 34/677 5.1 3.99 (1.9 – 8.3) 0.001
60 years and over 75/529 14.2 11.10 (5.66 – 22.31) <0.001
Area of residence
Western suburbs 53/952 5.6 1.00
Northern suburbs 67/1115 6.0 1.08 (0.73 – 1.59) 0.76
Highest education level obtained
Secondary 80/1043 7.6 1.00
Trade/Apprentice/Certificate/Diploma 29/675 4.3 0.56 (0.35 – 0.88) 0.01
Bachelor degree or higher 5/239 2.0 0.27 (0.10 – 0.71) 0.005
Gross annual household income
Up to $20,000 66/536 12.4 1.00
$20,001–40,000 22/482 4.6 0.37 (0.22 – 0.62) <0.001
$40,001–60,000 8/409 2.0 0.16 (0.07 – 0.35) <0.001
More than $60,000 10/493 1.9 0.16 (0.08 – 0.34) <0.001
Not stated 15/152 9.6 0.80 (0.43 – 1.49) 0.55
Country of birth
Australia 67/1477 4.5 1.00
UK or Ireland 36/334 10.6 2.38 (1.52 – 3.69) <0.001
South-Eastern/Eastern Europe 13/153 8.5 1.87 (0.96 – 3.59) 0.07
Asia, Other 2/88 2.8 - -
-Marital status
Married or living with partner 73/1277 5.7 1.00
Separated or divorced 14/178 7.9 1.38 (0.73 – 2.57) 0.37
Widowed 27/182 15.1 2.60 (1.58 – 4.24) <0.001
Never married 6/410 1.5 0.26 (0.10 – 0.62) <0.001
Work status
Full time employed 9/472 2.0 1.00
Part time or casual employed 11/521 2.0 1.11 (0.42 – 2.93) 0.998 Home duties or retired 92/831 11.1 5.81 (2.81 – 12.43) <0.001
Unemployed 3/68 4.2 - -
-Student/Other 3/145 2.1 - -
-SELF REPORTED RISK FACTORS Smoking status
Non smoker 61/1070 5.7 1.00
Ex-smoker 39/543 7.2 1.26 (0.81 – 1.94) 0.32
Current smoker 18/443 4.1 0.71 (0.40 – 1.25) 0.27
Alcohol risk
Non drinker, no risk 60/552 10.9 1.00
Low risk 53/1398 3.8 0.35 (0.23 – 0.52) <0.001
Intermediate to very high risk 3/99 3.3 - -
-Family history of diabetes
No 58/1313 4.4 1.00
Yes 62/754 6.6 1.86 (1.27 – 2.74) 0.001
Family history of heart disease
No 46/933 4.9 1.00
Yes 75/1134 8.3 1.34 (0.91 – 1.99) 0.15
Family history of stroke
No 63/1277 4.9 1.00
Yes 58/790 7.3 1.49 (1.01 – 2.18) 0.04
Physical activity – sufficient time
(at least 150 minutes of walking, moderate or vigorous physical activity per week)
No/Insufficient physical activity 71/10070 6.6 1.00
Sufficient physical activity 51/991 5.1 0.76 (0.53 – 1.11) 0.15
MEASURED RISK FACTORS Body Mass Index
have poorer health than those on higher incomes. There-fore, improving the social conditions of a household may not only assist those currently faced with decreasing health and wellbeing, but future generations to come. This may be particularly salient for women who tradition-ally had less opportunity to study and therefore less access to secure, well paid employment. Women therefore are often cast in a support role, often working in part-time or casual employment due to their need to move in and out of the workforce to have and look after children, as well as provide care to ageing family members [38]. Increasingly, both sexes are being faced with the loss of permanency in work and the demands of maintaining income with bal-ancing increasing expenditure [39]. The high divorce rate in Australia and other western societies compounds this problem, with the majority of single parents being female struggling with the additional stress of increased work and child-related commitments [40]. Men may also struggle with marriage and family breakdown, with resulting poorer mental and physical health (including impaired glucose metabolism) and economic hardship from altered circumstances [41]. Similarly, many families with both parents present are struggling with being time-poor with work and life demands, and economically chal-lenged with rising housing, food and petrol prices, which may lead to difficulties finding the resources to suffi-ciently exercise and eat well.
Weight gain resulting from these factors may then lead to obesity, a lifestyle and socioeconomic factor that is another strong predictor of diabetes, hence the term
"diabesity". The prevalence of obesity is generally higher amongst those with lower socioeconomic characteristics [42]. Action to combat rising obesity in many countries will assist the diabetes cause. Lieberman argues that mod-ernisation and westmod-ernisation of lifestyles that were once physically active, and globalised availability of food that is dense in calories, high in sugar and fat and low in fibre, have led to the epidemic of obesity among children and adults in both developing and developed countries [19]. Beer [43] estimates that 80% of the prevalence of diabetes can be attributed to overweight and obesity.
In Australia, it has been estimated that 16% of men and 17% of women aged 18 years and over were obese (BMI > 30) in 2001 [44]. On a local note, of recent concern is the greatest relative percentage increase in diabetes seen in obese people less than 60 years of age, from a recent exam-ination of annual data collected in South Australia from 1993 to 2001 [45], possibly leading to an increase in the expected prevalence. Self-reporting BMI may under-esti-mate the problem, given that people tend to over-report their height and under-report their weight [46]. Evidence from cohort participants in the NWAH Study (n = 4058) found that 26.0% of men and 30.0% of women were obese (clinically measured BMI at ≥ 30). It is acknowl-edged that ethnicity and socioeconomic factors may impact on this growing problem, and this is being exam-ined through the NWAH Study, through life-course influ-ences, including parents' country of birth and occupation history.
Overweight 31/618 5.1 3.10 (1.55 – 6.30) <0.001
Obese 73/616 11.8 7.32 (3.90 – 13.99) <0.001
Waist:hip ratio (>1.0 men, >0.85 women)
No 45/1553 2.9 1.00
Yes 76/513 14.8 5.11 (3.43 – 7.63) <0.001
High blood pressure (≥ 140/90 mmHg)
No 50/1568 3.2 1.00
Yes 70/499 14.1 4.40 (2.97 – 6.52) <0.001
High total cholesterol (≥ 5.5 mmol/L)
No 73/1277 5.7 1.00
Yes 46/759 6.1 1.06 (0.71 – 1.58) 0.84
CO-MORBIDITIES
Cardiovascular disease (ever been told by a doctor)
No 86/1951 4.4 1.00
Yes 35/113 30.6 7.03 (4.44 – 11.1) <0.001
Mental health disorder (ever been told by a doctor)
No 82/1695 4.8 1.00
Yes 38/357 10.7 2.20 (1.44 – 3.01) <0.001
COPD (ever been told by a doctor)
No 90/2465 6.1 1.00
Yes 31/602 5.1 0.84 (0.54 – 1.30) 0.47
Asthma (ever been told by a doctor)
No 98/1781 5.5 1.00
Yes 23/286 8.0 1.46 (0.89 – 2.39) 0.15
OR Odds Ratio; CI Confidence Intervals
These socioeconomic and biomedical influences are seen in the remaining significant variables from the multivari-ate analyses for each gender in this study. For men, there were two factors: protective influence of normal total blood cholesterol (which may be due to existing choles-terol-lowering pharmacotherapy) and a previous history of smoking. The latter may be because men with diabetes may have been more likely than men without diabetes to have been advised to stop smoking by their medical prac-titioners, due to their increased CVD risk. The predomi-nant factors differ for women – their significant factors are a lower alcohol risk, a high waist/hip ratio, high blood pressure, and self-reported cardiovascular and mental
health co-morbidities. This suggests that 'one size fits all' policies and health promotion interventions may not ade-quately take into account the different lifecourses that men and women may have.
These findings are consistent with recent studies that examined gender differences in the psychosocial, struc-tural and behavioural determinants of health [16,47]. They found that social structural factors such as age, fam-ily structure, education, income, etc significantly impact on both genders, although their effects differed for each. Looking at gender and lifestyle factors, the study found that physical activity, smoking and alcohol consumption Table 4: Multivariate Odds Ratios for variables associated with diabetes among men and women
MEN WOMEN
Variable OR (95% CI OR) p value OR (95% CI OR) p value
Age group
18 to 39 years 1.00 1.00
40 to 59 years 5.28 (2.70 – 10.30) <0.001 3.28 (2.01 – 5.35) <0.001
60 years and over 14.58 (7.10 – 29.93) <0.001 7.08 (4.17 – 12.01) <0.001 Gross annual household income
Up to $20,000 1.00 1.00
$20,001–40,000 1.31 (0.81 – 2.12) 0.27 1.03 (0.72 – 1.46) 0.88
$40,001–60,000 0.73 (0.38 – 1.38) 0.33 0.65 (0.40 – 1.07) 0.09
More than $60,000 0.39 (0.19 – 0.84) 0.02 0.49 (0.29 – 0.85) 0.01 Family history of diabetes
No 1.00 1.00
Yes 3.66 (2.47 – 5.41) <0.001 2.78 (2.10 – 3.70) <0.001
Body Mass Index
Acceptable 1.00 1.00
Overweight 1.45 (0.80 – 2.64) 0.221 1.49 (0.95 – 2.33) 0.08
Obese 4.32 (2.39 – 7.83) <0.001 3.34 (2.15 – 5.19) <0.001
Smoking status
Non smoker 1.00
Ex-smoker 1.56 (1.01 – 2.42) 0.05
Current smoker 1.33 (0.77 – 2.31) 0.31
High total blood cholesterol (>5.5 mmol/L)
No 1.00
Yes 0.50 (0.33 – 0.76) 0.001
Alcohol risk
Non drinker, no risk 1.00
Low risk 0.47 (0.34 – 0.65) <0.001
Intermediate to very high risk 0.93 (0.49 – 1.74) 0.81
Waist:hip ratio (>1.0 men, >0.85 women)
No 1.00
Yes 2.80 (1.81 – 4.31) <0.001
High blood pressure (>140/90 mmHg)
No 1.00
Yes 2.50 (1.64 – 3.83) <0.001
Cardiovascular disease
No 1.00
Yes 4.03 (0.00 – 32.0) <0.001
Mental health disorder
No 1.00
Yes 1.99 (1.26 – 3.14) 0.003
had higher significance for men, whilst body weight was more significant for women. Equally important for both genders were psychosocial factors, such as chronic stres-sors, psychological resources, and childhood/life events – however, their effect was found to be generally stronger for women than for men. These disparities may be from a higher rate of self-reported ill-health, better detection or an higher rate of events.
For women, central adiposity, as measured by a high waist hip ratio, suggests that physical activity interventions may need to be tailored to this body area, as well as overall fit-ness. There is a tendency for both men and women to gain weight during the middle years of age, at the same time that earlier lifestyle choices start to impact on their health [48]. For women, this age group also faces the loss of pro-tective hormonal factors through menopause. Therefore, at an individual level, there is an ongoing need to con-tinue to emphasise the benefits of a healthy diet and to possibly increase the use of short-term pharmacotherapy to help reduce high blood glucose levels and high choles-terol, and to reduce the risk of diabetes-related complica-tions. However, this message may need to be tailored to better fit with the expectations and lifestyle of each gender and age group. Much work is also being undertaken inter-nationally to encourage policy and population-level changes, to provide healthier choices as the most econom-ical and easiest option.
As previously alluded to, there is a growing prevalence of diabetes among younger people and therefore this popu-lation group should be targeted to prevent or delay ill-health, with a focus on cultural and age-appropriate inter-ventions that target smoking, obesity, eating disorders, and lack of physical activity in communities and schools at an individual level, as well as addressing interventions and policies that assist in supporting low socioeconomic families. From a mental health and wellbeing viewpoint, there is also a need for different approaches that recognise the need for ongoing support of family, friends, counsel-ling and education, that is balanced with the need for growing independence of this generation.
More research is needed on cardiovascular and risk-factor related factors, particularly diet and obesity, and for cul-tural and age appropriate interventions and recognition of the socioeconomic position of men and women with dia-betes, with regard to barriers to adequate physical activity, self-care, access to quality diabetes services and health education. High blood pressure, retained in the final model for women, warrants further research regarding barriers to reaching and maintaining healthy levels. It is hoped that information collected on self-reported blood pressure status compared to measured levels, and the
pre-scription and usage of blood pressure medication, may provide clues to this variation.
There is ongoing support for opportunistic screening of men and women in their middle years, to detect previ-ously undiagnosed diabetes and complications, and to provide ongoing support. Support is needed to prevent or at least delay the development and related complications for all people, but particularly older people, as this will add to an already strained formal and informal care sys-tem made up of family, friends, community and state-based services.
The public health implications for both men and women with diabetes include a call for better surveillance infor-mation, as well as longitudinal data, to explore the rela-tionships between social, behavioural, genetic and environmental factors. Policies are needed that will strengthen the co-ordination of diabetes and non-diabe-tes specific services at the broader community level, including the provision of welfare, access and transport.
Limitations
There are a number of limitations that must be taken into account when reviewing the data from the NWAH Study. Using the telephone to conduct the interviews and Elec-tronic White Pages as the sampling frame can be seen as a limitation of the study and can potentially produce biased estimates because it excludes people who do not have a telephone connected or are not listed in the White Pages [50]. However, monitoring of telephone usage in Adelaide during recruitment of cohort participants sug-gests that this was not expected to adversely influence results.
When compared to Census data, there was significantly less younger people (<40 years) and more older people (40+ years) who participated in the study [50]. However, other South Australian studies using different sampling methods have produced very similar results regarding dia-betes prevalence [45]. This cohort does not include people residing in institutions, the majority of whom are elderly women. Neither does it include those people from a non-English speaking background who could not communi-cate sufficiently well with the telephone interviewer and who could not answer questions at the initial recruitment stage, although every effort was made to encourage family members to assist in translating.
health-related questions, and may therefore contain an element of bias.
Finally, it should be noted that this is cross-sectional data and therefore the associations cannot be interpreted as causal.
Conclusion
This paper compared men and women with diabetes across a comprehensive range of self-reported and bio-medically measured variables relating to demographics, risk factors and co-morbidities. It found that the biologi-cal (sex) and socioeconomic (gender) characteristics of men and women with diabetes are different yet equally important, providing a challenge to a range of health pro-fessionals and associated government and non-govern-ment organisations. A number of studies are looking at each sex/gender as a research area, such as the Australian Longitudinal Study on Women's Health and the Florey Adelaide Male Ageing Study. However the NWAH Study is in a unique position to be able to compare men and women, as well as contribute knowledge and substantiate findings in both areas. This study will contribute to the growing body of knowledge about chronic disease aetiol-ogy since it developed into a longitudinal study in 2004. Through the study design, which is based on tracking par-ticipants along a continuum of disease including those at risk, those at the early stages of disease and those develop-ing complications, changes in health status and risk behaviours will be able to be tracked and valuable infor-mation gained for use by public health professionals and researchers.
Competing interests
The authors declare that they have no competing interests.
Authors' contributions
JFG managed the original project from which the data were obtained and wrote the article text. NH, AWT and CRC provided ongoing advice on analysis and drafting. PJP commented on final drafts. All authors have read and approved the final manuscript.
Acknowledgements
The study concept was formulated in November 1999 and was initially funded by grants from The University of Adelaide and SA Health. The authors wish to acknowledge the contribution of the North West Adelaide Health Study participants and clinic staff.
References
1. Krieger N: Genders, sexes and health: what are the connec-tions – and why does it matter? Int J Epidemiol 2003, 32:652-657. 2. Krieger N: Genders, sexes and health: what are the connec-tions – and why does it matter? Int J Epidemiol 2003, 32:652-657. 3. Doyle L, Payne S, Cameron A: Promoting gender equality in health. Manchester: Equal Opportunities Commission 2003 [http:// www.eoc.org.uk/research]. [cited 2009 March 19]
4. Mak K-H, Haffner SM: Diabetes abolishes the gender gap in cor-onary heart disease. Eur Heart J 2003, 24(15):1385-1386. 5. Jonsson PM, Sterky G, Gafvels C, Ostman J: Gender equity in
health care: the case of Swedish diabetes care. Health Care Women Int 2000, 21(5):413-31.
6. Summerson JH, Spangler JG, Bell RA, Shelton BJ, Konen JC: Associ-ation of gender with symptoms and complicAssoci-ations in type II diabetes mellitus. Womens Health Issues 1999, 9(3):176-182. 7. Williams C: Doing health, doing gender: teenagers, diabetes
and asthma. Soc Sci Med 2000, 50(3):387-396.
8. Mak K-H, Haffner SM: Diabetes abolishes the gender gap in cor-onary heart disease. Eur Heart J 2003, 2415:1385-1386. 9. Roeters van Lennep JE, Westerveld HT, Erkelens DW, Wall EE van
der: Risk factors for coronary heart disease: implications of gender. Cardiovasc Res 2002, 533:538-549.
10. Denton M, Prus S, Walters V: Gender differences in health: a Canadian study of the psychosocial, structural and behav-ioural determinants of health. Soc Sci Med 2004, 58:2585-2600. 11. Blazer DG, Moody-Ayers S, Craft-Morgan J, Burchett B: Depression in diabetes and obesity: racial/ethnic/gender issues in older adults. J Psychosom Res 2002, 534:913-916.
12. Huxley R, Barzi F, Woodward M: Excess risk of fatal coronary heart disease associated with diabetes in men and women: meta-analysis of 37 prospective cohort studies. BMJ 2006,
332:73-78.
13. Beckles GLA, Thompson-Reid PE: Diabetes and women's health across the life stages: a public health perspective Atlanta: US Department of Health and Human Services, Centers for Disease Control and Preven-tion, National Center for Chronic Disease Prevention and Health Promotion, Division of Diabetes Translation; 2001.
14. Rubin R, Peyrot M: Men and diabetes: psychosocial and behav-ioural issues. Diabetes Spectrum 1998, 112:81-87.
15. Wannamethee SG, Shaper AG: Weight change and duration of overweight and obesity in the incidence of type 2 diabetes.
Diabetes Care 1999, 228:1266-1272.
16. Wei M, Kampert JB, Barlow CE, Nichaman MZ, Gibbons LW, Paffen-barger RS, Blair SN: Relationship between low cardiorespira-tory fitness and mortality in normal-weight overweight and obese men. JAMA 1999, 28216:1547-1553.
17. Khaw K-T, Wareham N, Luben R, Bingham S, Oakes S, Welch A, Day N: Glycated haemoglobin, diabetes and mortality in men in Norfolk cohort of Europoean Prospective Investigation of Cancer and Nutrition. BMJ 1999, 322(7277):15-18.
18. Dunning T: Sexual health and diabetes. Conquest (Diabetes Aus-tralia) 2002:5-6.
19. Lieberman LS: Dietary, evolutionary, and modernizing influ-ences on the prevalence of type 2 diabetes. Annu Review Nutr
2003, 23:345-377.
20. Australian Institute of Health and Welfare: Diabetes: Australian facts 2008. Diabetes series no. 8. Cat. no. CVD 40 Canberra: AIHW; 2008. 21. Chittleborough CR, Grant JF, Phillips PJ, Taylor AW: The increasing
prevalence of diabetes in South Australia: the relationship with population ageing and obesity. Public Health 2007,
121:92-99.
22. MacDonald J, Crawford D: Recent developments concerning men's health in Australia. Aust J Prim Health 2002, 8(1):77-82. 23. Glover J, Tennant S: A social health atlas of Australia: South Australia
Vol-ume 5. 2nd edition. Adelaide: Public Health Information Development Unit; 1999.
24. Taylor A, Dal Grande E, Chittleborough C, Cheek J, Wilson D, Phil-lips P, Ruffin R: Key biomedical findings, policy implications and research recommendations Adelaide: South Australian Department of Human Services; 2002.
25. Grant J, Chittleborough C, Taylor A, Dal Grande E, Wilson D, Phillips , Adams R, Cheek J, Price K, Gill T, Ruffin R, on behalf of the NWAH Study Team: The North West Adelaide Health Study: detailed methods and baseline segmentation of a cohort along a chronic disease continuum. Epidemiol Perspect Innov 2006, 3:4. 26. Grant J, Taylor A, Ruffin R, Wilson D, Phillips P, Adams R, Price K, the
NWAH Study Team: Cohort Profile: The North West Adelaide Health Study (NWAHS). Int J Epidemiol 2008.
Publish with BioMed Central and every scientist can read your work free of charge "BioMed Central will be the most significant development for disseminating the results of biomedical researc h in our lifetime."
Sir Paul Nurse, Cancer Research UK
Your research papers will be:
available free of charge to the entire biomedical community
peer reviewed and published immediately upon acceptance
cited in PubMed and archived on PubMed Central
yours — you keep the copyright
Submit your manuscript here:
http://www.biomedcentral.com/info/publishing_adv.asp
BioMedcentral
28. Armstrong T, Bauman A, Davies J: Physical activity patterns of Australian adults – results of the 1999 National Physical Activity Survey Canberra: Australian Institute of Health and Welfare; 2000.
29. American Diabetes Association: Diagnosis and classification of diabetes mellitus. Diabetes Care 2004, 27:S5-S10.
30. World Health Organization: Obesity: Preventing and managing the global epidemic – Report of a WHO consultation on obesity Geneva: World Health Organization; 1997.
31. O'Dea K, Walker K, Colagiuri S, Hepburn A, Holt P, Colagiuri R: Evi-dence Based Guidelines for Type 2 Diabetes: Primary Prevention Canberra: Diabetes Australia & National Health and Medical Research Council; 2002.
32. Australian Bureau of Statistics: Australian Demographic Statistics Can-berra: Australian Bureau of Statistics; 2003.
33. Statistical Package for the Social Sciences Inc: SPSS Advanced Statistics 10.0 [computer program] Chicago; 1999.
34. Dean A, Dean J, Coulombier D, Brendel KA, Smith DC, Burton AH, Dicker RC, Sullivan K, Fagan RF, Arner TG: Epi Info Version 6: a word processing, database, and statistics program for epidemiology on microcom-puters Atlanta: Centers for Disease Control and Prevention; 1994. 35. Hosmer DW, Lemeshow S: Applied logistic regression New York: John
Wiley & Sons; 1989.
36. Elwood JM: Critical appraisal of epidemiological studies and clinical trials
New York: Oxford University Press; 1998.
37. Zhang Q, Wang Y: Socioeconomic inequality of obesity in the United States: do gender, age and ethnicity matter? Soc Sci Med 2004, 58:1171-1180.
38. Artazcoz L, Borrell C, Benach J, Cortes I, Rohlfs I: Women, family demands and health. Soc Sci Med 2004, 59:263-274.
39. Virtanen P, Liukkonen V, Vahtera J, Kivimäki M, Koskenvuo M:
Health inequalities in the workforce: the labour market core-periphery structure. Int J Epidemiol 2003, 32(6):1015-1021. 40. McDonald L, Robb AL: The economic legacy of divorce and sep-aration for women in old age. Can J Aging 2004, 23(Suppl 1):S83-97.
41. Shen BJ, Countryman AJ, Spiro A, Niaura R: The prospective con-tribution of hostility characteristics to high fasting glucose levels: the moderating role of marital status. Diabetes Care
2008, 31(7):1293-8.
42. McLaren L: Socioeconomic status and obesity. Epidemiol Rev
2007, 29:29-48.
43. Beer MU: Obesity epidemic: we have to spend to save. Soz Praventivmed 2003, 48:147-148.
44. Australian Institute of Health and Welfare, Dixon T, Waters A-M: A growing problem: trends and patterns in overweight and obesity among adults in Australia, 1980 to 2001. Bulletin No. 8, AIHW Cat. No. AUS36
Canberra: Australian Institute of Health and Welfare; 2003. 45. Chittleborough CR, Grant JF, Phillips PJ, Taylor AW: The increasing
prevalence of diabetes in South Australia: the relationship with population ageing and obesity. Public Health 2007,
121:92-99.
46. Taylor AW, Dal Grande E, Gill TK, Chittleborough CR, Wilson DH, Adams RJ, Grant JF, Phillips PJ, Appleton S, Ruffin RE: How valid are self reported height and weight? A comparison between CATI self-report and clinic measurements using a large rep-resentative cohort study. Aust N Z J Public Health 2006,
30(3):238-46.
47. Denton M, Prus S, Walters V: Gender differences in health: a Canadian study of the psychosocial, structural and behav-ioural determinants of health. Soc Sci Med 2004, 58:2585-2600. 48. Nooyens AC, Visscher TL, Verschuren WM, Schuit AJ, Boshuizen
HC, van Mechelen W, Seidell JC: Age, period and cohort effects on body weight and body mass index in adults: The Doet-inchem Cohort Study. Public Health Nutr 2008, 24:1-9.
49. Dal Grande E, Taylor A, Wilson D: Is there a difference in health estimates between people with listed and unlisted telephone numbers? Aust N Z J Public Health 2005, 29:448-56.