Open Access
Research
Equity in health care in Namibia: developing a needs-based resource
allocation formula using principal components analysis
Eyob Zere*
1, Custodia Mandlhate
2, Thomas Mbeeli
3, Kalumbi Shangula
3,
Kauto Mutirua
3and William Kapenambili
3Address: 1World Health Organization, P.O. Box 30309, Lilongwe, Malawi, 2World Health Organization, P.O. Box 3444, Windhoek, Namibia and 3Ministry of Health and Social Services, Private Bag 13198, Windhoek, Namibia
Email: Eyob Zere* - [email protected]; Custodia Mandlhate - [email protected]; Thomas Mbeeli - [email protected]; Kalumbi Shangula - [email protected]; Kauto Mutirua - [email protected]; William Kapenambili - [email protected] * Corresponding author
Abstract
Background: The pace of redressing inequities in the distribution of scarce health care resources in Namibia has been slow. This is due primarily to adherence to the historical incrementalist type of budgeting that has been used to allocate resources. Those regions with high levels of deprivation and relatively greater need for health care resources have been getting less than their fair share. To rectify this situation, which was inherited from the apartheid system, there is a need to develop a needs-based resource allocation mechanism.
Methods: Principal components analysis was employed to compute asset indices from asset based and health-related variables, using data from the Namibia demographic and health survey of 2000. The asset indices then formed the basis of proposals for regional weights for establishing a needs-based resource allocation formula.
Results: Comparing the current allocations of public sector health car resources with estimates using a needs based formula showed that regions with higher levels of need currently receive fewer resources than do regions with lower need.
Conclusion: To address the prevailing inequities in resource allocation, the Ministry of Health and Social Services should abandon the historical incrementalist method of budgeting/resource allocation and adopt a more appropriate allocation mechanism that incorporates measures of need for health care.
Background
In sub-Saharan Africa, health sector reforms have been under way since the 1980s. One of the parameters used to assess the effectiveness of reforms in achieving their stated objectives has been their effect on equity. Equity was enshrined in the World Health Organization's Alma Ata declaration as one of the pillars of the Primary Health
Care (PHC) strategy [1]. Equity in access to health care and other social amenities is also one of the tenets of the Universal Declaration of Human Rights. Hence, albeit with varying degrees of explicitness and clarity, the con-cept and principles of equity feature in the health policies of most countries.
Published: 29 March 2007
International Journal for Equity in Health 2007, 6:3 doi:10.1186/1475-9276-6-3
Received: 4 May 2006 Accepted: 29 March 2007
This article is available from: http://www.equityhealthj.com/content/6/1/3
© 2007 Zere et al; licensee BioMed Central Ltd.
As part of its PHC strategy, the Namibian Ministry of Health and Social Services (MOHSS) considers equity as one of its guiding principles in allocating health care resources. This is then reflected in their desire to improve the health outcomes of the poor and disadvantaged.
In its health policy framework, the MOHSS makes the fol-lowing statement on equity [2]:
"All Namibians shall have equal access to basic health care & social services provided by the Ministry. Particular emphasis shall be paid to resource distribution patterns in Namibia to identify and accelerate the correction of disparities".
Furthermore, the country's Poverty Reduction Strategy (PRS) commits the government to reduce inter-regional disparities in health expenditure per capita through an appropriate resource allocation formula [3]. However, despite the government's initiatives and equity-orientated health and social policies, there has not been a significant reallocation of resources in favour of the poor regions. The pace of change in decreasing inequities in resource allocation inherited from the apartheid era has not been as fast as was expected. This is explained at least in part by the fact that resources are allocated on the basis of an his-torical incrementalist type of budgeting. Those regions which are historically disadvantaged in having a higher disease burden, continue to receive an inequitably small share of the health care budget.
Namibia is one of those countries with high levels of ine-quality in both income and access to resources, including health care. The country's gini index, which is 70.7, is the highest recorded measure of income inequality in the world [4]. The glaring inequalities in income, in access to resources more generally and in health outcomes that are observed in the country are partly attributable to the exclusionary policies of the apartheid regime that pre-vailed before the country gained its independence in 1990. Although the existence of high levels of inequalities is not unexpected given the country's history, there is a need to generate a solid evidence base to guide future pol-icies for resource allocation to attempt to reduce these ine-qualities. Health care resources need to be redistributed to those regions with greater levels of need,. This entails a move away from the traditional historical incrementalist basis for allocating resources.
In turn to monitor the impact of policies that are aimed at improving the status of the disadvantaged and measure such changes involves first identifying the poor and vul-nerable and second developing appropriate criteria for allocating resources. 'Appropriate' here means based on some assessment of need. Well-targeted health resources can contribute to the improvement of the health status of
the worse off in the population, to the achievement of the Millennium Development Goals (MDGs) and to the tar-gets of the country's own initiatives on equity – Vision 2030 and National Development Plans.
The study reported here has been conducted to provide this information to shed light on how an improved mech-anism for health care resource allocation in the public health sector in Namibia might result from the develop-ment of an equitable funding formula. The more specific objective of the study is to devise regional weightings for the development of such a needs-based resource alloca-tion formula.
Undertaking such a study is significant and relevant for Namibia because it is in line with government policies aimed at reducing inequities in health and health care. The information generated will contribute to policy changes that will assist in bridging the present inequities in the allocation of health care resources.
Brief country profile
Namibia is a country in south-western Africa covering an area of 824,116 square kilometres. According to the 2001 Census, the country's population was a little more than 1.8 million with a growth rate of 2.6 per cent per annum [5]. The country's health and development indicators are depicted in Table 1. As can be seen, most of the health and development indicators are considerably better than those observed in the rest of sub-Saharan Africa. However, it is worthwhile assessing changes in the indicators to appreci-ate the magnitude of the health and development chal-lenges that the country faces. The life expectancy at birth
Table 1: Namibia – health and development indicators
Characteristic Value
Life expectancy at birth (male/female) (years) 48/50 Infant mortality rate (per 1000 live births) 38 Under-five mortality rate (per 1000 live births) 62
Total fertility rate 4.2
Maternal mortality ratio (per 100,000 live births) 271 One year olds fully immunized against measles, 2003 (%) 70 Stunting in under-five children (%) 24.0 Gross national income per capita, 2003 (US$) 2,120 GDP per capita annual growth rate 1990–2003 (%) 0.9 Population living below US$1 a day, 1990–2003 (%) 34.9
Human development index, 2003 0.627
Adult literacy rate (15 years and above), 2003 (%) 85
HIV prevalence rate (%) 19.8
Prevalence of tuberculosis (per 100,000) 635 Malaria mortality rate (per 100,000) 39 Per capita total expenditure on health (PPP US$) 331
Health expenditure as % of GDP 6.7
Physician per 100,000 population 30
of males and females in 1991 was 59 and 63 years respec-tively. The table shows a decrease from then in the order of 11 to 13 years respectively. This decline is largely attrib-utable to the HIV/AIDS epidemic. Furthermore, the Human Development Index (HDI) which is an indicator of society's welfare as measured by a composite index that includes GDP per capita, longevity and education has declined substantially to 0.627 from its 1995 level of 0.693.
The figures in the above table are population averages and therefore mask the wide differences in the indicators in the different population groups. Disaggregating some of the above figures by socio-economic status reveals the dual nature of the Namibian society, where there are char-acteristics of both developed and developing countries. While the HDI for the European language speakers in Namibia is above the minimum point for what is classed as 'high human development', for some language groups such as the San-speaking people, the HDI is even lower than the average for sub-Saharan Africa [12]. The share of income of the richest 10 per cent of the population is 129 times that of the poorest decile [4]. While the prevalence of stunting in the lowest wealth quintile is about 26.7 per cent, it is only 15.3 per cent for the richest income quin-tile. Thus, even though the population averages of the indicators are favourable compared to those of other countries in sub-Saharan Africa, these can be misleading. They conceal the fact that many people are systematically excluded from access to the nation's resources.
In general communicable diseases account for the greatest share of the disease burden. However, facility-based statis-tics also indicate that non-communicable diseases are on the increase, thus compounding the problems for the country's health system. To address the multitude of chal-lenges facing Namibia, the government has put in place various multi-sectoral initiatives. These include the Vision 2030, 5-year National Development Plans (NDPs), a pov-erty reduction strategy and action programme and medium term plans for the control of HIV/AIDS. Further-more, there has been a gradual move towards perform-ance-based budgeting and medium-term expenditure frameworks (MTEFs) in order to improve the efficiency of the overall economy.
Equity in health care: steps in the development of a needs-based resource allocation formula
The concept of equity in health care has been widely debated over the years. Although equity may be defined in many ways, all of its definitions revolve around a com-mon point: the fair distribution of something (such as health services) among different individuals and groups in society. Resource allocation refers to the process by which available resources are distributed among
compet-ing needs. It is a means of achievcompet-ing the ministry's objec-tive of making access to basic health services more equal and ultimately improving health status. Some of the approaches used in resource allocation include political negotiation, incremental budgeting and allocation according to health care needs. The focus of this study is on developing a needs-base resource allocation formula. It is therefore appropriate to spell out the steps involved in its development. These are [13]:
(i) Developing a clear operational definition of equity
Central to such a definition is the notion of fairness or jus-tice; however, countries may define equity in different ways. Whatever definition is adopted then influences the steps involved in achieving an equitable allocation of resources. The MOHSS definition discussed above is lim-ited in that it does not take into account differential health needs nor does it provide a clear definition of access. For the purposes of this study equity in health care is defined as equal access to a basic package of services for equal need, where:
- Need refers to both the "capacity to benefit" and the "severity of illness"; and
- Access refers to the barriers, mainly financial and geo-graphical, faced by potential users.
(ii) Developing a needs-based formula
The size of the population in a geographic area is the pri-mary indicator of need for health services. Population size can then be weighted by a range of other indicators of rel-ative need such as the demographic composition of the population; amounts of sickness; the level of deprivation (in so far as this influences the level of ill-health in an area); the communities' ability to pay for health care costs; and their level of dependence on public sector health serv-ices [14].
(iii) Differing costs of service provision
There may be variation in the cost of delivering similar services in different geographic areas of a country. This is likely to be related to input prices (e.g. labour costs) and rough terrain/remoteness, which may inflate transporta-tion costs and increase staff remuneratransporta-tion (relief/hardship allowance). Furthermore, this may also reduce input pro-ductivity and consequently increase costs. Therefore, it is important to accommodate such cost differentials in allo-cating resources.
(iv) Other funding sources
The attainment of equal access to basic health services entails taking into account other funding sources such as payments from private households, insurance and devel-opment partners. For example in South Africa, members of medical aid schemes are excluded from the base popu-lation used for resource allocation purposes [13]. How-ever, this requires that accurate expenditure data are available. A number of countries including Namibia are currently trying to address this issue through a National Health Accounts (NHA) exercise.
In developing countries in general there remain problems in developing needs-based resource allocation formulae. These include:
1. Lack of reliable and timely data.
2. The tendency to create perverse incentives, e.g. that exaggerate the size of the population or to seek to influ-ence other factors that make up any allocation formula.
3. The exclusion of certain services from the formula can become problematic. For example some essential services may be considered national services, hereas others may be considered as regional or district services. There is often no clear agreement about such definitions.
4. Defining what is contained in the basic package of serv-ices may be difficult. Additionally it may be the case that the package does not address the needs of the poor which is then contrary to the principle of equitable resource allo-cation.
Study methodology
Data Sources
Data used for the study were obtained from the Namibia Demographic and Health Survey (DHS) 2000. These were taken as proxies for household income/consumption data as these latter do not in fact exist.
Data analysis
The indicator of need was based on the computation of asset indices for each Household. These take into account a set of asset-based and health-related variables.
The most accurate poverty indices would be computed from household consumption data. The absence of such information in the DHS however precludes its use. There-fore there is a need to rely on some other data. Studies have shown that there is a close relationship between asset indices and consumption expenditure. (See for example Filmer and Pritchett [15], in their study on the education sector in India.) Hence in the absence of reliable house-hold income and expenditure data, the use of asset indices becomes important.
These included:
- Whether a household has electricity, radio, television, refrigerator, any bicycles, any motorcycles, a car or a tele-phone (each coded as 1 = Yes and 0 = No);
- The main household source of drinking water (seven cat-egories);
- The main type of toilet facility used by the household (six categories); and
- The main type of floor in the household (five categories).
The result obtained from the first principal component is usually used to develop the asset index based on the fol-lowing formula:
In the above formula:
Aj is the asset index of the jth household
f1 is the scoring factor for the first asset as determined by the procedure;
aj1 is the jth household's value for the first asset; and
a1 and s1 are the mean and standard deviation of the first asset variable over all households.
Data were analysed using STATA/SE 8.2 and Microsoft excel.
Results
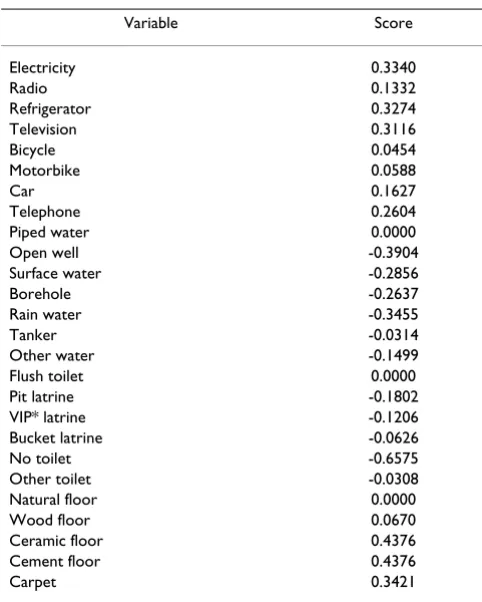
The asset and health-related variables used in the PCA model showed a pattern that is consistent with what would have been expected. The assets that are likely to be owned by the better-off household have positive values, which increase the household's asset index. On the other hand, those that characterize poor households (e.g. a pit latrine and an open well) have negative values, which result in a decreased asset index. The scoring factors from the PCA model are set out in Table 2.
These scoring factors were fed into Equation 1 to derive the asset indices. In other words, the products of the scor-ing factors and the standardized value of the asset and health-related variables give the asset index. For this pro-cedure, the indices for the 13 regions were computed. These are presented in Table 3. It should be noted that it was not possible to compute indices for the 34 health dis-tricts, as data do not allow this. The index values depicted in Table 3 have negative values for regions that are tively less deprived and positive for those that are rela-tively more deprived. It can be seen that regions such as Ohangwena, Omusati and Caprivi have the highest posi-tive values indicating the presence of relaposi-tively higher lev-els of deprivation.
In deriving a resource allocation formula that includes asset indices, there is a need to normalize the indices in Table 3[14]. This means giving the least deprived region a value of 1 and expressing all other regions in relation to that value. To this end, we added 1.0417 to all the asset indices of the regions – a figure that makes the value of the least deprived region (Hardap) equal to 1. The resultant
values were used as weights to adjust the population of each region for resource allocation purposes. These values are presented in Table 4.
As can be observed from Table 4, the regional share of weighted population increases for those regions that are relatively more deprived. For example, the unweighted share of population for Ohangwena is 12.5%. However, after weighting with the normalized asset index, the share
A f a a
s f
a a
s
j
j
n
jn n
n
= ×⎛ −
⎝
⎜⎜ ⎞⎠⎟⎟ + + ×⎛⎝⎜⎜ − ⎞⎠⎟⎟
1
1 1
1
...
Table 3: Asset indices by region
Region Index
Caprivi 0.1328
Erongo 0.0138
Hardap -0.0417
Karas -0.0093
Khomas 0.1084
Kunene -0.0032
Ohangwena 0.2481
Kavango 0.0465
Omaheke 0.0039
Omusati 0.1730
Oshana 0.0609
Oshikoto 0.0584
Otjozondjupa -0.0225
Table 2: Scoring factors
Variable Score
Electricity 0.3340
Radio 0.1332
Refrigerator 0.3274
Television 0.3116
Bicycle 0.0454
Motorbike 0.0588
Car 0.1627
Telephone 0.2604
Piped water 0.0000
Open well -0.3904
Surface water -0.2856
Borehole -0.2637
Rain water -0.3455
Tanker -0.0314
Other water -0.1499
Flush toilet 0.0000
Pit latrine -0.1802
VIP* latrine -0.1206
Bucket latrine -0.0626
No toilet -0.6575
Other toilet -0.0308
Natural floor 0.0000
Wood floor 0.0670
Ceramic floor 0.4376
Cement floor 0.4376
Carpet 0.3421
increased to 14.3%. In other words, if we allocate resources on the basis of weighted population, the alloca-tion share of Ohangwena region will increase by about 2 percentage points. This is an adjustment to the region's increased needs as indicated by the asset indices.
Thus, in allocating resources based on the asset index, it is important that we focus on weighted population in order to take account of the differential needs for health care. To illustrate this, Figure 1 presents the actual allocation of the 2000/2001 financial year's budget of the Ministry of
Health and Social Services and contrasts them with the equity target share of the budget.
As can be seen from Figure 1, there are major inequities in the distribution of public sector healthcare resources between regions. For example, Ohangwena, which is rela-tively speaking the most deprived region, receives a budget that is about 89% less than it would get with its equitable share. On the other hand, Hardap, which is the least deprived region, receives a budget that is about 73% more than its equitable share.
Discussion
This study has attempted to shed light on issues of health resource allocation in Namibia, with the aim of generat-ing the evidence required to move away from historical incrementalism towards a needs-based allocation. Based on data from DHS 2000, PCA was used to develop asset indices as proxies for the regional population's need for health care. Indices were computed using asset-based and health-related variables. These largely reflect levels of material deprivation. However, given the well-established relationship between income poverty and indicators of health status, the asset indices may be considered as prox-ies for health care needs.
Due to lack of data on micro-geographic areas (e.g. health districts, constituencies, etc.), the study has focussed on developing criteria to allocate resources among the thir-teen regions. The analysis at regional level has its limita-tions in that the population is unlikely to be homogeneous in its characteristics across a whole region, implying that there are going to be deprived areas within relatively well-off regions. Therefore it is desirable to
Equity share vs. actual budget for 2000/2001 financial year Figure 1
Equity share vs. actual budget for 2000/2001 financial year.
NB: The budgets do not include central administrative costs, as the central Ministry of Health and Social Services is a supra-regional entity.
Actual budget Equity share
Otjozondjupa Oshikoto
shana O
musati Ohangwena
unene K
omas Kh Kavango
aras K
rdap Ha E ongor
Caprivi
O Omaheke
150000 50,000 100000
N$) Budget allocation in '000 ( 0
Table 4: Normalized asset indices and weighted population
Region Normalized asset index
Population 2001 Population weighted by asset index
Share of unweighted population (%)
Share of weighted population (%)
Caprivi 1.1747 79,826 93,771 4.4 4.5
Erongo 1.0489 107,663 112,923 5.9 5.5
Hardap 1 68,249 68,249 3.7 3.3
Karas 1.0344 69,329 71,717 3.8 3.5
Khomas* 1.1387 250,262 284,978 13.7 13.8
Kunene 1.0377 68,735 71,330 3.8 3.5
Ohangwena 1.2889 228,384 294,373 12.5 14.3
Kavango* 1.0901 202,694 220,968 11.1 10.7
Omaheke 1.0530 68,039 71,648 3.7 3.5
Omusati 1.2162 228,842 278,324 12.5 13.5
Oshana* 1.1087 161,916 179,513 8.8 8.7
Oshikoto 1.0996 161,007 177,051 8.8 8.6
Otjozondjupa 1.0199 135,384 138,073 7.4 6.7
Publish with BioMed Central and every scientist can read your work free of charge "BioMed Central will be the most significant development for disseminating the results of biomedical researc h in our lifetime."
Sir Paul Nurse, Cancer Research UK
Your research papers will be:
available free of charge to the entire biomedical community
peer reviewed and published immediately upon acceptance
cited in PubMed and archived on PubMed Central
yours — you keep the copyright
Submit your manuscript here:
http://www.biomedcentral.com/info/publishing_adv.asp
BioMedcentral establish district-level databases to promote the equitable
allocation of resources within regions.
The results of the PCA model have identified those regions that are regarded as relatively poor in line with the find-ings of other studies such as the Namibia Human Devel-opment Report, 2000/2001 [12]. The model identified Caprivi, Ohangwena and Omusati regions as being the most deprived. The same regions emerge as being worst-off in terms of their human development indices. There is a similar agreement between the two in identifying the least deprived regions. The human development index captures material and social welfare, as it is composed of per capita income, education (literacy rate and school enrolment) and longevity.
The fact that the results of the PCA model agree with the human development indices adds to the credibility of the model as a measure of not only material but also social deprivation. The study reveals inequities at present in the distribution of health care resources between regions. The regions with more need for health care currently get a lower share of the public sector resources, while those with relatively less need are allocated a greater share of resources. This is in line with the inverse care law. Unless the current system of resource allocation is changed to take account of differential regional needs, inequities that were inherited from the past will be perpetuated. In Namibia, the current allocation of resources falls short of equal expenditure per capita. Therefore moving towards needs-based allocation will take some time. In the interim, it is recommended that measures be taken towards achieving equal expenditure per capita. This should be done through a levelling-up approach, to avoid any negative consequences on the health system, in terms of either health or politically.
Competing interests
The author(s) declare that they have no competing inter-ests.
Authors' contributions
EZ designed the study, performed the analysis and drafted the report; TM participated in the collection of data, anal-ysis and write-up of the report; KS, KM and CM partici-pated in the write-up of the report; WK participartici-pated in data collection and report write-up; All authors read and approved the final manuscript.
Acknowledgements
We thank the Regional Network for Equity in Health in Southern Africa (EQUINET) and the World Health Organisation for their financial and tech-nical support provided to undertake this study. We are highly indebted to Professor Diane McIntyre of the Health Economics Unit, University of Cape Town and EQUINET health financing theme coordinator for her expert advice. We also thank an anonymous reviewer who has substantially
improved the first version of the manuscript. All errors of omission or commission are the sole responsibility of the authors.
References
1. World Health Organization: Primary Health Care: Report of the Interna-tional Conference on Primary Health Care Alma-Ata, USSR; 1978. 2. Ministry of Health and Social Services: Towards achieving health and
social well being for all Namibians: A policy framework Windhoek; 1998. 3. National Planning Commission: Namibia Poverty Reduction Strategy
Windhoek; 2002.
4. United Nations Development Programme: Human Development Report 2004 New York; 2004.
5. National Planning Commission: 2001 Population and housing census
Windhoek; 2003.
6. Ministry of Health and Social Services: Namibia Demographic and Health Survey 2000 Windhoek; 2004.
7. World Bank: World Development Report 2004: Making services work for poor people Washington, DC; 2004.
8. United Nations Development Programme: Human Development Report 2004: Cultural liberty in today's diverse world New York; 2004. 9. Ministry of Health and Social Services: 2004 HIV/AIDS sentinel
sero-sur-vey results: Media Release Windhoek; 2004.
10. World Health Organization: Global tuberculosis control: Surveillance, planning, financing. Geneva; WHO Report 2005 (WHO/HTM/TB/ 2005.349) 2005.
11. World Health Organization: The World Health Report 2004: Changing history Geneva; 2004.
12. United Nations Development Programme: Namibia Human Develop-ment Report 2000/2001 Windhoek; 2004.
13. Mark P: Allocating Public Resources for Health: Developing Pro-poor Approaches London: The DFID Health Systems Resource Centre; 2002.
14. Regional Network for Equity in Health in Southern Africa: Deprivation and Resource Allocation: Methods for Small Area Research Harare; 2003. EQUINET Policy Paper No. 10
15. Filmer D, Pritchett L: Estimating wealth effects without expenditure data – or tears: An application to educational enrolments in States of India