R E S E A R C H
Open Access
Out-of-pocket expenditure and catastrophic
health spending on maternal care in public
and private health centres in India: a
comparative study of pre and post national
health mission period
Sanjay K. Mohanty
1*and Anshul Kastor
2Abstract
Background:The National Health Mission (NHM), one of the largest publicly funded maternal health programs worldwide was initiated in 2005 to reduce maternal, neo-natal and infant mortality and out-of-pocket expenditure (OOPE) on maternal care in India. Though evidence suggests improvement in maternal and child health, little is known on the change in OOPE and catastrophic health spending (CHS) since the launch of NHM.
Aim:The aim of this paper is to provide a comprehensive estimate of OOPE and CHS on maternal care by public and private health providers in pre and post NHM periods.
Data and method:The unit data from the 60th and 71st rounds of National Sample Survey (NSS) is used in the analyses. Descriptive statistics is used to understand the differentials in OOPE and CHS. The CHS is estimated based on capacity to pay, derived from household consumption expenditure, the subsistence expenditure (based on state specific poverty line) and household OOPE on maternal care. Data of both rounds are pooled to understand the impact of NHM on OOPE and CHS. The log-linear regression model and the logit regression models adjusted for state fixed effect, clustering and socio-economic and demographic correlates are used in the analyses.
(Continued on next page)
* Correspondence:sanjayiips@yahoo.co.in;sanjay@iips.net
1Department of Fertility Studies, International Institute for Population
Sciences (IIPS), Govandi Station Road, Deonar, Mumbai 400088, India Full list of author information is available at the end of the article
(Continued from previous page)
Results:Women availing themselves of ante natal, natal and post natal care (all three maternal care services) from public health centres have increased from 11% in 2004 to 31% by 2014 while that from private health centres had increased from 12% to 20% during the same period. The mean OOPE on all three maternal care services from public health centres was US$60 in pre-NHM and US$86 in post-NHM periods while that from private health center was US$170 and US$300 during the same period. Controlling for socioeconomic and demographic correlates, the OOPE on delivery care from public health center had not shown any significant increase in post NHM period. The OOPE on delivery care in private health center had increased by 5.6 times compared to that from public health centers in pre NHM period. Economic well-being of the households and educational attainment of women is positively and significantly associated with OOPE, linking OOPE and ability to pay. The extent of CHS on all three maternal care from public health centers had declined from 56% in pre NHM period to 29% in post NHM period while that from private health centres had declined from 56% to 47% during the same period. The odds of incurring CHS on institutional delivery in public health centers (OR .03, 95% CI 0.02, 06) and maternal care (OR 0.06, 95% CI 0.04, 0.07) suggest decline in CHS in the post NHM period. Women delivering in private health centres, residing in rural areas and poor households are more likely to face CHS on maternal care.
Conclusion: NHM has been successful in increasing maternal care and reducing the catastrophic health spending in public health centers. Regulating private health centres and continuing cash incentive under NHM is recommended.
Keywords: National Health Mission, National Rural Health Mission, Maternal care, Delivery care, Catastrophic health spending, Out-of-pocket expenditure, India
Background
Reduction of maternal mortality, neonatal and under-five mortality and financial risk protection are three key health related targets of sustainable devel-opment goals (SDGs) [1]. Achieving health related SDGs required significant investment in maternal and child health to protect households from high out-of-pocket expenditure (OOPE) and catastrophic health spending (CHS). High OOPE is positively associated with CHS and reduced access to health services, increases untreated morbidity, reduce con-sumption of goods and services, and lead to long-term impoverishment [2]. The level of CHS varies across countries, among socio-economic groups and by nature and type of health services. Cross country studies suggest that households with low educational attainment, lower economic status, without health insurance and residing in rural areas are more likely to incur CHS [3–6]. The OOPE and CHS are high for maternal services in many developing countries including India [7, 8].
Estimates of OOPE and CHS on health care are gaining increasing research and programmatic atten-tion. A growing number of studies from developing countries suggest that the health care payment has increased the poverty level and affect the poor most [9–11]. Globally, OOPE studies on maternal care addressed socioeconomic and demographic differen-tials and estimated the incidence and correlates of
CHS. The general findings suggest higher OOPE for caesarean delivery, complicated delivery, deliveries in private health centres and for higher socio-economic groups [12–16]. The global progress in improvement of maternal and child health and re-duction of CHS is contingent on India’s success on these indicators.
Maternal and child health in pre and post NHM periods in India
India with one-sixth of the world’s population, fed-eral nature of governance and sustained economic growth, is undergoing health transition. The health-care system in the country is characterized by the presence of both public (central, state and local gov-ernment) and private health care providers, varying delivery structures and multiple systems of medicine [17]. While health is a state subject (within the state government) the central government helps in policy making, planning, guiding, evaluating and providing the funding to implement the national program. The utilization of health services from private health care providers is generally linked to the ability to pay and quality of care.
women perceived cost as a major barrier to the utilization of maternal care. As a policy response, the Government of India launched the National Rural Health Mission (NRHM) in 2005 to improve the health system by providing universal access to equit-able, affordable and quality health care. The NRHM intended to reduce maternal and child mortality and OOPE on maternal care in rural areas of 18 states that had poor health infrastructure and health indica-tors. Subsequently, the program was extended to all the states and urban areas in the country and renamed as National Health Mission (NHM). The key components of NHM are Janani Suraksha Yojana (JSY) and Janani Shishu Suraksha Karyakram (JSSK). The JSY is a cash incentive scheme provided to mothers for delivering at public health centres or accredited health centers [18]. The incentive to mothers varies in rural and urban areas and in low and high performing states. Besides, it covers the in-centive to Accredited Social Health Activist (ASHA). The JSSK, launched in 2011 entitled all pregnant women to deliver in public health institutions abso-lutely free and free treatment to sick infants up to 1 year. Over ten million pregnant women are provided cash incentives under the scheme annually. Details of the NHM are documented elsewhere [19].
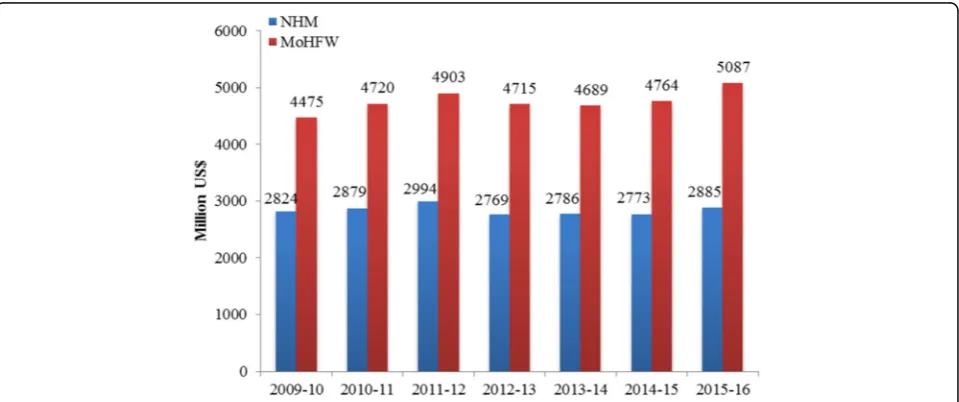
Figure 1 presents the trends in health budget and that of NHM over time at constant prices [1US$ = 65.43]. The NHM accounts for more than half of the health spending of the central government over time. In 2014–15, about US$ 2626 million
(Rupees 16,809 crores) were spent on NHM [20]. The recently released National Health Policy, 2017 highlights the success of NHM in the public health system and aim to reduce IMR to 26 per 1000 live births by 2019 and MMR to 100 per 100,000 live births by 2020 [21].
Since the implementation of NHM in 2005, there has been significant progress in maternal and child health in the country. Trends in IMR and MMR sug-gest substantial improvements in the post NHM period; IMR declined from 58 in 2004 to 40 per 1000 live births in 2013 (31% decline in the post NHM period) [22, 23] and MMR declined from 254 in 2004–06 to 167 per 100,000 live births in 2011–13 (34% decline) [24, 25]. Process indicators such as pre-natal care, institutional delivery and postpre-natal care have shown significant progress in India [26]. JSY had a significant impact on increasing antenatal and natal care and reducing perinatal and neo-natal deaths [27]. Several small-scale studies have examined the success and constraints of the program [28–31]. Besides im-proving maternal and child health survival, the NHM was intended to reduce the OOPE and CHS on deliv-ery, prenatal and post natal care. Though a number of studies have examined the differentials and deter-minants of maternal care [32–34], there are limited studies on the economic burden of maternal care over time in India.
The first systematic attempt on estimating OOPE and CHS on maternal care for India suggest high CHS to poor, rural households and the less educated
[7]. The OOPE on delivery care varies largely across states and household characteristics [35]. Studies also found that maternal care in India placed a high economic burden on households and suggested reduction in OOPE to benefit the poor [36–38].
The aim of this paper is to estimate the OOPE and CHS on maternal care before the launch of the National Health Mission in India and a decade later. It addresses the research question whether the OOPE and CHS on maternal care have declined in the post NHM period? The paper has been concep-tualized with the following rationale. First, large-scale investment in the public health programs of developing countries has large opportunity costs. Though there has been significant reduction in ma-ternal and child mortality and increase in mama-ternal care utilization in public health centres in the post NHM period, there is no study that has examined the OOPE by public and private health care pro-viders in the pre and post NHM period. Understand-ing the level of OOPE in the pre and post NHM periods will help assess the functioning of the pro-gram and will be of immense help to multiple stake-holders. Second, both public and private entities in India are providers of maternal care services and are guided by varying principles. Hence, any systematic analyses in understanding the effectiveness of the program should focus on disaggregated analyses by type of provider (public-private). Third, high OOPE on health care is associated with higher CHS and in-creasing poverty [39, 40]. Studies also suggest that the medical care costs has been rising faster than the overall well-being of the households [41]. Reduc-tion of CHS among the poor and marginalized was one of the main objectives of NHM and analyses on CHS need to be sensitive to account the health spending among the poor.
The paper is organized as follows: Section I gives a brief introduction of NHM and delineates the pro-gress of maternal and child health in the post NHM period, Section II presents data and method, while Section III presents the results and Section IV pro-vides discussion and conclusion.
Methods Data
The unit data of the 25th Schedule of the 60th and 71st rounds of the National Sample Survey (henceforth referred to as 60th and 71st respectively) is primarily used in the analyses. Both rounds of the surveys are population based nationally representa-tive surveys, similar with respect to design, content and coverage and provide comprehensive infor-mation on morbidity, health care and cost of
Outcome
OOPE and CHS are two outcome variables, computed for delivery care, and maternal care (pre-natal, natal and post-natal) by type of health care provider (public-private). In computing the maternal care from private and public sources, we consider only those women who availed these three services either from the public or private. The OOPE is defined as the ex-penditure incurred by the women during pre-natal, institutional delivery and post-natal care net of reim-bursement. Expenditure on prenatal care, institutional delivery and postnatal care was directly available in the data set and were summed to obtain expenditure on total maternal care. The CHS is defined as the health spending over 40% of household’s capacity to pay. The consumption expenditure data of the house-hold and the state specific poverty line is used in de-riving the household’s capacity to pay.
Covariates
Individual and household level covariates are used in the analyses. The household characteristics pertain to the head of the household while individual characteristics pertain to the woman. The selection of covariates is guided by availability of variables in data set and literatures. The covariates included are age, residence (rural/urban), educational level, caste1 (Scheduled Tribe, Scheduled Caste, Other Backward Classes and Others), religion (Hindu, Muslims and Others), monthly per capita consumption expend-iture (MPCE) quintile and household type (labourer household and others). We have also introduced an interaction term in the regression model, namely, type of health care provider and time (pre and post NHM) to capture the effect of time and source of provider in explaining change in OOPE and CHS in India.
Analytical methods
Descriptive statistics, estimation of CHS, log linear re-gression and the logit rere-gression models are used in the analyses. In literature, two alternative approaches are used in estimating CHS, both using capacity to pay (CTP). The approach suggested by Berki (1986) and later by Van Doorslar et al. (2007) defines CHS as a proportion of consumption expenditure (usually 10% and more) [46, 47]. The limitation of this ap-proach is its inability to account for the CHS of poorer sections as the poor spend less on health due to their lower ability to pay. Studies have demon-strated the limitation of this method in the empirical estimation of maternal expenditure [7]. The second approach by Xu et al. (2003) [3] derives CTP by
deducting the subsistence expenditure (SE) and is largely used in literatures [48, 49]. It defines CHS;
CHSi¼OOPEi=ðXif Xð ÞÞ>¼z ð1Þ
Where Xi is the consumption expenditure of ith
household and f(X) is the subsistence expenditure of the population. The SE is estimated either using me-dian food expenditure or as poverty line of the spe-cific country/region. Unfortunately, the health surveys in India do not collect detailed consumption expend-iture and therefore the food expendexpend-iture is not available. In such cases, we have used the state spe-cific poverty line to account for the subsistence ex-penditure. This approach is sensible where the poor are concerned, as those households below poverty line are classified as incurring CHS if they incurred OOPE for maternal care. The cut-off point of CHS is nor-mative and usually taken as 40% in literature. Thus, a household is said to incur CHS if its health spending exceeds 40% of its capacity to pay.
To understand the impact of NHM on OOPE and CHS, we have pooled the variables of both rounds of health surveys. Two types of regression models are used; a log linear regression model for OOPE and a logit regression model for CHS. The log linear regres-sion model was estimated as OOPE was continuous variable and skewed in nature. The logit model was used as the CHS was dichotomous variable, 0 for not incurring catastrophic health spending and 1 for in-curring catastrophic health spending. Both set of models were estimated for delivery care and maternal care. We clustered standard error by first stage sam-pling unit (village/urban blocks). Each of the regres-sion models were adjusted for state and time (survey-year) fixed effect. The fixed effects are captured at the state level because the states in India exhibit large variation in demographic, social, economic and health parameters. Also, health is a state subject and the state makes policies, programs and implement uni-formly across the state. Besides, the state fixed effect model captures the unobserved factors in the regres-sion model.
The regression models used for OOPE is defined as
ln OOPEð iÞ ¼αþβ1resiþβ2ageiþβ3educi
þβ4mpceqtiþβ5castei
þβ6religioniþβ7htypei
þβ8INT NHM SOUiþβ9statei
þei ð2Þ
of the household, religion is religion of the household, htype is the type of household (labourer or non-labourer household). INT_NHM_SOU is the inter-action term computed based on time (pre / post NHM) and source of providers (public/private). These are public*preNHM, private*preNHM, public*postNHM and private*post NHM. The interaction term helps to understand the role of NHM in reducing the CHS in public/private health centres. A total of 36 states and union-territories are included in the analyses. The sub-script i is used for ith woman.
Similarly, the regression models used for CHS is de-fined as
logitð Þ ¼πi αþβ1resiþβ2ageiþβ3educi
þβ4mpceqtiþβ5castei
þβ6religioniþβ7htypei
þβ8INT NHM SOUiþβ9statei ð2Þ
where πi is the probability of incurring catastrophic health spending for delivery/maternal care of ith household. The model estimates the log odds of in-curring CHS adjusted for a set of explanatory vari-ables. All explanatory variables are same as of Eq. (1) except age and education. Information on age and education of the head of the household is used, as household is the unit of analyses and there are cases where more than one woman had delivered from the same household. Results are presented with the help of regression coefficients, odds ratio and 95% CI.
Results
The mean age of women was 25.52 years in 2004 and 25.69 years in 2014. In 2004, 52.03% women were illiterate, 43.48% had primary education and 4.49%
had secondary and above education. In 2014, 28.58% women were illiterate, 23.24% had primary and 48.18% had secondary and above educated. The MPCE of the household was 1066 rupees in 2004 and 1311 rupees at 2014 prices. About 34.17% households were labourer households in 2004 compared to 28.46% in 2014 (Table not shown). Table 1 presents the definition of variables used and the descriptive statistics. The utilization of maternal care has in-creased from both public and private health providers and the increase was larger from public health center. On the other hand, the increase in OOPE in private health center is large compared to public health cen-ter. The standard deviation of OOPE on all three ma-ternal care in private health center was 240 in 2004 and 455 in 2014 suggesting increasing variation over time. In case of public health center the standard de-viation of all three maternal care had declined from 108 in 2004 to 86 in 2014 suggesting reduction in variability in OOPE. The standard deviation for insti-tutional delivery was similar for OOPE.
Prenatal, natal and postnatal care in pre and post NHM periods
Figure 2 presents the extent of prenatal, natal and postnatal care in the pre and post NHM periods by source of provider. The utilization of prenatal care had increased from 75% in 2004 to 90% in 2014. Postnatal care was estimated at 64% in 2004 and 79% in 2014. Among the three maternal care services, the increase in natal care was the highest while the post-natal care was the least during the post NHM period. Women who had availed all three services irrespective of the health care provider accounts 32% in 2004 and 66% in 2014. The pattern was similar for natal and
Table 1Definitions and descriptive statistics of variables on maternal care in India by source of provider, 2004–15
Variable Definition Descriptive statistics
Pre NHM (2004) Post NHM (2014)
Public Private Total Public Private Total
Ante-Natal Care (ANC) Percentage of mothers who received any of the
ante-natal check-ups during pregnancy.
43.34 32.04 75.38 55.13 35.30 90.43
Institutional Delivery Percentage of mothers who delivered at either
public or private health care facility
21.97 22.31 43.28 53.17 29.47 82.64
Post Natal Care (PNC) Percentage of mothers who availed any post natal
services following childbirth.
28.52 35.90 64.42 45.69 33.62 79.31
All three maternal care services Percentage of mothers who received all of the three maternal care services (ANC, natal care and PNC).
11.32 11.54 31.80 31.22 20.20 66.09
Out-of-Pocket Expenditure (OOPE) on Institutional Delivery in US$
Total expenditure on institutional delivery net of reimbursement (mean)
42 170 56 46 300 138
Out-of-Pocket Expenditure (OOPE) on all three maternal care services in US$
Total expenditure on ANC, natal and post-natal care net of reimbursement (mean)
post-natal care. Since 2004, all three maternal care has recorded increase in public health centres. For example, prenatal care from public health centres has increased from 43% in 2004 to 55% in 2014 while that in private health centres has increased from 32% to 35% during the same period. One inter-esting pattern that emerges is the continuity of ma-ternal care services and decline in switching of services from public health centres in the post NHM period. Among those women who had availed all three services in 2004, 11% availed these services only from public health centres, 12% availed services only from private health centres and 77% switched from public to private or vice versa (Fig. 3). In 2014, among mothers who availed maternal care services, 31% availed only from public health centres, 20%
availed only from private health centres and 49% switched services between private and public health centres.
OOPE on prenatal, natal and postnatal care in pre and post NRHM periods
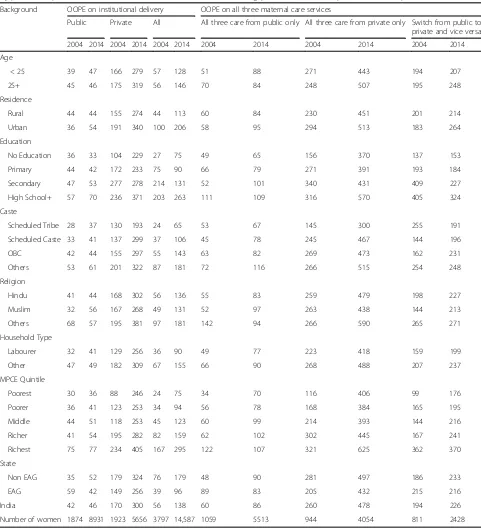
Appendix 1 presents the differentials in OOPE on in-stitutional delivery (natal care) and all three maternal care services in 2004 and 2014 by type of health care providers. The OOPE on total maternal care is pre-sented for those who availed all three services either from public or private health centres exclusively, and those who switched between public and private ser-vice providers during pregnancy and childbirth. Among women who availed all three services in pub-lic health centres, the mean OOPE had increased
Fig. 2Percent distribution of women who received pre-natal, natal and post-natal care by public and private health centres during Pre and Post NHM Periods in India
from US$60 to US $86 (by 43%) while that in private health centres has increased from US$260 to US$ 478 (by 84%). For those who switched services between private and public provider, the OOPE increased by 17%. The mean OOPE on all three services increased with the educational attainment of women and economic well-being of household, irre-spective of type of health care providers. The OOPE on institutional delivery had increased from US$ 56 to US$ 138 during the pre and post NHM periods (at 2014 prices). The differentials in OOPE on deliv-ery care in public health centres had increased mar-ginally over time - US$ 42 in the pre NHM period and US$ 46 in the post-NHM period while that from private health centres had increased from US$ 170 in 2004 to US$ 300 in 2014 (by 76%). The differentials in OOPE in natal care in public health centres among women with no education or primary educa-tion had declined in the post-NHM period compared to the pre-NHM period, while it increased among those who had secondary, high school education and above. The differentials in OOPE from private health centres by MPCE quintile in the pre and post NRHM periods suggest that the OOPE among the poorest had increased threefold and that among the richest twofold.
Table 2 present result of log-linear regression model of OOPE for institutional delivery and maternal care. Women aged 25 years and above are likely to incur 5% more OOPE on delivery care and all three mater-nal care ((exp(0.05)-1)). The OOPE on institutiomater-nal delivery and all three maternal care increases signifi-cantly with the economic well-being of the house-holds. Compared to the poorest MPCE quintile, the OOPE on institutional delivery among the richest MPCE quintile was 55% higher (exp(0.44)-1)). The OOPE was higher among women with higher educa-tional attainment and other than labourer households. The OOPE in post NHM period from public health center was 3% lower than that of pre NHM period (not statistically significant). The OOPE for institu-tional delivery from private health center in post NHM period was 5.62 times higher than that of pub-lic health center in pre NHM period. The OOPE for institutional delivery from private health center in post NHM period was even higher than that from private health center in pre NHM period. In post NHM period, the OOPE for all three maternal care from public health center had increased by 32% ((exp(0.28)-1) and statistically significant. In case of private health centers in post NHM period, the in-crease in OOPE on all three maternal care was about 5.62 times compared to that from public health cen-ter in pre NHM period. In general, the patcen-tern on
OOPE in maternal care is similar to that of institu-tional delivery.
Catastrophic health spending in pre and post NHM periods
Table 3 presents the differentials of CHS on maternal care and delivery care by public and private health centres and socio demographic characteristics in the pre and post NHM periods. Among mothers who availed all three maternal care from public health centres, the CHS has declined from 56% in the pre NHM period to 29% in the post NHM period and that from private health centres declined from 56% to 47% during the same period. The decline in CHS was quite substantial among all economic groups (ex-cept the poorest MPCE quintile) and all educational groups. The CHS on delivery care in public health centres had declined from 51% in 2004 to 20.5% in 2014 and that in private health centres has declined from 52% to 34% during the same period. Overall, the level of CHS on delivery care has declined from 52% in 2004 to 25% in 2014. The CHS on delivery care and maternal care reduced for many socio-demographic characteristics. The CHS on maternal care and delivery care is negatively associated with the economic status of the household, irrespective of the type of service and time.
period was significantly lower than public health centers in pre NHM period.
Discussion
The NHM in India was intended to increase the utilization of maternal care, reduce maternal mortal-ity, neo-natal and infant mortality and reduce the
OOPE and catastrophic spending on maternal care. Though evidence suggests an increase in the utilization of maternal care services and reduction in maternal and infant mortality in the post NHM period [50–52], there is no study that has examined the effectiveness of the program in reducing the OOPE on maternal care. Earlier studies were confined
Table 2Regression coefficient and 95% confidence interval of OOPE on institutional delivery and total maternal care during pre and post NHM periods in India
Background characteristics Institutional delivery All three maternal care
Coef. 95% CI Coef. 95% CI
Age of Mother
< 25 (R)
25+ 0.05 0.02–0.08 0.05 0.01–0.08
Place of Residence
Rural (R)
Urban −0.04 −0.08- -0.00 −0.01 −0.05-.0.03
Education Level
No Education (R)
Primary 0.07 0.02–0.12 0.14 0.08–0.21
Secondary 0.20 0.15–0.26 0.24 0.18–0.31
Higher secondary + 0.30 0.24–0.36 0.31 0.24–0.38
MPCE Quintile
Poorest (R)
Poorer 0.08 0.03–0.14 0.09 0.03–0.15
Middle 0.16 0.11–0.22 0.16 0.09–0.22
Higher 0.29 0.24–0.35 0.28 0.22–0.35
Highest 0.44 0.38–0.50 0.43 0.36–0.49
Caste
Scheduled Tribe (R)
Scheduled Caste 0.08 0.00–0.15 0.14 0.05–0.22
Other Backward Caste 0.13 0.06–0.20 0.20 0.12–0.28
Others 0.19 0.12–0.26 0.23 0.15–0.31
Religion
Hindu (R)
Muslim −0.02 −0.07-0.03 −0.07 −0.12- -0.01
Others 0.02 −0.05-0.10 0.04 −0.04-0.11
Household Type
Other (R)
Labourer 0.08 0.04–0.12 0.07 0.03–0.12
Interaction effect
Public*Time (PreNHM) (R)
Private*Time (PreNHM) 1.43 1.35–1.51 1.52 1.41–1.62
Public*Time (PostNHM) −0.03 −1.10-0.03 0.28 0.19–0.37
Private*Time (PostNHM) 1.89 1.82–1.96 2.02 1.92–2.11
Constant 7.60 7.43–7.76 8.08 7.91–8.25
to a point of time or addressed particular services and none of these provided comparable estimates of OOPE in pre and post NHM by public and private health providers [7, 35, 38]. This study provides com-prehensive estimates of OOPE and CHS in pre and
post NHM periods in public and private health cen-tres. The data set we have used is publicly available and the time period is best suited for analyses.
The salient findings are as follows. First, the OOPE on delivery care in public health centres (unadjusted
Table 3Percentage of households incurring catastrophic health spending on institutional delivery and all three maternal care by source of provider and selected characteristics during pre NHM (2004) and post NHM (2014) periods in India
Background characteristics
CHS on institutional delivery CHS on all three maternal care
Public Private All All three care from public health
centers only
All three care from private health centers only
2004 2014 2004 2014 2004 2014 2004 2014 2004 2014
Age
< 30 54.5 20.1 55.2 41.7 54.8 25.7 52.9 30.6 54.7 59.2
30–59 51.5 21.1 53.7 32.3 52.5 25.1 57.6 29.1 61.4 45.3
60+ 45.4 19 45 33.6 45.3 25.1 56.8 28.3 45.4 43.2
Residence
Rural 55.3 21.1 61.8 37.2 58.5 25.7 58.9 30.4 68.9 51.5
Urban 43.1 18 38.3 29.6 40.2 23.9 50.3 24.8 40.6 41.8
Education Level
No Education 65.1 23.9 68.1 42.6 66.4 28.8 69 33.8 73.6 56.1
Primary 49.7 21.6 58.9 38.5 53.9 26.9 55.9 31.7 67.6 48.7
Secondary 31.8 18.1 36 33.2 34.4 23.8 48 24.7 32.6 48.8
High School+ 25.5 8.9 32.8 20.6 30.6 15.5 15.8 16.4 38.8 34.6
Caste
Scheduled Tribe 59.7 29.7 65.4 23.7 61.4 28.6 51.8 37.5 65.3 28.9
Scheduled Caste 59.4 22.2 63.8 48.4 61.1 28.3 59.1 33.3 68.4 56.8
Other Backward Caste 50.9 19.5 59.8 34.5 55.8 25.2 56.8 27.2 67.6 49.4
Others 42.5 15 38 29.5 39.9 21.6 51.8 24.1 38.9 43.2
Religion
Hindu 52.1 20.5 51.7 34.8 51.9 25.4 55 29.8 55.6 48.3
Muslim 53.4 20.6 66.8 34.1 60.5 25.2 66.8 27.8 66.8 44.6
Others 37.4 20.4 28.8 26.3 32.6 23.1 52.7 26.8 33.3 39.1
Household Type
Labourer 48.4 26 54.3 48.8 51.7 30.7 56.4 38.7 69.6 57.9
Others 51.9 18.4 51.5 32 51.7 20.6 55.2 25.7 52.4 46
MPCE Quintile
Poorest 79.8 62.8 99 90.4 87.6 67.9 76.8 74.6 100 95.8
Poorer 79.3 7.4 95 57.3 87.3 22.3 80.4 23.5 99.4 68.4
Middle 68.3 2.3 87 29.4 75.8 11.2 69.5 6.3 95.5 51.8
Richer 31.6 0.9 48.2 19.2 40.1 8.6 40.7 3.2 61.2 37.8
Richest 8 0.9 19 8 15.6 5.1 17.8 0.4 25.3 20.7
State
Non EAG 47.9 16.6 48.5 31.7 48.3 23.3 52.3 24.9 53.9 45.1
EAG 60.9 23.5 60.1 39 60.4 27.3 68.9 32.7 60.1 51.9
Total/India 51.4 20.5 52.1 34.2 51.7 25.2 56.2 29.4 55.6 47.2
Number of households 1835 8792 1866 5559 3701 14,351 1038 5263 910 4179
mean at constant prices) has remained similar during the pre and post NHM periods and increased by 77% during post NHM period in private health centres. The OOPE on institutional delivery in private health centres was nearly four times higher than that in public health center in the pre-NHM period and
increased by 6.5 times in the post NHM period. On controlling for socio-economic and demographic con-founders and time, the OOPE on institutional delivery from public health center had not shown any signifi-cant increase in post NHM period. In case of private health centers, the increase in OOPE for institutional
Table 4Odds Ratio and 95% Confidence Interval (CI) of catastrophic spending on institutional delivery and total maternal care expenditure associated with socio-economic and demographic correlates during pre and post NHM periods in India
Background characteristics Institutional delivery All three maternal care
Odd ratio 95% CI Odd ratio 95% CI
Age
< 30 (R)
30–59 0.86 0.77–0.97 0.78 0.68–0.89
60+ 0.75 0.64–0.86 0.65 0.56–0.77
Place of Residence
Rural (R)
Urban 0.29 0.26–0.32 0.27 0.24–.0.31
Education Level
No Education (R)
Primary 0.98 0.87–1.10 1.02 0.89–1.18
Secondary 1.03 0.91–1.18 1.11 0.96–1.28
Higher secondary + 1.08 0.92–1.27 1.17 0.98–1.40
MPCE Quintile
Poorest (R)
Poorer 0.06 0.05–0.07 0.08 0.07–0.10
Middle 0.02 0.02–0.03 0.03 0.02–0.04
Higher 0.01 0.01–0.01 0.01 0.01–0.02
Highest 0.00 0.00–0.00 0.00 0.00–0.00
Caste
Scheduled Tribe (R)
Scheduled Caste 1.00 0.82–1.21 1.14 0.90–1.43
Other Backward Caste 1.18 0.99–1.42 1.44 1.16–1.78
Others 1.19 0.99–1.44 1.30 1.04–1.63
Religion
Hindu (R)
Muslim 0.88 0.77–1.01 0.77 0.65–0.91
Others 1.00 0.81–1.23 1.00 0.79–1.26
Household Type
Other (R)
Labourer 1.10 0.97–1.15 1.14 0.98–1.33
Interaction effect
Public*Time (PreNHM) (R)
Private*Time (PreNHM) 3.48 2.92–4.16 4.97 3.88–6.36
Public*Time (PostNHM) 0.03 0.02–0.03 0.06 0.04–0.07
Private*Time (PostNHM) 0.54 0.46–0.63 1.34 1.08–1.67
Constant 306.61 193.33–486.26 327.92 195.11–551.15
delivery was large and significant. This confirms that the overall increase in OOPE on institutional delivery was largely driven by increase in OOPE in private health centers. The OOPE on institutional delivery in-creased with educational attainment and MPCE quin-tile linking high OOPE to ability to pay and quality of care. Second, though, the OOPE on delivery care in public health centres has remained similar in pre and post NHM periods, it has increased significantly for all three maternal care services. The OOPE on all three maternal care in public health centers during post NHM period had increased by 32% (statistically significant) and that in private health centers had in-creased many fold. -Third, the CHS on delivery care and all maternal care services from public health cen-tres in the post NHM period has declined by almost half. In the case of institutional deliveries, reduction of CHS in public health centres was experienced across all educational and economic classes. The de-cline in CHS was also noticeable in private health centres. With regard to all three maternal care ser-vices, the reduction of CHS was lower compared to that in delivery care but the level remained high. Fourth, the multivariate analyses confirmed decline in CHS in the post NHM period and a larger decline in the share of CHS in public health centres. House-holds residing in rural areas and with lower economic status are more likely to incur CHS and these find-ings are consistent with other studies [5, 6, 35, 38]. The interaction of time and NHM suggests that com-pared to those who delivered in public health centres during pre NHM period, those delivered or availed all there maternal care services in the post NHM period from public health centers were less likely to incur CHS in India. However, in case women availed all three maternal services from private health center in post NHM period, they are more likely to incur CHS.
These findings suggest that the NHM has been suc-cessful in increasing deliveries in public health centres and reduced the CHS in India. Increase in continu-ation of services in public health centres and reduc-tion in switching from public to private healthcare providers is indicative of improvement in public health services on maternal care in India. The decline in OOPE from public health centres for the less edu-cated and poor mothers may be attributed to the JSY under NHM. However, the use of pre-natal and post-natal has not recorded similar increase as that of in-stitutional delivery in the post NHM period. This is possibly because the program priority under JSY was on increasing institutional delivery. The reduction of CHS is a reflection of the success of the program. Decline in CHS may be attributed both to the NHM and improvement in the economic well-being of the
households. On the other hand, the differentials in OOPE among public and private health centres are large and there has been overall increase in OOPE on delivery care. This is possible because of increas-ing incidence of caesarian deliveries across the states of India.
We acknowledge some limitations of the study. First, a time series analyses could not be feasible due to data constraint. The NSS health survey was con-ducted in interval of 10 years; 2004 and 2014. No health survey of NSS was conducted in intervening period and so the time series analysis is ruled out. Similarly, the difference in difference analyses is not feasible as NHM was implemented in 18 poor per-forming states for initial few years and then expanded to advanced states. Getting control group may not feasible, as there were large differentials between poor performing and advanced states of India. Second, the analyses could not be performed separately for caesar-ian deliveries and normal delivery as the type of de-livery (normal/caesarian) was not recorded in the survey. Third, the quality of maternal care that is often linked to cost were not collected in the survey and could not be analyzed. The indirect cost on hospitalization has not been estimated. Besides, im-provement in health infrastructure in the post NHM period is beyond the scope of the study.
Conclusion
Based on these findings, we conclude that the NHM is effective in increasing in utilization, continuation of services in public health centres and reducing OOPE and CHS in public health centres on maternal care. We suggest that the cash incentive under NHM should continue and private health care providers should be regulated with respect to pricing and qual-ity of care. The program should focus on improving the quality of services in public health centres. Be-sides, we recommended that the forthcoming health survey (NSS) should integrate an abridged version of the consumption schedule, question on expenditure on home delivery and a separate code for caesarian and normal delivery is recommended.
Endnote
1
Appendix
Table 5Out-of-pocket expenditure (in US$ at 2014 prices) on institutional delivery and maternal care (pre-natal, natal and postnatal) by public and private health centres and selected characteristics during pre NHM (2004) and post NHM (2014) periods in India Background OOPE on institutional delivery OOPE on all three maternal care services
Public Private All All three care from public only All three care from private only Switch from public to private and vice versa
2004 2014 2004 2014 2004 2014 2004 2014 2004 2014 2004 2014
Age
< 25 39 47 166 279 57 128 51 88 271 443 194 207
25+ 45 46 175 319 56 146 70 84 248 507 195 248
Residence
Rural 44 44 155 274 44 113 60 84 230 451 201 214
Urban 36 54 191 340 100 206 58 95 294 513 183 264
Education
No Education 36 33 104 229 27 75 49 65 156 370 137 153
Primary 44 42 172 233 75 90 66 79 271 391 193 184
Secondary 47 53 277 278 214 131 52 101 340 431 409 227
High School+ 57 70 236 371 203 263 111 109 316 570 405 324
Caste
Scheduled Tribe 28 37 130 193 24 65 53 67 145 300 255 191
Scheduled Caste 33 41 137 299 37 106 45 78 245 467 144 196
OBC 42 44 155 297 55 143 63 82 269 473 162 231
Others 53 61 201 322 87 181 72 116 266 515 254 248
Religion
Hindu 41 44 168 302 56 136 55 83 259 479 198 227
Muslim 32 56 167 268 49 131 52 97 263 438 144 213
Others 68 57 195 381 97 181 142 94 266 590 265 271
Household Type
Labourer 32 41 129 256 36 90 49 77 223 418 159 199
Other 47 49 182 309 67 155 66 90 268 488 207 237
MPCE Quintile
Poorest 30 36 88 246 24 75 34 70 116 406 99 176
Poorer 36 41 123 253 34 94 56 78 168 384 165 195
Middle 44 51 118 253 45 123 60 99 214 393 144 216
Richer 41 54 195 282 82 159 62 102 302 445 167 241
Richest 75 77 234 405 167 295 122 107 321 625 362 370
State
Non EAG 35 52 179 324 76 179 48 90 281 497 186 233
EAG 59 42 149 256 39 96 89 83 205 432 215 216
India 42 46 170 300 56 138 60 86 260 478 194 226
Abbreviations
ASHA:Accredited social health activist; CHS: Catastrophic health spending; CTP: Capacity to pay; EAG: Empowered action group; JSSK:Janani Shishu Suraksha Karyakram; JSY:Janani Suraksha Yojana; MPCE: Monthly per-capita consumption expenditure; NHM: National health mission; NRHM: National rural health mission; NSS: National sample survey; OOPE: Out-of pocket expenditure; Pl: Poverty line; SDG: Sustainable development goals
Acknowledgments
Authors would like to thank editor and two anonymous reviewers for their valuable suggestions and comments on earlier version of the paper. Authors thank Dr. Laxmi Kant Dwivedi for his useful suggestion on statistical analyses of the paper.
Funding Not Applicable.
Availability of data and materials Data used in this paper is publicly available.
Authors’contributions
Both authors conceptualised, analysed data, wrote and approved the draft.
Authors’information
Sanjay K Mohanty is Professor at International Institute for Population Sciences, Mumbai. He has 17 years of teaching and research experience at post-graduate level. He teaches health economics and fertility at IIPS, Mum-bai. His research interest includes health financing, multidimensional poverty and economics of ageing.
Anshul Kastor is doctoral student at International Institute for Population Sciences, Mumbai. He is pursuing his doctoral work on“Health financing transition and its linkages with health outcomes in India”.
Ethics approval and consent to participate Not applicable.
Consent for publication Not applicable.
Competing interests
All authors declare that they have no competing interest.
Publisher’s Note
Springer Nature remains neutral with regard to jurisdictional claims in published maps and institutional affiliations.
Author details
1
Department of Fertility Studies, International Institute for Population Sciences (IIPS), Govandi Station Road, Deonar, Mumbai 400088, India.
2
Research Scholar, International Institute for Population Sciences, Mumbai, India.
Received: 11 May 2017 Accepted: 7 September 2017
References
1. United Nations. UN sustainable goals summit 2015. New York City: United Nations; 2015.
2. Whitehead M, Dahlgren G, Evans T. Equity and health sector reforms: can low-income countries escape the medical poverty trap? Lancet. 2001;358:833–6.
3. Xu K, Evans DB, Kawabata K, Zeramdini R, Klavus J, Murray CJ. Household catastrophic health expenditure: a multicounty analysis. Lancet. 2003;362:111–7.
4. Knaul FM, Arreola-Ornelas H, Méndez-Carniado O, Bryson-Cahn C, Barofsky J, Maguire R, Miranda M, Sesma S. Evidence is good for your health system: policy reform to remedy catastrophic and impoverishing health spending in Mexico. Lancet. 2006;368:1828–41.
5. Li Y, Wu Q, Xu L, Legge D, Hao Y, Gao L, Ning N, Wan G. Factors affecting catastrophic health expenditure and impoverishment from medical
expenses in China: policy implications of universal health insurance. Bull World Health Organ. 2012;90:664–71.
6. Arsenijevic J, Pavlova M, Groot W. Measuring the catastrophic and impoverishing effect of household health care spending in Serbia. Soc Sci Med. 2013;78:17–25.
7. Bonu S, Bhushan I, Rani M, Anderson I. Incidence and correlates of “catastrophic”maternal health care expenditure in India. Health Policy Plan. 2009;24:445–56.
8. Chandrasiri J, Anurango C, Wickramasinghe R. The impact of out-of-pocket expenditures on poverty and inequalities in use of maternal and child health services in Bangladesh: evidence from the household income and expenditure surveys 2000–2010. Manila: Asian Development Bank; 2012. 9. Van Doorslaer E, O'Donnell O, Rannan-Eliya RP, Somanathan A, Adhikari SR,
Garg CC, et al. Effect of payments for health care on poverty estimates in 11 countries in Asia: an analysis of household survey data. Lancet. 2006;368(9544):1357–64.
10. Garg CC, Karan AK. Reducing out-of-pocket expenditures to reduce poverty: a disaggregated analysis at rural-urban and state level in India. Health Policy Plan. 2009;24:116–28.
11. Elgazzar H, Raad F, Arfa C, Mataria A, Salti N, Chaaban J, Majbouri M. Who pays. Out-of-pocket health spending and equity implications in the Middle East and North Africa. Washington DC: World Bank; 2010.
12. Afsana K, Rashid SF. The challenges of meeting rural Bangladeshi women’s needs in delivery care. Reprod Health Matters. 2001;9:79–89.
13. Levin A, Dmytraczenko T, McEuen M, Ssengooba F, Mangani R, Van Dyck G. Costs of maternal health care services in three anglophone African countries. Int J Health Plann Manag. 2003;18:3–22.
14. Borghi J, Ensor T, Somanathan A, Lissner C, Mills A. Mobilising financial resources for maternal health. Lancet. 2006;368:1457–65.
15. Perkins M, Brazier E, Themmen E, Bassane B, Diallo D, Mutunga A, et al. Out-of-pocket costs for facility-based maternity care in three African countries. Health Policy Plan. 2009;24:289–300.
16. Honda A, Randaoharison PG, Matsui M. Affordability of emergency obstetric and neonatal care at public hospitals in Madagascar. Reprod Health Matters. 2011;19:10–20.
17. Wennerholm P, Scheutz AM, Zaveri-Roy Y. India's Healthcare system-overview and quality improvements. Stockholm: Swedish Agency for Growth Policy Analysis; 2013.
18. MoHFW. National Rural Health Mission (2005–12), mission document. New Delhi: MoHFW; 2005.
19. MoHFW. Framework for implementation of National Health Mission, 2012–17. New Delhi: MoHFW; 2012.
20. Kapur A, Srinivas V. Budget brief 2015–16: National Health Mission Accountability Initiative [internet]. New Delhi; 2016. Available from: http:// www.cprindia.org/research/reports/budget-brief-2017-18-national-health-mission-nhm.
21. MoHFW. National Health Policy 2017. New Delhi: Government of India; 2017. 22. ORGI. Sample registration system, Vol. 41 (1). SRS Bulletin New Delhi; 2006. 23. ORGI. Sample registration system. SRS Bulletin: New Delhi, Vol. 49 (1); 2014. 24. ORGI. Special bulletin on maternal mortality in India 2004–06. New Delhi:
ORGI; 2009.
25. [Internet] Available from: http://www.censusindia.gov.in/vital_statistics/ mmr_bulletin_2011-13.pdf. [cited 2016 Jul 9].
26. IIPS. National Family and health survey. 2015–16. State fact sheet [internet]. Mumbai: IIPS; 2016. Available from: http://rchiips.org/NFHS/factsheet_NFHS-4.shtml.
27. Lim SS, Dandona L, Hoisington JA, James SL, Hogan MC, Gakidou E. India’s Janani Suraksha Yojana, a conditional cash transfer programme to increase births in health facilities: an impact evaluation. Lancet. 2010;375:2009–23. 28. Khan ME, Hazra A, Bhatnagar I. Impact of Janani Suraksha Yojana on
selected family health behaviors in rural Uttar Pradesh. J Fam Welf. 2010;56:9–22.
29. Gupta SK, Pal DK, Tiwari R, Garg R, Shrivastava AK, Sarawagi R, et al. Impact of Janani Suraksha Yojana on institutional delivery rate and maternal morbidity and mortality: an observational study in India. J Health Popul Nutr. 2012;30:464–71.
31. Govil D, Purohit N, Gupta SD, Mohanty SK, Xu L, Liu X, et al. Out-of-pocket expenditure on prenatal and natal care post Janani Suraksha Yojana: a case from Rajasthan, India. J Health Popul Nutr. 2016;35:15.
32. Mohanty SK, Pathak PK. Rich-poor gap in utilization of reproductive and child health services in India, 1992-2005. J Biosoc Sci. 2009;41:381–98. 33. Paul VK, Sachdev HS, Mavalankar D, Ramachandran P, Sankar MJ, Bhandari
N, et al. Reproductive health, and child health and nutrition in India: meeting the challenge. Lancet. 2011;377:332–49.
34. Saradiya M, Aditya S, Rakesh C. Maternity or catastrophe: a study of household expenditure on maternal health care in India. Health (Irvine Calif). 2013;5:109–18.
35. Mohanty SK, Srivastava A. Out-of-pocket expenditure on institutional delivery in India. Health Policy Plan. 2013;28:247–62.
36. Leone T, James K, Padmadas S. The burden of maternal health care expenditure in India: multilevel analysis of National Data. Matern Child Health J. 2013;17:1622–30.
37. Modugu HR, Kumar M, Kumar A, Millett C. State and socio-demographic group variation in out-of-pocket expenditure, borrowings and Janani Suraksha Yojana (JSY) programme use for birth deliveries in India. BMC Public Health. 2012;12:1. BioMed Central
38. Goli S, Moradhvai, Rammohan A, Shruti, Pradhan J. High spending on maternity care in India: what are the factors explaining it? PLoS One. 2016;11:e0156437.
39. Selvaraj S, Karan AK. Deepening health insecurity in India: Evidence from National Sample Surveys since 1980s. Econ Polit Wkly. 2009;44:55–60. 40. Balarajan Y, Selvaraj S, Subramanian SV. Health care and equity in India.
Lancet. 2011;377:505–15.
41. Mohanty SK, Ladusingh L, Kastor A, Chauhan RK, Bloom DE. Pattern, growth and determinant of household health spending in India, 1993–2012. Aust J Public Health. 2016;2016:1–15.
42. NSSO. Morbidity, health care and the condition of the aged, Report no. 507 (60/25.0/1). New Delhi: NSSO; 2006.
43. NSSO. Key indicators of social consumption in India: health 2014, Report no. (71/25.0). New Delhi: NSSO; 2015.
44. Central Statistical Office (CSO). Ministry of Statistics and Program Implementation. New Delhi: Government of India; 2015. 45. Planning Commission. Report of the expert group to review the
methodology for measurement of poverty. New Delhi: Planning Commission; 2014.
46. Berki SE. A look at catastrophic medical expenses and the poor. Health Aff. 1986;5:138–45.
47. Van Doorslaer E, O’Donnell O, Rannan-Eliya RP, Somanathan A, Adhikari SR, Garg CC, et al. Catastrophic payments for health care in Asia. Health Econ. 2007;16:1159–84.
48. Rashad AS, Sharaf MF. Catastrophic and impoverishing effects of out-of-pocket health expenditure: new evidence from Egypt. Am J Econ. 2015;5:526–33.
49. Su TT, Kouyaté B, Flessa S. Catastrophic household expenditure for health care in a low-income society: a study from Nouna District. Burkina Faso Bull World Health Organ. 2006;84:21–7.
50. Nair H, Panda R. Quality of maternal healthcare in India: has the National Rural Health Mission made a difference. J Glob Health. 2011;1:79–86. 51. Planning Commission. Evaluation study of National Rural Health Mission
(NRHM) in 7 states. New Delhi: Government of India; 2011.