2
This reference document contains supporting data to accompany the State of the Industry 2016 and a copy of the SOI online survey.
Table of Contents
TABLE OF CONTENTS ... 2
LIST OF FIGURES ... 3
LIST OF TABLES ... 3
SUPPLEMENTARY SOI DATA ... 4
INTERNATIONAL ARRIVALS ... 4
Growth of other markets ... 5
AIR CONNECTIVITY ... 6
VISITOR EXPERIENCE ... 7
LENGTH OF STAY ... 8
CONVENTION/CONFERENCE DATA ... 10
SEASONALITY ... 11
EXPENDITURE ... 16
ACCOMMODATION ... 16
SOI SURVEY RESULTS ... 18
SAMPLE DESCRIPTION ... 18
CHALLENGES ... 20
Visitor challenges ... 20
Business challenges ... 21
Operating environment challenges ... 22
CHANGING VISITOR MARKETS ... 24
DOMESTIC TOURISM ... 24
STAFF AND SKILL ISSUES ... 25
SUSTAINABILITY ... 26
3 List of Figures
FIGURE 1VISITOR ARRIVALS BY TOP 7 MARKETS (YEAR ENDED MARCH 2007&2016) ... 4
FIGURE 2CHANGE IN INTERNATIONAL ARRIVALS (YEAR ENDED MARCH 2015-2016) ... 5
FIGURE 3ARRIVAL DATA – OTHER MARKETS (YEAR ENDED MARCH 2014-2016) ... 5
FIGURE 4TOTAL INBOUND AIR CAPACITY (YEAR ENDED MARCH 2012-2016)... 6
FIGURE 5DIRECT INBOUND AIR CAPACITY BY SOURCE REGION (YEAR ENDED MARCH 2012-2016) ... 6
FIGURE 6DIRECT INBOUND AIR CAPACITY BY SOURCE REGION (%)(YEAR ENDED MARCH 2016) ... 7
FIGURE 7OVERALL SATISFACTION WITH NEW ZEALAND EXPERIENCE (YEAR ENDED JUNE 2016) ... 7
FIGURE 8LENGTH OF STAY –AUSTRALIA ... 8
FIGURE 9LENGTH OF STAY –CHINA ... 8
FIGURE 10LENGTH OF STAY –USA ... 9
FIGURE 11LENGTH OF STAY –UK ... 9
FIGURE 12LENGTH OF STAY –JAPAN ... 9
FIGURE 13LENGTH OF STAY –GERMANY ... 10
FIGURE 14CONVENTION/CONFERENCE ARRIVALS (YEAR ENDED MARCH 2007-2016) ... 10
FIGURE 15VISITOR ARRIVALS BY PURPOSE AND MONTH OF VISIT (YEAR ENDED MARCH 2016) ... 11
FIGURE 16SEASONALITY –AUSTRALIA,CHINA AND USA(YEAR ENDED MARCH 2006,2011&2016) ... 12
FIGURE 17SEASONALITY –UK,JAPAN AND GERMANY (YEAR ENDED MARCH 2006,2011&2016) ... 13
FIGURE 18SEASONALITY –SINGAPORE,INDIA AND MALAYSIA (YEAR ENDED MARCH 2006,2011&2016) ... 14
FIGURE 19SEASONALITY –INDONESIA,PHILIPPINES AND BRAZIL (YEAR ENDED MARCH 2006,2011&2016) ... 15
FIGURE 20GUEST NIGHTS – DOMESTIC AND INTERNATIONAL (%)(YEAR ENDED MARCH 2016) ... 16
FIGURE 21DOMESTIC ACCOMMODATION PERCENTAGES BY RTO(YEAR ENDED MARCH 2016) ... 17
FIGURE 22PRIMARY BUSINESS FOCUS ... 18
FIGURE 23LOCATION OF SAMPLE –NORTH ISLAND REGIONS ... 19
FIGURE 24LOCATION OF SAMPLE –SOUTH ISLAND REGIONS ... 20
FIGURE 25VISITOR CHALLENGES ... 21
FIGURE 26BUSINESS CHALLENGES ... 21
FIGURE 27OPERATING ENVIRONMENT CHALLENGES ... 22
FIGURE 28PERCENTAGE CHANGE IN AGREEMENT WITH CHALLENGES (2015&2016) ... 24
FIGURE 29PERCENTAGE CHANGE IN AGREEMENT WITH DOMESTIC TOURISM STATEMENTS (2015&2016) ... 25
FIGURE 30PERCENTAGE CHANGE IN AGREEMENT WITH STAFF AND SKILL ISSUES (2015&2016) ... 26
List of Tables TABLE 1CHANGE IN AVERAGE EXPENDITURE FOR KEY MARKETS (YEAR ENDED MARCH 2015 AND 2016) ... 16
TABLE 2OTHER TOURISM BUSINESS FOCUS/ROLES ... 19
TABLE 3SUMMARY OF KEY CHALLENGE AGREEMENT/DISAGREEMENT RESULTS ... 23
4
Supplementary SOI data
This section contains graphs and supporting material for the data presented in the State of the Industry 2016 report. This material relates to international arrivals, air connectivity, visitor experience, length of stay, convention/conference arrivals, seasonality data for selected markets and accommodation data.
International arrivals
Figure 1 shows the percentage change in arrivals by key markets between 2007 and 2016. The graph also includes Korea as it was the sixth largest market in 2007 (Germany was seventh) – in 2016 these positions were reversed.
Figure 1 Visitor arrivals by top 7 markets (Year ended March 2007 & 2016)
Source: Statistics New Zealand
Figure 2 shows the change in the number of arrivals in the 12 months to March 2016. Figure 7 in the SOI presents these data as percentages (growth).
37.5 4.7
9.1 12.4 5.3
2.4 4.6
23.9
41.9 11.6
7.8 6.6 2.8 2.8 2.2
24.3
0 5 10 15 20 25 30 35 40 45
Australia China USA UK Japan Germany Korea Other
Percent
Visitor arrivals by key market
(Year ended March 2007 and 2016)
2016
5
Figure 2 Change in international arrivals (Year ended March 2015-2016)
Growth of other markets
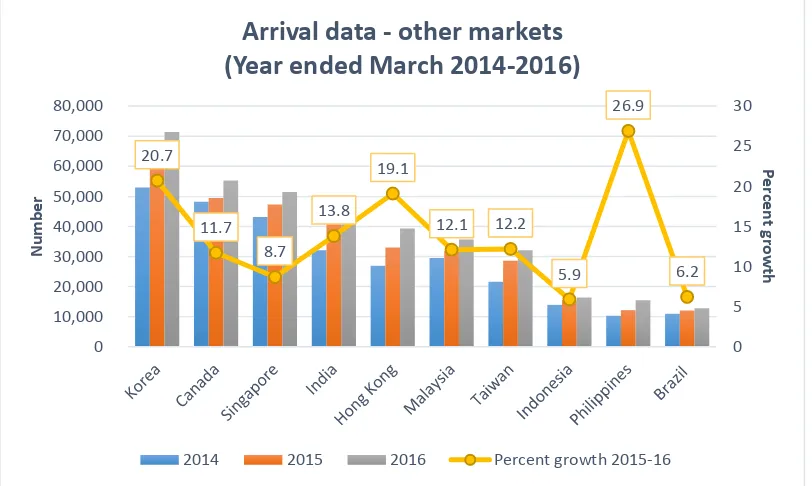
Figure 3 shows the arrival data for selected markets over the last three years (Year ended March 2014-2016) and the percentage growth of each market for the year ended March 2016. These data show strong growth from the Korean (20.7%), Hong Kong (19.1%) and Philippine (26.9%) markets, although arrivals from the Philippines are still relatively small (15,456 in 2016).
Figure 3 Arrival data – other markets (Year ended March 2014-2016)
Source: Statistics New Zealand 91,584
82,288
26,832
14,032
7,952 9,344
77,168
0 10,000 20,000 30,000 40,000 50,000 60,000 70,000 80,000 90,000 100,000
Australia China USA UK Japan Germany Other
A
rr
iv
al
s
Change in international arrivals
(Year ended March 2015-2016)
20.7
11.7 8.7
13.8 19.1
12.1 12.2
5.9 26.9
6.2
0 5 10 15 20 25 30
0 10,000 20,000 30,000 40,000 50,000 60,000 70,000 80,000
Pe
rc
e
n
t g
ro
wth
N
u
mb
e
r
Arrival data - other markets
(Year ended March 2014-2016)
6 Air connectivity
Total inbound air capacity includes those arriving in NZ on through flights (Figure 4) while direct inbound refers only to those disembarking flights in NZ (Figures 5 and 6).
Figure 4 Total inbound air capacity (Year ended March 2012-2016)
Source: Sabre Market Intelligence
Figure 5 Direct inbound air capacity by source region (Year ended March 2012-2016)
Source: Sabre Market Intelligence 7.78
7.37 7.79
8.15
8.76
0.00 1.00 2.00 3.00 4.00 5.00 6.00 7.00 8.00 9.00
2012 2013 2014 2015 2016
M
ill
io
n
s
(se
ats)
Total inbound air capacity
(Year ended March 2012-2016)
0.0 1.0 2.0 3.0 4.0 5.0 6.0 7.0 8.0
2012 2013 2014 2015 2016
M
ill
io
n
s
(se
ats)
Direct inbound air capacity by source region
(Year ended March 2012-2016)
7
Figure 6 Direct inbound air capacity by source region (%) (Year ended March 2016)
Source: Sabre Market Intelligence
Visitor experience
As reported in the SOI, visitor satisfaction is high with 91% scoring 8 or higher (out of 10) (Figure 7).
Figure 7 Overall satisfaction with New Zealand experience (Year ended June 2016)
Source: Experience Monitor 2016, Tourism New Zealand
Asia, 1,292,350, 17%
Australia, 4,706,785, 62%
Gulf, 8,482, 0%
North America, 583,083, 8%
Pacific, 792,465,
10% South America,
188,765, 3%
Direct inbound air capacity by source region (%)
(Year ended March 2016)
0 0.1
0.3 0.2 0.5 1.2
6.1
20
31.2
39.8
0 5 10 15 20 25 30 35 40 45
Not at all satisfied 1 2 3 4 5 6 7 8 9 Extremely satisfied 10
Percent
Sati
sf
ac
ti
o
n
sc
o
re
8 Length of stay
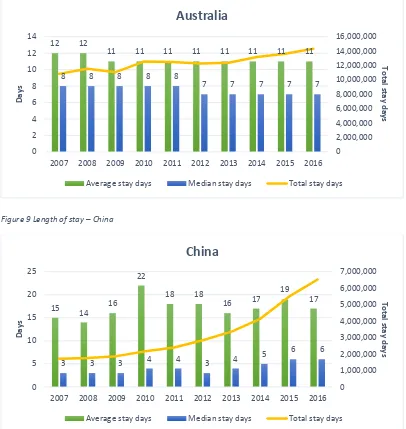
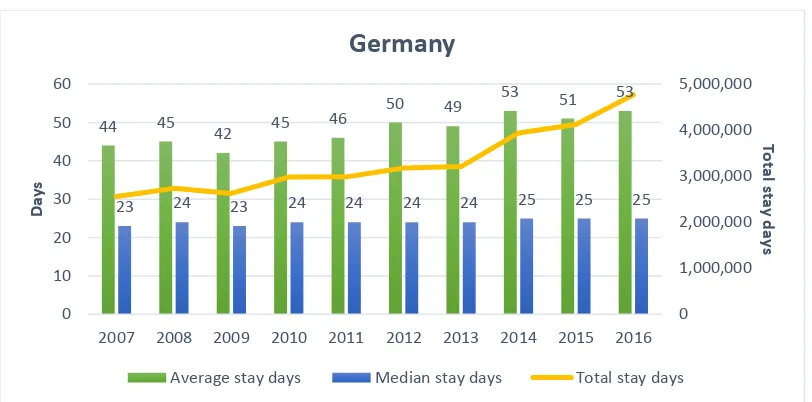
The SOI 2016 only showed median stay days (Figure 11) and total stay days (Figure 12) for the six key markets in 2016. The graphs presented in Figures 8 – 13 show average, median and total stay days for each of the six key markets. Source for all graphs: Statistics New Zealand.
Figure 8 Length of stay – Australia
Figure 9 Length of stay – China
12 12
11 11 11 11 11 11 11 11
8 8 8 8 8
7 7 7 7 7
0 2,000,000 4,000,000 6,000,000 8,000,000 10,000,000 12,000,000 14,000,000 16,000,000
0 2 4 6 8 10 12 14
2007 2008 2009 2010 2011 2012 2013 2014 2015 2016
To
tal
stay
d
ay
s
D
ay
s
Australia
Average stay days Median stay days Total stay days
15 14 16
22
18 18
16 17
19 17
3 3 3 4 4 3 4 5
6 6
0 1,000,000 2,000,000 3,000,000 4,000,000 5,000,000 6,000,000 7,000,000
0 5 10 15 20 25
2007 2008 2009 2010 2011 2012 2013 2014 2015 2016
To
tal
stay
d
ay
s
D
ay
s
China
9
Figure 10 Length of stay – USA
Figure 11 Length of stay – UK
Figure 12 Length of stay – Japan
18 18 18 19 18 19 18 18
17 17
10
9 9 10 10 10 9 9 10 10
0 1,000,000 2,000,000 3,000,000 4,000,000 5,000,000 0 5 10 15 20
2007 2008 2009 2010 2011 2012 2013 2014 2015 2016
To tal stay d ay s D ay s
USA
Average stay days Median stay days Total stay days
29 30 30 29 29 29 30 30 29 28
20 20 20 20 20 20 20 20 20 19
0 2,000,000 4,000,000 6,000,000 8,000,000 10,000,000 0 5 10 15 20 25 30 35
2007 2008 2009 2010 2011 2012 2013 2014 2015 2016
To tal stay d ay s D ay s
UK
Average stay days Median stay days Total stay days
15 16 16
18 17
19 19
18
17 17
6 6 6 6 6 7 7 7 6 6
0 500,000 1,000,000 1,500,000 2,000,000 0 5 10 15 20
2007 2008 2009 2010 2011 2012 2013 2014 2015 2016
To tal stay d ay s D ay s
Japan
10
Figure 13 Length of stay – Germany
Convention/Conference data
Figure 14 shows that although the number of Convention/Conference visitors have increased they have fallen as a percentage of all arrivals. The peak month for Convention/Conference arrivals in 2016 was November (see Figure 15).
Figure 14 Convention/Conference arrivals (Year ended March 2007-2016)
Source: Statistics New Zealand
44 45 42 45 46
50 49 53 51 53
23 24 23 24 24 24 24 25 25 25
0 1,000,000 2,000,000 3,000,000 4,000,000 5,000,000
0 10 20 30 40 50 60
2007 2008 2009 2010 2011 2012 2013 2014 2015 2016
To
tal
stay
d
ay
s
D
ay
s
Germany
Average stay days Median stay days Total stay days
0.0% 0.5% 1.0% 1.5% 2.0% 2.5% 3.0%
0 10,000 20,000 30,000 40,000 50,000 60,000 70,000
2007 2008 2009 2010 2011 2012 2013 2014 2015 2016
Pe
rc
e
n
t
N
u
mb
e
r
Convention/Conference arrivals
(Year ended March 2007-2016)
11 Seasonality
To allow easy comparison of arrivals from different markets, the seasonality graph in the SOI 2016 report (Figure 16) showed the percentage of arrivals by month for only the top four markets and for total arrivals. Figure 15 shows seasonality by purpose of visit for the year ended March 2016 for all international arrivals.
Figure 15 Visitor arrivals by purpose and month of visit (Year ended March 2016)
Source: Statistics New Zealand
The graphs presented in Figures 16 – 19 show the number of arrivals from 12 markets (the top six and six selected) by month, for the 2006, 2011 and 2016 March end years. These graphs clearly illustrate the changes in arrivals from each market, as well as seasonal distribution for these arrivals. Over the last decade, seasonality has become more pronounced for the majority of these markets with most having a pronounced peak in December. Other arrival peaks of note include:
a January peak in arrivals from Brazil (related to new air services)
May peak in arrivals from Philippines (possibly related to new air services)
July peak from Indonesia (related to Ramadan)
May peak from India (monsoon-related)
August peak from Japan (skiing)
June 2006 peak from the UK (related to the Lions rugby tour)
10.9% 14.4%
15.2% 13.3%
18.3%
0.0% 2.0% 4.0% 6.0% 8.0% 10.0% 12.0% 14.0% 16.0% 18.0% 20.0%
Apr May Jun Jul Aug Sep Oct Nov Dec Jan Feb Mar
Pe
rc
e
n
t
Visitor arrivals by purpose of visit and month
(Year ended March 2016)
Business Conventions/Conferences
Education Holiday/Vacation
12
Figure 16 Seasonality – Australia, China and USA (Year ended March 2006, 2011 & 2016)
1,364,736 arrivals in 2016
↑57% since 2006
Arrival peak
13% December
41% Dec-Mar
377,840 arrivals in 2016
↑316% since 2006
Arrival peak
14% February
36% Jan-Mar
253,792 arrivals in 2016
↑15% since 2006
Arrival peaks
15% February
13% December
Source: Statistics New Zealand 50,000 100,000 150,000 200,000
Apr May Jun Jul Aug Sep Oct Nov Dec Jan Feb Mar
N
u
mb
e
r
Australia
2006 2011 2016
10,000 20,000 30,000 40,000 50,000 60,000
Apr May Jun Jul Aug Sep Oct Nov Dec Jan Feb Mar
Nu
mbe
r
China
2006 2011 2016
5,000 10,000 15,000 20,000 25,000 30,000 35,000 40,000
Apr May Jun Jul Aug Sep Oct Nov Dec Jan Feb Mar
N
u
mb
e
r
USA
13
Figure 17 Seasonality – UK, Japan and Germany (Year ended March 2006, 2011 & 2016)
213,792 arrivals in 2016
↓30% since 2006
Arrival peak
51% Dec-Feb
91,344 arrivals in 2016
↓40% since 2006
Arrival peaks
12% December
12% February
12% March
90,496 arrivals in 2016
↑57% since 2006
Arrival peak
17% February
47% Dec-Feb
Source: Statistics New Zealand 10,000 20,000 30,000 40,000 50,000
Apr May Jun Jul Aug Sep Oct Nov Dec Jan Feb Mar
N
u
mb
e
r
UK
2006 2011 2016
2,000 4,000 6,000 8,000 10,000 12,000 14,000 16,000 18,000
Apr May Jun Jul Aug Sep Oct Nov Dec Jan Feb Mar
Nu
mbe
r
Japan
2006 2011 2016
2,000 4,000 6,000 8,000 10,000 12,000 14,000 16,000 18,000
Apr May Jun Jul Aug Sep Oct Nov Dec Jan Feb Mar
N
u
mb
e
r
Germany
14
Figure 18 Seasonality – Singapore, India and Malaysia (Year ended March 2006, 2011 & 2016)
51,408 arrivals in 2016
↑75% since 2006
Arrival peak
24% December
Peak becoming more pronounced
46,512 arrivals in 2016
↑159% since 2006
Arrival peaks
13% December
11% March
11% May
35,664 arrivals in 2016
↑57% since 2006
Arrival peaks
17% December
10% March
Source: Statistics New Zealand 2,000 4,000 6,000 8,000 10,000 12,000 14,000
Apr May Jun Jul Aug Sep Oct Nov Dec Jan Feb Mar
Nu
mbe
r
Singapore
2006 2011 2016
1,000 2,000 3,000 4,000 5,000 6,000 7,000
Apr May Jun Jul Aug Sep Oct Nov Dec Jan Feb Mar
N
u
mb
e
r
India
2006 2011 2016
1,000 2,000 3,000 4,000 5,000 6,000 7,000
Apr May Jun Jul Aug Sep Oct Nov Dec Jan Feb Mar
N
u
mb
e
r
Malaysia
15
Figure 19 Seasonality – Indonesia, Philippines and Brazil (Year ended March 2006, 2011 & 2016)
16,368 arrivals in 2016
↑132% since 2006
Arrival peaks
25% July
15% December
15,456 arrivals in 2016
↑156% since 2006
Arrival peaks
14% December
13% March
11% May
12,800 arrivals in 2016
↑65% since 2006
Arrival peak
13% December
43% Nov-Feb
Source: Statistics New Zealand 500 1,000 1,500 2,000 2,500 3,000 3,500 4,000 4,500
Apr May Jun Jul Aug Sep Oct Nov Dec Jan Feb Mar
N
u
mb
e
r
Indonesia
2006 2011 2016
500 1,000 1,500 2,000 2,500
Apr May Jun Jul Aug Sep Oct Nov Dec Jan Feb Mar
Nu
mbe
r
Philippines
2006 2011 2016
500 1,000 1,500 2,000 2,500
Apr May Jun Jul Aug Sep Oct Nov Dec Jan Feb Mar
N
u
mb
e
r
Brazil
16 Expenditure
Table 1 shows the average spend for the key markets in 2016 and 2015. While spend has gone up for all six key markets it has grown the most for the USA and Japanese markets.
Table 1 Change in average expenditure for key markets (Year ended March 2015 and 2016)
Average spend 2016 Average spend 2015 Change % Change
Australia $1,864 $1,746 $118 6.76%
China $4,694 $4,265 $429 10.06%
USA $4,717 $3,578 $1,139 31.83%
UK $4,917 $4,669 $248 5.31%
Japan $2,893 $2,326 $567 24.38%
Germany $5,993 $5,664 $329 5.81%
Accommodation
Domestic visitors accounted for 66% of North Island commercial accommodation guest nights and 50% of South island guest nights in 2016 (Figure 20).
Figure 20 Guest nights – domestic and international (%) (Year ended March 2016)
Source: Statistics New Zealand
Figure 21 shows the percentage of domestic visitor guest nights in commercial accommodation by RTO regions (Year ended March 2016). These data show that all five RTO regions with a majority of international guest nights were in the South Island (Wanaka, West Coast, Queenstown, Mackenzie and Fiordland). Between 50 and 60 percent of guest nights in the Auckland, Rotorua, Canterbury and
Marlborough RTO regions were domestic. At the other end of the scale, all seven 65.5%
49.6% 59.0%
34.5% 50.4%
41.0%
0.0% 10.0% 20.0% 30.0% 40.0% 50.0% 60.0% 70.0% 80.0% 90.0% 100.0%
North Island South Island Total
Percent
Guest nights - domestic and international (%)
(Year ended March 2016)
17
RTO regions with more than 80% of guest nights taken by domestic visitors were in the North Island. These data are displayed in the SOI in map format (Figure 18).
Figure 21 Domestic accommodation percentages by RTO (Year ended March 2016)
30.1% 30.6% 32.4%
40.0% 40.8%
51.6% 51.7%
55.2% 56.9%
63.8% 63.8% 64.8% 65.1% 65.9%
66.4% 67.1%
68.0% 68.0% 68.1% 69.6%
72.2% 74.2% 74.3% 76.4%
78.5% 79.0% 80.8%
83.1% 84.7% 84.9% 85.9%
88.0% 90.3%
0.0% 10.0% 20.0% 30.0% 40.0% 50.0% 60.0% 70.0% 80.0% 90.0% 100.0% Fiordland
Mackenzie Queenstown West Coast Wanaka
Rotorua Marlborough Canterbury Auckland Ruapehu Nelson-Tasman Dunedin Northland Waitaki Clutha Wellington City Taupo Coromandel Wellington Southland Hawke's Bay Waikato Hurunui Bay of Plenty Timaru Central Otago Wanganui Whakatane-Kawerau Gisborne Wairarapa Taranaki Kapiti-Horowhenua Manawatu
Percent
18
SOI survey results
The SOI 2016 report contains key survey results. Although the online survey was designed so that respondents were unable to skip answering questions there was some drop-off by respondents with progression through the survey itself. For example, the first question was answered by 261 respondents, whereas the final six questions were only answered by 246 respondents (n=number of respondents answering each question). Not all respondents answered the open-ended questions.
As a result of overlap in association membership, with some potential respondents listed on multiple databases, and having no information on the size of various databases accessed, it was not possible to estimate a response rate for the survey. A similar number of responses (n=269) were attained in the 2015 SOI Survey.
Survey data were transported directly into SPSS 23 (Statistical Package for Social Sciences) for analysis. The survey respondents are described according to their tourism business/role and regional location. Frequency and mean scores are reported for each of the agree/disagree statement questions. Data collected via open-ended questions are presented according broad categories identified during analysis with raw survey data in support. The 2016 SOI Survey was designed as a standalone data set and the majority of results are presented accordingly. However, the re-use of a number of question items from the SOI 2015 Survey allows for some comparison of results between survey years.
Sample description
Figure 22 shows the tourism business type/role reported by 261 respondents. The largest group of respondents were from the accommodation sector (40.6%, n=106) followed by attractions and activities (20.3%, n=53) and tour operators (14.2%,
n=37).
Figure 22 Primary business focus
3 7
16 19
20 37
53
106
0 20 40 60 80 100 120
Retail Food & hospitality services Promotion & marketing Transport Other Tour operator Attractions & activities Accommodation
19
The 20 respondents reporting an ‘other’ focus or role included those whose roles spanned multiple categories (e.g. RTO - marketing and destination development) as well as those involved in tourism education, local government, research, and information, translation and consultancy services (Table 2).
Table 2 Other tourism business focus/roles
Other tourism focus/roles
Consultancy 2 Research 1
RTO 2 Market research 1
Publishing & marketing 1 Research & education 1
Inbound operator 1 Tourism service 1
Local government 1 Tourism organisation 1
Education/training 1 Museum & information provision 1
Travel & tourism education 1 1-SITE 1
Working holiday programme 1 Translation 1
Real Estate – tourism property 1 Sheep & beef farm 1
Survey respondents were almost equally split between the North Island (49.4%,
n=129) and South Island (50.6%, n=132). One third of all North Island respondents
were from Auckland (Figure 23). Of the South Island respondents, slightly more than a third were from Otago and just under a third were from Canterbury (Figure 24).
Figure 23 Location of sample – North Island regions
Northland,
n=15, 12%
Auckland, n=43, 33% Waikato,
n=18, 14%
Bay of Plenty,
n=17, 13% Gisborne, n=2, 1%
Hawke's Bay,
n=6, 5%
Taranaki,
n=6, 5%
Manawatu-Wanganui,
n=7, 5%
Wellington,
n=15, 12%
Other,
n=21, 16%
20
Figure 24 Location of sample – South Island regions
Challenges
Respondents were given a list of 22 tourism industry challenges and asked to indicate the extent to which they agreed or disagreed that each was a challenge facing the tourism industry. For ease of survey formatting the challenges were split into three groups relating to visitors (7 challenges), business (5 challenges) and the operating environment of the tourism industry (10 challenges). The results are presented here according to these three groupings with 261 respondents answering the visitor challenge question, 258 respondents answering the business challenge question and 257 respondents answering the operating environment question. The State of the Industry 2016 report presents these challenge results in a collated form.
Visitor challenges
Altogether, 261 respondents answered the visitor challenge question. As Figure 25 shows, the most significant visitor challenge was seasonality, with 242 respondents (92.8%) agreeing that this was a challenge and almost half (48.7%, n=127) strongly agreeing. One third of all respondents (n=87) strongly agreed that satisfying demand for public facilities and amenities. Slightly more than quarter of all respondents (n=68) strongly agreed that limited regional dispersal was a challenge.
Marlborough,
n=28, 21%
Nelson/Tasman,
n=9, 7%
Canterbury,
n=39, 30%
West Coast,
n=6, 4%
Otago,
n=45, 34%
Southland,
n=5, 4%
Other,
n=20, 15%
21
Figure 25 Visitor challenges
Business challenges
Altogether, 258 respondents answered the business challenge question. The most significant business challenges were increasing regulatory demands and compliance costs, reported by 234 respondents (90.8%) and staff and skill shortages reported by 227 respondents (88%). Almost a third (31%) and a fifth (21.7%) of respondents strongly agreed that these were challenges (Figure 26).
Figure 26 Business challenges
27.6 20.7 19.2 14.6 14.1 11.5 7.2
41 26.4
32.2 24.1 25.3 18.8 16.5
24.5 36
36 38.3 34.5 36.4 27.6
6.9 16.9
12.6 23 26.1 33.3 48.7
0 10 20 30 40 50 60 70 80 90 100
Exchange rates Meeting visitor expectations Changing visitor markets Maximising domestic tourism potential
Limited regional dispersal Demand for public facilities & amenities Seasonality issues
PERCENT
Challenges relating to visitors
Disagree Somewhat agree Agree Strongly agree
31 23.3 17.1 12 9.3
33.3 26 34.5 24.4 27.1
27.6 32.9
37.2 41.9 32.6
8.1 17.8
11.2 21.7 31
0 10 20 30 40 50 60 70 80 90 100
Technology services for businesses Satisfying visitor demand for technology
Changing marketing channels Staff & skill shortages Increasing regulatory demands & compliance
costs
PERCENT
Challenges relating to businesses
22 Operating environment challenges
Altogether, 257 respondents answered the operating environment challenge question. The highest levels of agreement with operating environment challenges were with infrastructure issues. As Figure 27 shows, the two items attracting the highest levels of strong agreement were lack of investment in infrastructure (37.4%) and lack of investment in hotel accommodation (30.7%). The challenge items
attracting the highest levels of overall agreement were ‘achieving ongoing
sustainability’ (94.5% agreement) and environmental concerns (92.6% agreement).
Figure 27 Operating environment challenges
Table 3 presents a summary of all the challenge items (i.e., visitor, business and operating environment) according to which ones attracted the most ‘disagree’ responses, the most ‘agree’ responses, the most ‘strongly agree’ responses and the ‘most ambivalent’ responses.
42.1 32.7 24.9 22.6 21.8 20.6 12.1 8.9 7.4 5.5
37.7 26.5 42.8 20.2
28 23 37.7 21.4 24.9 27.6
12.8 21
18.7 30
29.2 25.7
31.1 32.3
38.1 38.5
7.4 19.8
13.6 27.2
21 30.7
19.1 37.4
29.6 28.4
0 10 20 30 40 50 60 70 80 90 100
Lack of air capacity Poor quality roading for visitors Lack of investment in sector research Gaining local council support for tourism Managing negative community perceptions of
tourism
Lack of investment in hotel accommodation Achieving greater industry cohesion Lack of investment in infrastructure
Environmental concerns Achieving ongoing sustainability
PERCENT
Challenges relating to operating environment
23
Table 3 Summary of key challenge agreement/disagreement results
Challenge items % of
respondents Most ‘disagree’ responses
Lack of air capacity 42.1
Poor quality roading for visitors 32.7
Technology services for businesses 31.0
Exchange rates 27.6
Lack of investment in sector research 24.9
Most ‘agree’ responses
Achieving ongoing sustainability (mean=4.89) 94.5
Seasonality issues (mean=5.15) 92.8
Environmental concerns (mean=4.88) 92.6
Lack of investment in infrastructure (mean=4.96) 91.1
Increasing regulatory demands & compliance costs (mean=4.81) 90.7
Most ‘strongly agree’ responses
Seasonality issues 48.7
Lack of investment in infrastructure 37.4
Satisfying demand for public facilities & amenities 33.3
Increasing regulatory & compliance costs 31.0
Lack of investment in hotel accommodation 30.7
Most ambivalent (i.e., ‘somewhat’ agree/disagree) responses
Exchange rates 66.7
Lack of air capacity 62.2
Lack of investment in sector research 58.8
Lack of investment in infrastructure 28.8
Satisfying visitor demand for technology 24.9
Seasonality issues 21.1
Figure 28 compares the percentage change in agreement for the challenge items used in both the 2015 and 2016 surveys (n=14). Some caution is advised with respect to these comparative data as a result of differences in the way data was collected. In 2015, for example, respondents were simply asked if they thought the items listed were challenges (i.e., with a yes/no option); in 2016 these questions employed a scale-format asking for agreement/disagreement and in Figure 28 we only report the percentage of respondents (in 2016) indicating that they ‘agree’ or ‘strongly agree’ with each challenge listed.
24
Figure 28 Percentage change in agreement with challenges (2015 & 2016)
Changing visitor markets
Changing visitor markets was selected for more detailed examination on the basis of having presented the most reported challenge to the industry in the 2015 survey, although as Figure 28 shows the percentage of respondents reporting this as a challenge in 2016 was 19.8 percentage points lower. As noted above, direct comparison of all challenges reported was not possible due to different question formatting, while no specific question relating to issues associated with changing markets was included in the 2015 survey. Altogether, in 2016 the total number of respondents (i.e., also including those who only ‘somewhat agreed’) agreeing that ‘changing visitor markets’ was a challenge was 211 (80.8%) indicating that this remains a significant challenge for the industry.
Domestic tourism
Figure 29 shows the change in the percentage of respondents indicating that they either ‘agree’ or ‘strongly agree’ with each domestic tourism statement in the 2015 and 2016 surveys. The biggest increase in agreement was with the statement that domestic tourism is ‘not supported by regular and robust insight to improve destination planning strategies’ (up 12.3%). The biggest decrease was with
22.3
13.312.4 6.9
3.4 3
-1.2-1.5-2.1 -8.1
-10.3 -16
-19.8
-32.9 -40
-30 -20 -10 0 10 20 30
PE
R
C
EN
TA
GE
C
H
A
N
GE
IN
A
GRE
EM
EN
T
Change in agreement with challenges 2015
-2016
Limited regional dispersal
Maximising domestic tourism potential
Seasonality issues
Lack of investment in infrastructure
Environmental concerns
Staff & skill shortages
Technology services for business
Increasing regulatory demands & compliance costs
Visitor demand for technology
Meeting changing market expectations
Changing marketing channels
Lack of investment in sector research
Changing visitor markets
25
agreement that domestic tourism ‘mitigates seasonality and drives visitation through the off-season’ (down 19.6%).
Figure 29 Percentage change in agreement with domestic tourism statements (2015 & 2016)
Staff and skill issues
Figure 30 shows the change in the percentage of respondents indicating that they either ‘agree’ or ‘strongly agree’ with each staff and skill issue in the 2015 and 2016 surveys. The issue with the largest increase in agreement was ‘reliance on migrant labour’ (up 11.3%) while the only issues to have improved were ‘poor service levels’ (down 25.7%) and ‘staff remuneration as a barrier to recruitment’ (down 1.9%).
12.3
5.5 3.4
2.2 1.4
-2.9 -3.6
-4.5
-17.6 -20
-15 -10 -5 0 5 10 15
PE
R
C
EN
TA
GE
C
H
A
N
GE
IN
A
GRE
EM
EN
T
Change in agreement with domestic tourism
statements 2015-2016
Is not supported by regular & robust insight to improve destination planning strategies
Lacks the right infrastructure & transport links
Is not seen as an aspirational proposition compared to international destinations
Lacks cohesive marketing through a gap in funding & capability
Is seen by NZers as expensive compared to international destinations
Supports business success & develops capabilites
Significantly contributes to regional economies
Supports commercial accommodation
26
Figure 30 Percentage change in agreement with staff and skill issues (2015 & 2016)
Sustainability
Table 4 presents a summary of rating scores for the individual sustainability components.
Table 4 Summary of rating scores for sustainability components
Sustainability component
Rating scores (%)
Range Mean Median Mode
Economic 1 - 95 35.91 35 40
Environmental 3 - 80 29.97 30 30
Social 0 - 51 17.26 15 10
Cultural 0 - 50 16.87 15 10, 20
11.3
4.5 3.5
2.5
0.4 0.2
-1.9
-25.7 -30
-25 -20 -15 -10 -5 0 5 10 15
3
PE
R
C
EN
TA
GE
C
H
A
N
GE
IN
A
GRE
EM
EN
T
Change in agreement with staff & skill
issues 2015-2016
Reliance on migrant labour
Poor promotion of tourism as a career
Staff shortages
Visa issues
Staff retention
Migrant labour exploitaton
Staff remuneration as a barrier to recruitment
27
State of the Industry 2016 survey
State of the Tourism Industry 2016
Opening page of survey
Thank you for taking part in this survey. The survey has only 10 questions and should take you approximately 10-15 minutes to complete – the completion bar will show you how far you have progressed.
After starting the survey, the system will allow you up one week to complete the survey. The final cut-off/expiration date of the survey is 10 July 2016.
The State of the Industry 2016 survey seeks your opinion on some of the challenges facing the tourism industry overall and, more specifically, in respect of changing markets, domestic tourism and issues associated with staff and skills. It also asks you what you think are the biggest opportunities in the current tourism industry. The survey concludes with a question about sustainability and gives you the opportunity to provide your own feedback about what you think of the State of the Industry.
Even if your business/operations/responsibilities are not totally focused on tourism we would still like to know what you think about the State of the Tourism Industry in 2016.
Before starting the survey we need you to acknowledge that you:
Have read the description of the project in the accompanying email and agree
to participate
Understand that participation is voluntary
Understand that you may withdraw from the survey at any time up until
clicking on the ‘submit survey’ button
Understand that any data collected via incomplete surveys will be excluded
from analysis
I agree to participate in the survey based on the above - clicking on the green
28
Q1
What is your primary business focus? Accommodation
Attractions and activities
Transport
Retail
Food and hospitality services
Tour operator
Promotion/marketing
Other - what type of business do you have? ____________________
Q2
In which region are you located? Northland
Auckland
Waikato
Bay of Plenty
Gisborne
Hawke's Bay
Taranaki
Manawatu-Wanganui
Wellington
Marlborough
Nelson/Tasman
Canterbury
West Coast
Otago
Southland
Q3
This question asks your views on some challenges facing the tourism industry.29
Q3a.The first group of challenges primarily relate to visitors. Please indicate the extent to which you agree or disagree that each item listed is a challenge for the tourism industry.
Strongly
disagree Disagree
Somewhat disagree
Somewhat
agree Agree
Strongly agree
Changing visitor markets
Meeting visitor expectations
Seasonality
issues
Exchange
rates
Limited regional dispersal
Maximising domestic
tourism potential
Satisfying visitor demand for
public facilities and
amenities
30 Strongly
disagree Disagree
Somewhat disagree
Somewhat
agree Agree
Strongly agree
Technology services for businesses
(e.g., booking systems
Increasing regulatory demands
and compliance
costs
Staff and skill shortages
Changing marketing channels
Visitor demand
for technology
(e.g., free WIFI)
Q3c. The last group includes some of the broader challenges relating to the
31 Strongly
disagree Disagree
Somewhat disagree
Somewhat
agree Agree
Strongly agree
Lack of investment in infrastructure
Environmental
concerns
Achieving greater industry
cohesion
Achieving ongoing sustainability
Lack of air
capacity
Gaining local council support
for tourism
Managing negative community perceptions of
tourism
Lack of investment in
hotel accommodation
Poor quality roading for
visitors
Lack of investment in sector research
Q4
Some of the challenges we asked you about related to changing visitor markets32 Strongly
disagree Disagree
Somewhat disagree
Somewhat
agree Agree
Strongly agree
We have time to adapt to new visitor markets
There is good understanding
of new visitor markets
We have adequate information
to adapt products and
services
We need skilled and
language proficient staff to meet
changing market requirements
New emerging markets are
poor contributors
to regional dispersal
New emerging markets offer
a solution to seasonality
issues
More effort should be
made to attract niche
markets
Q5
Another one of our challenges concerns maximising domestic tourismpotential. In this question we are interested in your perception of the challenges and opportunities associated with the domestic visitor market.
33 Strongly
disagree Disagree
Somewhat disagree
Somewhat
agree Agree
Strongly agree
Supports commercial accommodation
Supports informal accommodation
(e.g. holiday homes or
AirBnB)
Significantly contributes to
regional economies
Supports business success
and develops capability
Mitigates seasonality and drives visitation through the off-peak season
Domestic market segments are not
currently understood
Is seen by New Zealanders as
expensive compared to international destinations
Is not seen by domestic tourists as an aspirational
proposition compared to international destinations
Lacks cohesive marketing through a gap in
funding and capability
Lacks the right infrastructure and transport
links
34 Is not supported
by regular and robust insight to
improve destination
planning strategies
Q6
Another challenge was staff and skill shortages. A selection of issues associatedwith staff and skills are listed below - please indicate the extent to which you either agree or disagree that each of these represents a significant challenge for the tourism industry.
Strongly
disagree Disagree
Somewhat disagree
Somewhat
agree Agree
Strongly agree
Skill shortages
Staff shortages
Poor promotion of
tourism as a career
Reliance on
migrant labour
Migrant labour
exploitation
Visa issues
Staff retention
Poor service
levels
Lack of suitable
off-job training options
Staff remuneration as a barrier to recruitment
Q7
What do you think are the biggest opportunities in the current tourism industry?35
Q8
To what extent do you agree or disagree with the statement – “Sustainability, in terms of economic, cultural, social and environmental sustainability, must become a genuine underpinning of the New Zealand tourism industry”.Strongly
disagree Disagree
Somewhat disagree
Somewhat
agree Agree
Strongly agree
Q9
How would you rate the importance of each of these individual components ofsustainability in achieving overall sustainability for the tourism industry? (Please allocate a % to each so that the total adds up to 100%)
______ Economic - profitable and viable businesses operating long term, with the capacity to act on opportunities that emerge
______ Environmental - ensuring that the tourism industry both protects and champions the environment on which it is reliant
______ Cultural - showcasing our unique culture to enhance visitor experience and create opportunities for Maori and non-Maori
______ Social - making sure that tourism has the support of the NZ public
(NB – this question is set up so that the allocation must add up to 100)
Q10
If you have anything else you want say about the State of the Tourism Industryin 2016 you can write it here.
(Space given to write additional comments)
Click here to submit survey - please note that if you do not click on this button your answers will not be included in the analysis
End of survey text
Thank you for completing this survey. If you wish to know more about this research
you can contact either Jude Wilson (jude.wilson@lincoln.ac.nz) or Nienke van Dijken