for publication in the following source:
Dennis, Emily, Jahanshad, Neda, McMahon, K.,de Zubicaray, Greig, Mar-tin, Nicholas, Hickie, Ian, Toga, Arthur, Wright, Margaret, & Thompson, Paul
(2014)
Development of insula connectivity between ages 12 and 30 revealed by high angular resolution diffusion imaging.
Human Brain Mapping,35(4), pp. 1790-1800.
This file was downloaded from: https://eprints.qut.edu.au/85758/
c
Consult author(s) regarding copyright matters
This work is covered by copyright. Unless the document is being made available under a Creative Commons Licence, you must assume that re-use is limited to personal use and that permission from the copyright owner must be obtained for all other uses. If the docu-ment is available under a Creative Commons License (or other specified license) then refer to the Licence for details of permitted re-use. It is a condition of access that users recog-nise and abide by the legal requirements associated with these rights. If you believe that this work infringes copyright please provide details by email to [email protected]
Notice:Please note that this document may not be the Version of Record (i.e. published version) of the work. Author manuscript versions (as Sub-mitted for peer review or as Accepted for publication after peer review) can be identified by an absence of publisher branding and/or typeset appear-ance. If there is any doubt, please refer to the published source.
Development of Insula Connectivity Between Ages 12 and 30
Revealed by High Angular Resolution Diffusion Imaging
Emily L. Dennis1, Neda Jahanshad1, Katie L. McMahon2, Greig I. de Zubicaray3, Nicholas G. Martin4, Ian B. Hickie5, Arthur W. Toga1, Margaret J. Wright3,4, and Paul M. Thompson1,* 1Imaging Genetics Center, Laboratory of Neuro Imaging, UCLA School of Medicine, Los Angeles,
California
2Center for Advanced Imaging, University of Queensland, Brisbane, Australia
3School of Psychology, University of Queensland, Brisbane, Australia
4Queensland Institute of Medical Research, Brisbane, Australia
5Brain and Mind Research Institute, University of Sydney, Australia
Abstract
The insula, hidden deep within the Sylvian fissures, has proven difficult to study from a connectivity perspective. Most of our current information on the anatomical connectivity of the insula comes from studies of nonhuman primates and post mortem human dissections. To date, only two neuroimaging studies have successfully examined the connectivity of the insula. Here we examine how the connectivity of the insula develops between ages 12 and 30, in 307 young adolescent and adult subjects scanned with 4-Tesla high angular resolution diffusion imaging (HARDI). The density of fiber connections between the insula and the frontal and parietal cortex decreased with age, but the connection density between the insula and the temporal cortex generally increased with age. This trajectory is in line with well-known patterns of cortical development in these regions. In addition, males and females showed different developmental trajectories for the connection between the left insula and the left precentral gyrus. The insula plays many different roles, some of them affected in neuropsychiatric disorders; this information on the insula's connectivity may help efforts to elucidate mechanisms of brain disorders in which it is implicated.
Keywords
insula; development; tractography; HARDI; structural connectivity
© 2013 Wiley-Periodicals, Inc.
*Correspondence to: Paul M. Thompson, Professor of Neurology and Psychiatry, Imaging Genetics Center, Laboratory of Neuro
NIH Public Access
Author Manuscript
Hum Brain Mapp. Author manuscript; available in PMC 2014 May 12.
Published in final edited form as:
Hum Brain Mapp. 2014 April ; 35(4): 1790–1800. doi:10.1002/hbm.22292.
NIH-PA Author Manuscript
NIH-PA Author Manuscript
Introduction
The insula, located deep in the lateral sulcus of the Sylvian fissure and spanning Brodmann areas 13 through 16 [Augustine, 1996], is a relatively old structure evolutionarily [Mega et al., 1997] and develops earlier than the frontal cortex [Benes, 1994]. The structure of the insula differentiates early [Benes, 1994; Chi et al., 1977] and its fibers are some of the earliest to form [Huang et al., 2006], but its structure has a protracted development, like many other cortical areas [Hasan et al., 2009; Herting et al., 2012; Kalani et al., 2009; Muftuler et al., 2011; Paus et al., 1999]. Our current understanding of the structural connectivity of the insula comes primarily from studies of non-human primates and post
mortem human studies. Only two studies have detailed the structural connectivity of the
insula in humans in vivo [Cerliani et al., 2011; Cloutman et al., 2012].
In humans, the insula is perhaps best known for its role in emotional processing and anxiety [Etkin and Wager, 2007; Stein et al., 2007]. It is a heterogeneous structure with many other functions, including interoception, monitoring external sensory processes, and autonomic regulation [Augustine, 1996; Craig, 2008]. This diverse range of functions derives from the many sub-regions of the insula, distinguished from each other by cytoarchitectonics and connectivity with other brain regions [Kurth et al., 2010; Mesulam and Mufson, 1982; Wager and Barrett, 2004]. By analyzing prior anatomical studies, Wager and Barrett [2004] divided the insula into an anterior ventral region involved in emotion, a dorsal anterior region involved in motivation and goal directed behavior, a posterior region involved in pain perception, and a mid-insula region for which they did not assign a specific role. Kurth et al. [2010] conducted a meta-analysis of functional neuroimaging data and developed a similar parcellation: a dorsal anterior aspect involved in cognitive tasks, an anterior ventral aspect involved in social-emotional tasks, a midinsula aspect involved in smell and taste, and a mid-posterior insular aspect involved in sensorimotor tasks.
Research using functional connectivity suggests that the insula is involved in modulating resting-state functional network dynamics [Hamilton et al., 2011; Sridharan et al., 2008]. Sridharan et al. proposed that the insula was responsible for switching between the default mode and executive control networks. The default mode network, or ‘task-negative’
network, is a collection of brain regions that are more active during rest than during a task. It has been assigned many roles, ranging from monitoring the external environment to
supporting mind wandering [Buckner et al., 2008; Fransson, 2005; Gusnard and Raichle, 2001]. The executive control networks, or ‘task-positive’ network, includes a number of prefrontal and parietal regions and is thought to support executive functions such as memory and goal-directed behavior [Seeley et al., 2007]. A recent paper by Cauda et al. [2011] details the functional connectivity of the insular cortex. By dividing the insula into 10 ‘seeds’ – loci where they assessed functional coherence with activation in other brain regions – they parsed out separate networks for the ventral-anterior and the dorsal-posterior insula. The ventral-anterior insula was functionally linked to the middle and inferior temporal cortex and to the anterior cingulate cortex, while the dorsal-posterior insula was linked to the premotor, sensorimotor, supplementary motor and middle-posterior cingulate cortex.
NIH-PA Author Manuscript
NIH-PA Author Manuscript
There have not been many in vivo investigations of structural connectivity in humans that report results for the insula [Cerliani et al., 2011; Cloutman et al., 2012; Uddin et al., 2010; van den Heuvel et al., 2009]. Tract tracing in nonhuman primates shows that the insula is extensively connected to the surrounding cortex, basal ganglia, amygdala, limbic areas, and thalami [Augustine, 1996]. In the frontal lobe, the frontal operculum, orbital, orbitofrontal, and prefrontal cortices all have reciprocal connections with the insula. The premotor cortex, inferior frontal gyrus, and ventral granular frontal cortex all receive efferents from the insula but do not send afferents to the insula. In the parietal lobe, the anterior inferior parietal cortex, parietal operculum, somatosensory cortex, and retroinsular cortex all have reciprocal connections with the insula. In the temporal lobe, the temporal pole and superior temporal sulcus have reciprocal connections with the insula. The insula receives fibers from the auditory cortices and temporal operculum and sends to the supratemporal plane and temporopolar cortex. In the cingulate cortex, Brodmann areas 23 and 24 both have reciprocal connections with the insula. In addition, the insula also has many local
connections with itself. Among subcortical regions, the insula also has connections with the basal nuclei, amygdala, hippocampus, entorhinal cortex, and thalamus [Augustine, 1996].
Post mortem gross dissection in humans reveals a variety of connections between the insula
and the rest of cerebral cortex, as well as numerous subcortical structures [Angevine et al., 1962; Le Gros Clark et al., 1939; Klinger and Gloor, 1960; Yakovlev et al., 1960]. These known connections and those discussed below are summarized in Figure 1.
To date, only two studies have successfully imaged the structural connectivity of the insula in humans in vivo. Cerliani et al. [2011] examined the voxel-wise structural connectivity of the insula in 10 adult males using 3-Tesla 15-gradient diffusion-weighted imaging and probabilistic tractography, and found two separate networks. The anterior insula was primarily connected to limbic and paralimbic regions, and the inferior frontal gyrus, while the caudal insula was primarily connected to the parietal and posterior temporal cortices. Cloutman et al. [2012] examined the connectivity of the insula in 24 adult participants using 3-Tesla 61-gradient diffusion-weighted imaging and probabilistic tractography from seven anatomically defined insular ROIs (regions of interest). Similarly, they were able to define two separate networks that the insula participated in: anterior portions of the insula were connected with orbital frontal, inferior frontal, and temporal regions via a ventral pathway, while posterior portions of the insula were connected with mostly posterior temporal regions via both dorsal and ventral pathways. Both Cerliani et al. [2011] and Cloutman et al. [2012] found a transitional area of the insula, possibly the dysgranular insula, which showed a more heterogeneous, hybrid connectivity pattern. Both of these studies were limited in sample size (N = 10 males; N = 24 adults), so we set out to look at a larger, cross sectional cohort (N = 307) with a high angular resolution diffusion-weighted scan (4-Tesla, 94-gradients) with a greater ability to resolve crossing fibers.
In this study, we characterize how the structural connectivity of the insula changes over adolescence using high angular resolution diffusion imaging (HARDI) in three separate age cohorts—12 year olds, 16 year olds, and 20–30 year olds. We expected to identify many of the same connections observed in prior studies, but expected that we might also find some cortical connections that have not yet been characterized. The insula develops relatively
NIH-PA Author Manuscript
NIH-PA Author Manuscript
early, earlier than the frontal cortex [Benes, 1994; Chi et al., 1977; Huang et al., 2006], but has a protracted maturational period [Kalani et al., 2009; Hasan et al., 2009; Herting et al., 2012; Muftuler et al., 2011; Paus et al., 1999]. Thus, we hypothesized that we would be able to detect age effects in the age range studied here. During this stage of development, the connections to and from the frontal cortex tend to decrease in fiber density, while those of the temporal cortex tend to increase in fiber density [Dennis et al., 2012]. Given this, we expected to see reductions in the density of the connections between the insula and the frontal cortex, and increases in the density of the connections between the insula and the temporal cortex.
Materials and Methods
Participants
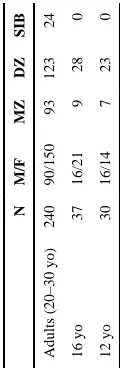
Participants were recruited as part of a large-scale imaging genetics project in Australia involving twins. Our analysis included 307 subjects (adult cohort: 150 females/90 males, average age= 23.9, SD = 1.9; 16 year old cohort: 21 females/16 males, average age = 16.2, SD = 0.35; 12-year-old cohort: 14 females/16 males, average age =1 2.4, SD = 0.19). While we refer to them as different age cohorts, this is only because of sparse sampling; age was treated as a continuous variable in our statistical analyses. Our population included 109 monozygotic (MZ) twins, 174 dizygotic (DZ) twins, and 24 nontwin siblings from 204 families. This information is summarized in Table I. The population was homogeneous ethnically; 100% of the sample was Caucasian. In genetic analyses, for which the cohort was originally recruited, a homogeneous population is preferred as common alleles can have different frequencies in different racial/ethnic groups. No subject had a history of significant head injury, neurological or psychiatric illness, substance abuse or dependence, or had a first-degree relative with a psychiatric disorder. Subjects also completed a neurocognitive exam to screen for possible brain pathology [de Zubicaray et al., 2008]. All participants were right-handed, as assessed by 12 items on Annett's Handedness Questionnaire [Annett, 1970].
Scan Acquisition
Whole-brain anatomical and high angular resolution diffusion images (HARDI) were collected with a 4T Bruker Medspec MRI scanner. T1-weighted whole-brain anatomical images were acquired with an inversion recovery rapid gradient echo sequence. Acquisition parameters were: TI/TR/TE = 700/1500/3.35 ms; flip angle = 8 degrees; slice thickness = 0.9 mm, with a 256×256 acquisition matrix. Diffusion-weighted images (DWI) were acquired using single-shot echo planar imaging with a twice-refocused spin echo sequence to reduce eddy-current induced distortions. Imaging parameters were: 23cm FOV, TR/TE 6090/91.7 ms, with a 128×128 acquisition matrix. Each 3D volume consisted of 55 2-mm thick axial slices with no gap and 1.79×.1.79 mm2 in-plane resolution. 105 images were acquired per subject: 11 with no diffusion sensitization (i.e., T2-weighted b0 images) and 94
diffusion-weighted (DW) images (b = 1159 s/mm2) with gradient directions evenly
distributed on the hemisphere. The younger subjects' HARDI scans were acquired with a 77-gradient protocol (69 DWI; 8 b0; b = 1177 s/mm2), as the 105-gradient protocol was too
long them to sit through. We have previously undertaken several detailed studies [Zhan et
NIH-PA Author Manuscript
NIH-PA Author Manuscript
al., 2009a, 2012a,b] verifying that we can reliably reconstruct crossing ODFs (orientation distribution functions) with these parameters, and to determine how angular and spatial resolution affect brain connectivity maps; the results and the stability of connectivity maps at high numbers of diffusion gradients are reported in those papers. The number of gradients affects the accuracy of reconstruction of the diffusion profile, but by the time 50-60
gradients are reached, the primary measures of diffusion, including the principal
eigenvector, have converged [Zhan et al., 2008, 2009b,c]. The connectivity matrix depends more on the voxel size than the number of gradients [Zhan et al., 2012a], and the voxel size was kept the same in the adolescents. Scan time for the 105-gradient HARDI scan was 14.2 min. Scan time for the 77-gradient HARDI scan was 10.8 min. Motion artifacts were assessed through detailed visual inspection of all the DWI scans, which occurred in addition to the standard motion correction of the diffusion-weighted image series via registration. The DWI data were pre-processed and visually inspected prior to this study, so the number of subjects discarded for motion artifacts was not mentioned as they were never considered for this analysis.
Cortical Extraction and HARDI Tractography
Connectivity analysis was performed exactly as in Jahanshad et al. [2011]. Briefly, non-brain regions were automatically removed from each T1-weighted MRI scan using ROBEX [Iglesias et al, 2011], and from a T2-weighted image from the DWI set, using the FSL tool “BET” (FMRIB Software Library, http://fsl.fmrib.ox.ac.uk/fsl/). Intracranial volume estimates were obtained from the full brain mask, and included cerebral, cerebellar, and brain stem regions. All T1-weighted images were linearly aligned using FSL (with 9 DOF) to a common space [Holmes et al., 1998] with 1 mm isotropic voxels and a 220×220×220 voxel matrix. Raw diffusion-weighted images were corrected for eddy current distortions using the FSL tool, “eddy_correct”. For each subject, the 11 eddy-corrected images with no diffusion sensitization were averaged, linearly aligned and resampled to a downsampled version of their corresponding T1 image (110×110×110, 2×2×2mm). Averaged b0 maps
were elastically registered to the structural scan using a mutual information cost function [Leow et al, 2005] to compensate for EPI-induced susceptibility artifacts. Higher field strength DWI images are susceptible to EPI-induced artifacts. We have been studying this in detail as we recently published a study of a sample of normal subject scanned at both 7-Tesla and 3-7-Tesla with DTI [Zhan et al., 2012]. In that study, the connectivity pattern was largely similar at higher field.
Thirty-four cortical labels per hemisphere, as listed in the Desikan-Killiany atlas [Desikan et al., 2006], were automatically extracted from all aligned T1-weighted structural MRI scans using FreeSurfer (http://surfer.nmr.mgh.harvard.edu/). As a linear registration is performed by the software, the resulting T1-weighted images and cortical models were aligned to the original T1-weighted input image space and down-sampled using nearest neighbor interpolation (to avoid intermixing of labels) to the space of the DWIs. To ensure tracts would intersect cortical labeled boundaries, labels were dilated with an isotropic box kernel of width 5 voxels. Since we were interested only in fibers with at least one terminus in the insula for the current study, we thresholded each subject's cortical models to only include left and right insula (kept as separate cortical labels). At this step, the insula masks were
NIH-PA Author Manuscript
NIH-PA Author Manuscript
visually inspected for quality. Masks were included only if they had complete coverage of the insula (with no areas of the mask with gaps in coverage). Additional reasons for exclusion were failed tractography or very sparse tractography. This resulted in 125 scans (from a total of 432 original subjects) being excluded, all of which were of adults.
The transformation matrix from the linear alignment of the mean b0 image to the
T1-weighted volume was applied to each of the 94 gradient directions to properly reorient the orientation distribution functions (ODFs). At each HARDI voxel, ODFs were computed using the normalized and dimensionless ODF estimator, derived for q-ball imaging (QBI) in [Aganj et al, 2010]. We performed HARDI tractography on the linearly aligned sets of DWI volumes using these ODFs. Tractography was performed using the Hough transform method as described in [Aganj et al, 2011].
Elastic deformations obtained from the EPI distortion correction, mapping the average b0 image to the T1-weighted image, were then applied to the tracts' 3D coordinates for accurate alignment of the anatomy. Each subject's dataset contained 3,500-5,000 useable fibers (3D curves). At this stage, all 68 cortical labels were used to determine the targets of the tracts originating in the insula. Fibers were filtered to eliminate those that may have arbitrarily been drawn on the brain-boundary due to noise and high FA. All duplicate fibers were removed. Tracts with fewer than 2 points were filtered out, as they were considered to be noise.
After tractography, the left and right outputs were combined to create one 2 × 68 connectivity matrix for each subject. Each element described the proportion of the total number of fibers connecting the left or right insula to each of the 34 labels per hemisphere. These values were calculated as a proportion—they were normalized to the total number of fibers traced for each person in the study—so that results were not skewed by raw fiber count.
Age Regression
Age-related effects on insular structural connectivity were estimated using a general linear mixed model, as some related subjects were included in our analysis:
(1)
Here, “2×68 matrix elements” is the 2×68 matrix describing the proportional fiber density between the left and right insula and all 68 cortical labels. These matrices were tested on an element-by-element basis. Any statistical effects on the fiber connection matrices were corrected for multiple comparisons using the conventional FDR method [false discovery rate, Benjamini and Hochberg, 1995]. In the regression equation, A is the constant fiber density term, the βs are the covariate regression coefficients, and α is a coefficient that accounts for random effects. Random effects were used to account for familial relatedness. We modeled these variables (age, sex, ICV) as fixed effects. We also tested age2 to check for any nonlinear age effects, and an interaction term, age*sex, as well. ICV denotes intracranial volume, in mm3. The analysis was implemented in the R statistical package
NIH-PA Author Manuscript
NIH-PA Author Manuscript
(version 2.9.2; http://www.r-project.org/) using the ‘nlme’ library [Pinheiro and Bates, 2000].
Permutation Testing
As we have sparse sampling of certain ages, nonparametric methods may be considered more appropriate that statistical methods described above. Accordingly, we ran 1,000 permutations, permuting age but maintaining the twin structure of our subject pool. This was done by permuting families together—twins were permuted together, family groups of three were permuted together, and Individuals were permuted with other individuals. To generate permutation corrected P values, we then used the following formula: P = (b + 1)/(m + 1), where b is the number of test statistics tperm more significant than the observed statistic tobs, and m is the number of permutations performed. With 1,000 permutations, the minimum P value possible is 0.000999, or 0.0010, if none of the tperm is more significant than the tobs
[Smyth and Phipson, 2010]. We then used FDR to test which connections survived correction for multiple comparisons.
Results
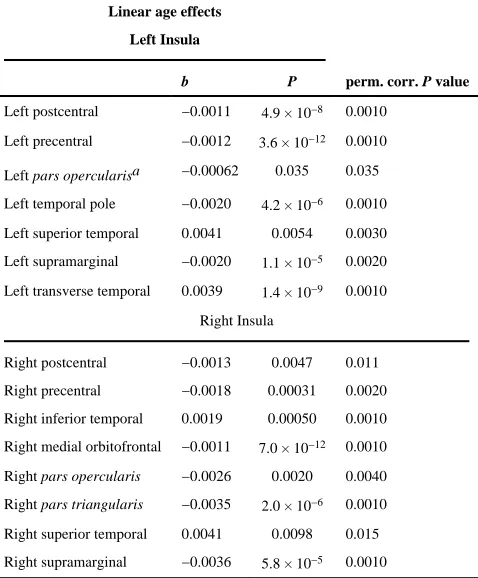
To assess developmental effects on insula connectivity, we tested connections for which in at least one of the groups (adults or adolescents), 75% of subjects had connections. For example, a connection that existed in 95% of adolescents but only in 50% of adults would be included. This is not 75% averaged across both groups. We chose a threshold of 75% because we wanted to be able to assess both connections that were present in both groups but changed in density, as well as those that were detected more in one group than the other. We thought the results of both of these questions would interest researchers and chose 75% as a threshold that could both assess change, while still being rigorous enough to not include connections existing in only a small subset of subjects. This resulted in 21 of 136 possible connections being tested, with being 14 significant with the original FDR threshold (when modeled by Eq. 1). There were significant age-related decreases in proportional fiber density between the left insula and the left postcentral gyrus (b=−0.0011, p=4.9×10⁻⁸), the left insula and the left precentral gyrus (b=−0.0012, p=3.6×10⁻¹²), the left insula and the left temporal pole (b=−0.0020, p=4.2×10⁻⁶), the left insula and the left supramarginal gyrus (b= −0.0020, p=1.1×10⁻⁵), the right insula and the right supramarginal gyrus (b=−0.0036,
p=5.8×10⁻⁵), the right insula and the right postcentral gyrus (b=−0.0013, p=0.0047), and the right insula and the right precentral gyrus (b=−0.0018, p=0.00031), the right insula and the right medial orbitofrontal gyrus (b=−0.0011, p=7.0×10⁻¹²), the right insula and the right
pars opercularis (b=−0.0026, p=0.0020), and the right insula and the right pars triangularis
(b=−0.0035, p=2.0×10⁻⁶). There was an age-related increase in proportional fiber density between the left insula and the left superior temporal gyrus (b=0.0041, p=0.0054), the left insula and the left transverse temporal gyrus (b=0.0039, p=1.4×10⁻⁹), the right insula and the right superior temporal gyrus (b=0.0041, p=0.0098), and the right insula and the right inferior temporal gyrus (b=0.0019, p=0.00050). These results are summarized in Table II. All results were corrected for multiple comparisons across all connections tested within the model (q<0.05). In other words, because many connections are tested for age effects, we only reported age effects strong enough to overcome the correction for multiple testing that
NIH-PA Author Manuscript
NIH-PA Author Manuscript
is implicit when analyzing an entire connectivity matrix. After permutation testing, all connections listed above were still significant. Additionally, one connection that was suggestively significant using the parametric model passed FDR after nonparametric tests – we also saw an age related decrease in fiber density between the left insula and left pars
opercularis (b=−0.00062, p=0.035). All age-related results are presented in Figure 2. We
also examined the raw fiber count matrices to determine if these were in fact increases and decreases in fiber density, or if perhaps a decrease found above was in fact an increase whose rate was slower than the overall changes in the rest of the brain. We found that most of our increases and decreases were in fact true increases or decreases in fiber count. When examining the fiber densities, the age effect on the connection between the left insula and the left superior temporal gyrus now registered as a decrease (b = −9.8, P = 0.020). A few of our significant connections no longer were significant when examining the raw fiber density matrices.
We found one connection with a significant age-by-sex interaction. The connection between the left insula and the left precentral gyrus existed in 84% of adolescents and 31% of adults and showed a sharper age-related decrease in proportional fiber density in females than in males (b = −0.0012, P = 2.8 × 10⁻⁶) (Fig. 3). This appeared to be due to a sex difference in adolescents that was no longer detectable in adults.
Discussion
Here, we examined how the structural connectivity of the insula changes between ages 12 and 30, in 307 subjects scanned with HARDI. The insula and its fibers develop relatively early [Benes, 1994; Chi et al., 1977; Huang et al., 2006], but have a protracted maturational period [Kalani et al., 2009; Hasan et al., 2009; Herting et al., 2012; Muftuler et al., 2011; Paus et al., 1999]. Both adults and adolescents show activation in the insula when anxious [Shah et al., 2009; Strawn et al., 2012]. Our prior study examining functional connectivity of the default mode network (DMN) in a different cohort found that the left insula was the only area of overlap between children and adults when self-reported anxiety during the resting-state scan was used as a regressor [Dennis et al., 2011].
Here we were able to determine a number of age-related effects on insular connectivity. These were largely decreases in fiber density for connections to or from the insula,1 as both the left and right insula showed a decrease in the proportion of fibers passing through them. These were in fact absolute decreases in the number of fibers tracked to or from the insula, as found by examining the raw fiber density matrices. The main exception was connections with the temporal cortex. This is consistent with prior studies finding age-related decreases in the volume of the insula bilaterally, albeit across a larger age range [20–95 years; Takahashi et al., 2011].
Out of 15 connections showing developmental effects, 11 showed significant decreases in proportional fiber density and 4 showed significant increases (Fig. 2). Decreases in fiber
1Unlike TMS and EEG, diffusion imaging can pick up a fiber connection, but not its direction. Both afferent and efferent connections are identified but not differentiated.
NIH-PA Author Manuscript
NIH-PA Author Manuscript
density with age could reflect synaptic pruning [Huttenlocher, 1979] or continued
myelination [Bartzokis et al., 2010]. All age-related increases in fiber density were found in the temporal cortex. One of these, upon examination of the raw fiber density matrices, switched directions. Of the five significant developmental effects in the temporal cortex, four were increases in fiber density, and one was a decrease in fiber density. Prior work has shown different developmental trajectories across the cortex [Sowell et al., 2003; Gogtay et al., 2004] and these results of more age-related increases in connections of the temporal cortex and decreases in connections of the frontal cortex are consistent with previous results found in a larger, overlapping cohort when the whole connectome was examined [Dennis et al., 2012]. The differences we found could be partly due to differences in the developmental trajectories of the frontal and temporal cortex and their connections. Giedd et al. [1999] found the temporal cortex had a later age of peak when measuring gray matter volume than other cortices. In Sowell et al. [2003], we found the gray matter density (GMD) of the superior frontal sulcus decreased from age 7 on, but the GMD of the superior temporal sulcus increased until age 30. Sowell et al. [2002] also found that the posterior-superior temporal and inferior parietal cortices increased the most in gray matter density between ages 7-30. The insula is one of the first cortical structures to develop [Chi et al., 1977], but it continues to mature throughout childhood, with continued cortical thinning across ages 6-10 [Muftuler et al., 2011]. Similarly, the limbic fibers are among the first to develop [Huang et al., 2006], but the afferent and efferent connections of the insula also continue to develop into adulthood. These include the uncinate fasciculus [Hasan et al., 2009; Kalani et al., 2009], internal capsule fibers, and the arcuate fasciculus [Paus et al., 1999]. Additionally, the white matter of the insula itself changes with age; as Herting et al. [2012], for example, found the FA of the right insula increased with pubertal status.
As the insular connections develop, so too do the roles the insula plays functionally. In trying to find differences in the brains of adolescents that may influence their risk-taking behavior, Van Leijenhorst et al. [2010] found that the anterior insula was more active during anticipation in adolescents than adults. Similarly, Smith et al. [2011] found age-related decreases in insula activation during a sustained attention task. It could be that the
maturation of this activity is due in part to the maturation of fibers connecting the insula and the frontal cortex, of which we found five significant age-related trends. As the frontal cortex controls many aspects of higher order cognition such as executive control, sustained attention, and risk analysis [Buchsbaum, 2004], maturation of these connections would likely affect the functional circuits involving both.
We found one connection that showed a significant age × sex interaction effect. The proportional fiber density of the connection between the left insula and the left precentral gyrus showed a steeper decline in females than in males (Fig. 3). Abe et al. [2010] found males had a steeper decline with age than females in the FA of the white matter of the left precentral gyrus, which is contrary to our finding, although we were concerned with the fiber density of this connection rather than its FA. We were examining a different age group, however - Abe et al. [2010] examined a cohort of 245 healthy subjects, aged 21-71. The fact that we could detect this connection in 84% of our young subjects and 31% of our adult subjects could either be due to an actual developmental change in the fiber density of this path, or could be due to it being traced more accurately in one sample than the other. As the
NIH-PA Author Manuscript
NIH-PA Author Manuscript
scan parameters for both samples were almost identical and data were analyzed in the same way, the first explanation is perhaps more likely. It remains to be seen whether these sex differences have any functional consequences, such as differences in vulnerability to insula-involved neuropsychiatric disorders, such as anxiety. An alternative explanation is non-proportional scaling of brain substructures relative to overall brain size [Brun et al., 2009]. Men generally have larger brains as they are, on average, larger overall. There is an implicit assumption in aligning data to a template, namely that brain structures in each sex occupy the same proportion relative to overall brain size. Even so, it is possible that substructures scale nonlinearly to total brain volume (TBV), rather than proportionally. For example, in a study of 100 young adults, Brun et al. [2009] found that the occipital cortex and the frontal cortex scaled nonlinearly, such that individuals with large TBVs tended to have
proportionally larger occipital cortices, while those with small TBVs tended to have proportionally larger frontal cortices.
The insula is involved in a wide variety of functions [Augustine, 1996; Craig, 2008] and has been implicated in a number of neuropsychiatric disorders [Etkin and Wager, 2007;
Hamilton et al., 2011; Kubicki et al., 2002; Stein et al., 2007; Uddin and Menon, 2009]. A number of the roles of the insula, such as pain perception and taste, are fairly basic and early to develop, but others, such as emotion and cognitive tasks, are higher order [Kurth et al., 2010; Wager and Barrett, 2004]. Given its many roles, researchers have proposed that the insula is an integrative structure, combining sensory awareness with higher cognition [Craig, 2008; Kurth et al., 2010]. Research on the functional connectivity of the insula suggests that it plays a key role in regulating network dynamics by switching the dominant pattern of brain activity between different intrinsic connectivity networks (ICNs) [Hamilton et al., 2011; Sridharan et al., 2008]. Given its purportedly unique role in integrating disparate functions, investigating the development of insular connectivity is important in understanding how the brain develops. The insular cortex develops quite early in utero, before the frontal and temporal cortices [Chi et al., 1977] yet its connections with other cortical targets are still changing throughout adolescence. A number of neuropsychiatric disorders involve the insula [Etkin and Wager, 2007; Hamilton et al., 2011; Kubicki et al., 2002; Stein et al., 2007; Uddin and Menon, 2009], and many of these disorders have a typical age of onset in adolescence or later. A number of neurodevelopmental disorders also involve the insula, including autism [Cheng et al., 2010] and ADHD [Durston, 2003]. Aberrant development of insular connectivity, still maturing into early adulthood, may be a contributing factor.
This study has several limitations. One of the issues with our study design is the sparse sampling of the ages due to the availability of subjects at specific ages (12 and 16) but not ages in between these. To address this, we followed up our initial analyses with
nonparametric permutation testing, which did not affect the conclusions, but did give permutation corrected P-values. While we discuss our subjects in terms of distinct age cohorts, we treated age as a continuous variable in our statistical analyses, and the adults had a wide range of variation. Nonetheless, there were some gaps in subject availability for specific ages (13-14, 17-19). We followed up our initial analyses with nonparametric permutation testing, which did not change the results, but did give permutation corrected
P-NIH-PA Author Manuscript
NIH-PA Author Manuscript
values. Another limitation is the fact that we did not parcellate the insula into sub-regions, which could have given us finer detail on insular connectivity, especially as prior studies show that it participates in multiple networks. The atlas we used (Desikan-Killiany) did not parcellate the insula further. At this time, there do not seem to be any widely used automated methods to parcellate the insula into smaller subregions, but they could be developed. However, if we included them here, we would be expected to validate them, and it would be difficult to find any independent data that could provide an objective criterion for ground truth to determine if the partition was correct. In the future, the insula might be subdivided effectively based on its connectivity to other regions. Some studies have advocated the use of connection patterns to refine segmentation of nuclei, but doing so is challenging as the large variation in connection patterns across subjects may require the development of complex rules to assign all insular regions to appropriate bundles. Obtaining even higher angular and spatial detail tends to lead to prohibitively long scan times. Ongoing efforts to refine and accelerate hybrid diffusion imaging [Zhan et al., 2011] and diffusion spectrum imaging [van Wedeen et al., 2012], especially at higher field strengths [Zhan et al., 2012c], may allow progressively finer resolution of anatomical connectivity in vivo.
Conclusions
In this study we detailed developmental changes in the structural connectivity of the insula between ages 12–30. We found that the proportion of fibers that pass through either insula decreases with age. In general, connections to the frontal and parietal cortex decreased with age, while connections to the temporal cortex mostly increased with age. This is likely due to both developmental changes in the insula itself and well-documented changes in the frontal, parietal, and temporal targets. Last, we found an age by sex interaction effect in the connectivity of the insula. It remains to be seen if this is associated with any differences in vulnerability to insula-involved neuropsychiatric disease or simply nonproportional scaling of brain sub-structures relative to the overall brain size [Brun et al., 2009]. With the insula's heterogeneous collection of roles—some of which are emotion-related—determining the developmental trajectory of the insula and its connections will provide useful normative data and assist efforts to define the mechanisms of various neurodevelopmental and
neuropsychiatric diseases.
Acknowledgments
Contract grant sponsor: National Institute of Child Health and Human Development; Contract grant number: R01 HD050735; Contract grant sponsor: National Health and Medical Research Council (NHMRC); Contract grant numbers: 486682, 1009064, 389875; Contract grant sponsor: NIH R01; Contract grant numbers: EB008432, EB008281, EB007813, P41 RR013642; Contract grant sponsor: NIH Training Grant in Neurobehavioral Genetics; Contract grant number: T32MH073526-06.
References
Abe O, Yamasue H, Yamada H, Masutani Y, Kabasawa H, Sasaki H, Takei K, Suga M, Kasai K, Aoki S, Ohtomo K. Sex dimorphism in gray/white matter volume and diffusion tensor during normal aging. NMR Biomed. 2010; 23:446–458. [PubMed: 20310078]
Aganj I, Lenglet C, Sapiro G, Yacoub E, Ugurbil K, Harel N. Reconstruction of the orientation distribution function in single- and multiple-shell q-ball imaging within constant solid angle. Magn Resonance Med. 2010; 64:554–566.
NIH-PA Author Manuscript
NIH-PA Author Manuscript
Aganj I, Lenglet C, Jahanshad N, Yacoub E, Harel N, Thompson PM, Sapiro G. A Hough transform global probabilistic approach to multiple-subject diffusion MRI tractography. Med Image Analysis. 2011; 15:414–425.
Angevine JB Jr, Locke S, Yakovlev PI. Limbic nuclei of thalamus and connections of limbic cortex. Arch Neurol. 1962; 7:518–528. [PubMed: 14013175]
Annett M. A classification of hand preference by association analysis. Br J Psychol. 1970; 61:303– 321. [PubMed: 5457503]
Augustine JR. Circuitry and functional aspects of the insular lobe in primates including humans. Brain Res Rev. 1996; 22:229–244. [PubMed: 8957561]
Bartzokis G, Lu PH, Tingus K, Mendez MF, Richard A, Peters DG, Oluwadara B, et al. Lifespan trajectory of myelin integrity and maximum motor speed. Neurobiol Aging. 2010; 31:1554–1562. [PubMed: 18926601]
Benes, FM. Development of the corticolimbic system. In: Dawson, G.; Fischer, KW., editors. Human Behavior and the Developing Brain. New York: Guilford Press; 1994.
Benjamini Y, Hochberg Y. Controlling the false discovery rate: A practical and powerful approach to multiple testing. J Royal Stat Soc Series B. 1995; 57:289–300.
Brun CC, Lepore N, Luders E, Chou YY, Madsen SK, Toga AW, Thompson PM. Sex differences in brain structure in auditory and cingulate regions. NeuroReport. 2009; 20:930–935. [PubMed: 19562831]
Buchsbaum MS. Frontal cortex function. Am J Psychiatry. 2004; 161:2178. [PubMed: 15569885] Buckner RL, Andrews-Hanna JR, Schacter DL. The brain's default network: Anatomy, function, and
relevance to disease. Annals NY Acad Sci. 2008; 1124:1–38.
Cauda F, D'agata F, Sacco K, Duca S, Geminiani G, Vercelli A. Functional connectivity of the insula in the resting brain. NeuroImage. 2011; 55:8–23. [PubMed: 21111053]
Cerliani L, Thomas RM, Jbabdi S, Siero JCW, Nanetti L, Crippa A, Gazzola V, D'Arceuil H, Keysers C. Probabilistic tractography recovers a rostrocaudal trajectory of connectivity variability in the human insular cortex. Hum Brain Mapp. 2011; 33:2005–2034. [PubMed: 21761507]
Cheng Y, Chou KH, Chen IY, Fan YT, Decety J, Lin CP. Atypical development of white matter microstructure in adolescents with autism spectrum disorders. NeuroImage. 2010; 50:873–882. [PubMed: 20074650]
Chi JG, Dooling EC, Gilles FH. Gyral development of the human brain. Ann Neurol. 1977; 1:86–93. [PubMed: 560818]
Cloutman LL, Binney RJ, Drakesmith M, Parker GJM, Lambon Ralph MA. The variation of function across the human insula mirrors its patterns of structural connectivity: Evidence from in vivo probabilistic tractography. NeuroImage. 2012; 59:3514–3521. [PubMed: 22100771]
Craig, AD. Interoception and emotion: A neuroanatomical perspective. In: Lewis, M.; Haviland-Jones, JM.; Barrett, LF., editors. Handbook of Emotions. 3rd. New York: Guilford Publications; 2008. p. 272-288.
de Zubicaray GI, Chiang MC, McMahon KL, Shattuck DV, Toga AW, Martin NG, Wright MJ, Thompson PM. Meeting the challenges of neuroimaging genetics. Brain Imaging Behav. 2008; 2:258–263. [PubMed: 20016769]
Dennis EL, Gotlib IH, Thompson PM, Thomason ME. Anxiety modulates insula recruitment in resting-state functional magnetic resonance imaging in youth and adults. Brain Connectivity. 2011; 1:245–254. [PubMed: 22433052]
Dennis EL, Jahanshad N, Mcmahon KL, de Zubicaray GI, Martin NG, Hickie IB, Toga AW, Wright MJ, Thompson PM. Development of brain structural connectivity between ages 12 and 30: A 4-Tesla diffusion imaging study in 439 adolescents and adults. NeuroImage. 64:671–684. [PubMed: 22982357]
Desikan RS, Ségonne F, Fischl B, Quinn BT, Dickerson BC, Blacker D, Buckner RL, Dale AM, Maguire RP, Hyman BT, Albert MS, Killiany RJ. An automated labeling system for subdividing the human cerebral cortex on MRI scans into gyral based regions of interest. NeuroImage. 2006; 31:968–980. [PubMed: 16530430]
Durston S. A review of the biological bases of ADHD: What have we learned from the imaging studies? Ment Retard Dev D R. 2003; 9:184–195.
NIH-PA Author Manuscript
NIH-PA Author Manuscript
Etkin A, Wager TD. Functional neuroimaging of anxiety: A meta-analysis of emotional processing in PTSD, social anxiety disorder, and specific phobia. Am J Psychiatry. 2007; 164:1476–1488. [PubMed: 17898336]
Fransson P. Spontaneous low-frequency BOLD signal fluctuations: An fMRI investigation of the resting-state default mode of brain function hypothesis. Hum Brain Mapp. 2005; 26:15–29. [PubMed: 15852468]
Giedd JN, Blumenthal J, Jeffries NO, Castellanos FX, Liu H, Zijdenbos A, Paus T, Evans AC, Rapoport JL. Brain development during childhood and adolescence: A longitudinal MRI study. Nat Neurosci. 1999; 2:861–863. [PubMed: 10491603]
Gogtay N, Giedd JN, Lusk L, Hayashi KM, Greenstein D, Vaituzis AC, Nugent TF III, Herman DH, Clasen LS, Toga AW, Rapoport JL, Thompson PM. Dynamic mapping of human cortical development during childhood through early adulthood. Proc Natl Acad Sci USA. 2004; 101:8174–8179. [PubMed: 15148381]
Gusnard D, Raichle M. Searching for a baseline: Functional imaging and the resting human brain. Nat Rev Neurosci. 2001; 2:1–10.
Hamilton J, Furman D, Chang C, Thomason ME, Dennis E, Gotlib IH. Default-mode and task-positive network activity in major depressive disorder: Implications for adaptive and mal-adaptive rumination. Biol Psychiatry. 2011; 70:327–333. [PubMed: 21459364]
Hasan KM, Iftikhar A, Kamali A, Kramer LA, Ashtari M, Cirino PT, Papanicolaou AC, Fletcher JM, Ewing-Cobbs L. Development and aging of the healthy human brain uncinate fasciculus across the lifespan using diffusion tensor tractography. Brain Res. 2009; 1276:67–76. [PubMed: 19393229] Herting MM, Maxwell EC, Irvine C, Nagel BJ. The impact of sex, puberty, and hormones on white
matter microstructure in adolescents. Cerebral Cortex. 2012; 22:1979–1992. [PubMed: 22002939] Holmes CJ, Hoge R, Collins L, Woods R, Toga AW, Evans AC. Enhancement of MR images using
registration for signal averaging. J Computer Assisted Tomography. 1998; 22:324–333. Huang H, Zhang J, Wakana S, Zhang W, Ren T, Richards LJ, Yarowsky P, Donohue P, Graham E,
van Zijl PCM, Mori S. White and gray matter development in human fetal, newborn, and pediatric brains. NeuroImage. 2006; 33:27–38. [PubMed: 16905335]
Huttenlocher P. Synaptic density in the human frontal cortex—Developmental changes and effects of aging. Brain Res. 1979; 163:195–205. [PubMed: 427544]
Iglesias JE, Liu CY, Thompson PM, Tu Z. Robust brain extraction across datasets and comparison with publicly available methods. IEEE Transact Medical Imaging. 2011; 30:1617–1634.
Jahanshad, N.; Aganj, I.; Lenglet, C.; Joshi, A.; Jin, Y.; Barysheva, M.; McMahon, KL.; de Zubicaray, GI.; Martin, NG.; Wright, MJ.; Toga, AW.; Sapiro, G.; Thompson, PM. Sex differences in the human connectome: 4-tesla high angular resolution diffusion imaging (HARDI) tractography in 234 young adult twins. In Proc. 8th IEEE ISBI; Chicago. 2011. p. 939-943.
Kalani MYS, Kalani MA, Gwinn R, Keogh B, Tse VCK. Embryological development of the human insula and its implications for the spread and the resection of insular gliomas. J Neurosurg. 2009; 27:1–6.
Klinger J, Gloor P. The connections of the amygdala and of the anterior temporal cortex in the human brain. J Comp Neurol. 1960; 115:333–369. [PubMed: 13756891]
Kubicki M, Shenton ME, Salisbury DF, Hirayasu Y, Kasai K, Kikinis R, Jolesz FA, McCarley RW. Voxel-based morphometric analysis of gray matter in first episode schizophrenia. NeuroImage. 2002; 17:1711–1719. [PubMed: 12498745]
Kurth F, Zilles K, Fox PT, Laird AR, Eickhoff SB. A link between the systems: Functional differentiation and integration within the human insula revealed by meta-analysis. Brain Struct Funct. 2010; 214(5–6):519–534. [PubMed: 20512376]
Le Gros Clark WE, Russell WR. Observations on the efferent connexions of the centre median nucleus. J Anat. 1939; 73:255–263. [PubMed: 17104755]
Leow A, Huang S, Geng A, Becker J, Davis S, Toga A, Thompson P. Inverse consistent mapping in 3D deformable image registration: Its construction and statistical properties. Proc Med Imaging. 2005; 3565:23–57.
Mega MS, Cummings J, Salloway S, Malloy P. The limbic system: An anatomic, phylogenetic, and clinical perspective. Anatomy Neurochem. 1997; 9:315–330.
NIH-PA Author Manuscript
NIH-PA Author Manuscript
Menon V, Uddin LQ. Saliency, switching, attention and control: A network model of insula function. Brain Struct Funct. 2010; 214(5–6):655–667. [PubMed: 20512370]
Mesulam MM, Mufson EJ. Insula of the Old World Monkey. I. Architectonics in the insulo-orbito-temporal component of the paralimbic brain. J Compar Neurol. 1982; 212:1–22.
Muftuler LT, Davis EP, Buss C, Head K, Hasso AN, Sandman CA. Cortical and subcortical changes in typically developing preadolescent children. Brain Res. 2011; 1399:15–24. [PubMed: 21640983] Paus TSAA, Zijdenbos A, Worsley K, Collins DL, Blumenthal J, Giedd JN, Rapoport JL, Evans AC.
Structural maturation of neural pathways in children and adolescents: In vivo study. Science. 1999; 283:1908–1911. [PubMed: 10082463]
Pinheiro, JC.; Bates, DM. Mixed-Effects Models in S and S-PLUS. Springer; New York: 2000. Seeley WW, Menon V, Schatzberg AF, Keller J, Glover GH, Kenna H, Reiss AL, Greicius MD.
Dissociable intrinsic connectivity networks for salience processing and executive control. J Neurosci. 2007; 27:2349–2356. [PubMed: 17329432]
Shah SG, Klumpp H, Angstadt M, Nathan PJ, Phan KL. Amygdala and insula response to emotional images in patients with generalized social anxiety disorder. J Psychiatry Neurosci. 2009; 34:296– 302. [PubMed: 19568481]
Smyth GK, Phipson B. Permutation p-values should never be zero: Calculating exact p-values when permutations are randomly drawn. Stat Appl Gene Mol Biol. 2010; 9:1–12.
Sowell ER, Peterson BS, Thompson PM, Welcome SE, Henkenius AL, Toga AW. Mapping cortical change across the human life span. Nat Neurosci. 2003; 6:309–315. [PubMed: 12548289] Sowell ER, Thompson PM, Rex D, Kornsand D, Tessner KD, Jernigan TL, Toga AW. Mapping sulcal
pattern asymmetry and local cortical surface gray matter distribution in vivo: Maturation in perisylvian cortices. Cerebral Cortex. 2002; 12:17–26. [PubMed: 11734529]
Sridharan D, Levitin DJ, Menon V. A critical role for the right fronto-insular cortex in switching between central-executive and default-mode networks. Proc Natl Acad Sci USA. 2008; 105:12569–12574. [PubMed: 18723676]
Stein MB, Simmons AN, Feinstein JS, Paulus MP. Increased amygdala and insula activation during emotion processing in anxiety-prone subjects. Am J Psychiatry. 2007; 164:318–327. [PubMed: 17267796]
Strawn JR, Wehry AM, DelBello MP, Rynn MA, Strakowski S. Establishing the neurobiologic basis of treatment in children and adolescents with generalized anxiety disorder. Depression Anxiety. 2012; 29:328–339. [PubMed: 22511364]
Takahashi R, Ishii K, Kakigi T, Yokoyama K. Gender and age difference in normal adult human brain: Voxel-based morphometric study. Hum Brain Mapp. 2011; 32:1050–1058. [PubMed: 20607753] Uddin L, Supekar K, Amin H. Dissociable connectivity within human angular gyrus and intraparietal
sulcus: Evidence from functional and structural connectivity. Cerebral Cortex. 2010; 20:2636– 2646. [PubMed: 20154013]
Van den Heuvel MP, Stam CJ, Kahn RS, Hulshoff Pol HE. Efficiency of functional brain networks and intellectual performance. J Neurosci. 2009; 29:7619–7624. [PubMed: 19515930]
Wager T, Barrett L. From affect to control: Functional specialization of the insula in motivation and regulation. Psychextra online. 2004:1–23.
Wedeen VJ, Rosene DL, Wang R, Dai G, Mortazavi F, Hagmann P, Kaas JH, Tseng WYI. The geometric structure of the brain fiber pathways. Science. 2012; 335:1628–1634. [PubMed: 22461612]
Yakovlev PI, Locke S, Koskoff DY, Patton RA. Limbic nuclei of the thalamus and connections of the limbic cortex. I. Organization of the projections of the anterior group of nuclei and of the midline nuclei of the thalamus to the anterior cingulate gyrus and hippocampal rudiment in the monkey. Arch Neurol. 1960; 3:620–641. [PubMed: 13787071]
Zhan, L.; Chiang, MC.; Barysheva, M.; Toga, AW.; McMahon, KL.; de Zubicaray, GI.; Meredith, M.; Wright, MJ.; Thompson, PM. Workshop on Diffusion Tensor Imaging, Medical Image Computing and Computer Assisted Intervention (MICCAI). New York: 2008 Sep 10. How Many Gradients are Sufficient in High-Angular Resolution Diffusion Imaging (HARDI)?. 2008
NIH-PA Author Manuscript
NIH-PA Author Manuscript
Zhan L, Leow AD, Chiang MC, Barysheva M, Lee AD, Toga AW, McMahon KL, de Zubicaray GI, Wright MJ, Thompson PM. How does angular resolution affect diffusion imaging measures? NeuroImage. 2009a 2009.
Zhan, L.; Leow, AD.; Barysheva, M.; Feng, A.; Toga, AW.; Sapiro, G.; Harel, N.; Lim, KO.; Lenglet, C.; McMahon, KL.; de Zubicaray, GI.; Wright, MJ.; Thompson, PM. Investigating the uncertainty in multi-fiber estimation in High Angular Resolution Diffusion Imaging. In: Pohl, Kilian; Joshi, Sarang; Wells, Sandy, editors. Workshop on Probabilistic Modeling in Medical Image Analysis (PMMIA), Medical Image Computing and Computer Assisted Intervention (MICCAI). London: 2009b Sep 20. 2009
Zhan, L.; Leow, AD.; Zhu, S.; Chiang, MC.; Barysheva, M.; Toga, AW.; McMahon, KL.; de Zubicaray, GI.; Wright, MJ.; Thompson, PM. Analyzing Multi-Fiber Reconstruction in High Angular Resolution Diffusion Imaging using the Tensor Distribution Function. In Proc. 6th IEEE ISBI; Boston. 2009c. p. 1402-1405.
Zhan, L.; Leow, AD.; Aganj, I.; Lenglet, C.; Sapiro, G.; Yacoub, E.; Harel, N.; Toga, AW.;
Thompson, PM. Differential information content in staggered multiple shell HARDI measured by the tensor distribution function. In Proc. 8th IEEE ISBI; Chicago. 2011. p. 305-309.
Zhan, L.; Franc, D.; Patel, V.; Jahanshad, N.; Yan, Jin; Mueller, BA.; Bernstein, MA.; Borowski, BJ.; Jack, CR., Jr; Toga, AW.; Lim, KO.; Thompson, PM. How do spatial and angular resolution affect brain connectivity maps from diffusion MRI?. In Proc. 9th IEEE ISBI; Barcelona. 2012a. p. 1-4. Zhan L, Jahanshad N, Ennis DB, Bernstein MA, Borowski BJ, Jack CR Jr, Toga AW, Leow AD,
Thompson PM. Angular versus spatial resolution trade-offs for diffusion imaging under time constraints. Hum Brain Mapp. 2012b Epub ahead of print. 10.1002/hbm.22094
Zhan L, Mueller BA, Jahanshad N, Jin Y, Lenglet C, Yacoub E, Sapiro G, Ugurbil K, Harel N, Toga AW, Lim KO, Thompson PM. MR field strength effects on diffusion measures and brain connectivity networks. 2012c in press.
NIH-PA Author Manuscript
NIH-PA Author Manuscript
Figure 1.
Connections of the insula discovered by previous researchers. Connections in blue have been identified with diffusion-weighted imaging [Cerliani et al., 2011; Cloutman et al., 2012]. Those in red are known through either tract tracing [Augustine, 1996] or gross dissection [Angevine et al., 1962; Le Gros Clark et al., 1939; Klinger and Gloor, 1960; Yakovlev et al., 1960]. Arrowheads convey directionality of the connection; where there is no arrowhead, no directional information was known.
NIH-PA Author Manuscript
NIH-PA Author Manuscript
Figure 2.
Summary figure of age-related effects in proportional fiber density between left and right insula and other nodes. Connections shown are those from Table II. Nodes are numbered as indicated in the figure. The two largest nodes are the left and right insula. Paths in blue decreased in density across development, those in red increased in density across development. A legend is included below. *Indicates connection that was suggestively significant with initial parametric model, but passed FDR after nonparametric tests. In the center image, left in the image is left in the brain.
NIH-PA Author Manuscript
NIH-PA Author Manuscript
Figure 3.
Scatter plot showing the age by sex (male = 1, female = 2) interaction in the proportional fiber density of the connection between the left insula and the left precentral gyrus,
indicating steeper decline with age in girls; includes image with precentral gyrus in blue and insula in green. Values for proportional fiber density are normalized by ICV (intracranial volume). A value of “0” does not necessarily indicate absence of that connection. Most likely, it indicates that we are unable to trace that connection in those subjects, perhaps because other fibers predominate, making it harder to resolve.
NIH-PA Author Manuscript
NIH-PA Author Manuscript
NIH-PA Author Manuscript
NIH-PA Author Manuscript
NIH-PA Author Manuscript
Table I
Demographic information listing the number of subjects in each age group, sex breakdown, and zygosity breakdown
N
M/F
MZ
DZ
SIB
Adults (20–30 yo)
240
90/150
93
123
24
16 yo
37
16/21
9
28
0
12 yo
30
16/14
7
23
0
NIH-PA Author Manuscript
NIH-PA Author Manuscript
NIH-PA Author Manuscript
Table II
Linear age effects on insular connectivity, when analyses were restricted to connections detectable in at least 75% of subjects in at least one of the two groups (adults and/or children)
Linear age effects
perm. corr. P value Left Insula
b P
Left postcentral −0.0011 4.9 × 10⁻⁸ 0.0010
Left precentral −0.0012 3.6 × 10⁻¹² 0.0010
Left pars opercularisa −0.00062 0.035 0.035
Left temporal pole −0.0020 4.2 × 10⁻⁶ 0.0010
Left superior temporal 0.0041 0.0054 0.0030
Left supramarginal −0.0020 1.1 × 10⁻⁵ 0.0020
Left transverse temporal 0.0039 1.4 × 10⁻⁹ 0.0010
Right Insula
Right postcentral −0.0013 0.0047 0.011
Right precentral −0.0018 0.00031 0.0020
Right inferior temporal 0.0019 0.00050 0.0010
Right medial orbitofrontal −0.0011 7.0 × 10⁻¹² 0.0010
Right pars opercularis −0.0026 0.0020 0.0040
Right pars triangularis −0.0035 2.0 × 10⁻⁶ 0.0010
Right superior temporal 0.0041 0.0098 0.015
Right supramarginal −0.0036 5.8 × 10⁻⁵ 0.0010
a