SECTION 2: MEASUREMENT
Structure and Performance of Different DRG Classification Systems for
Neonatal Medicine
John H. Muldoon, MHA
ABSTRACT. There are a number of Diagnosis-Related Group (DRG) classification systems that have evolved over the past 2 decades, each with their own strengths and weaknesses. DRG systems are used for case-mix trending, utilization management and quality improve-ment, comparative reporting, prospective payimprove-ment, and price negotiations. For any of these applications it is essential to know the accuracy with which the DRG system classifies patients, specifically for predicting re-source use and also mortality.
The objective of this study was to assess the adequacy of the three most commonly used DRG systems for neo-natal patients—Medicare DRGs, All Patient Diagnosis-Related Groups (AP-DRGs), and All Patient Refined Diagnosis-Related Groups (APR-DRGs). A 2-part meth-odology is used to assess adequacy. The first part is a descriptive analysis that examines the structural charac-teristics of each system. This provides a framework for understanding the inherent strengths and weaknesses of each system and for interpreting their statistical mance. The second part examines the statistical perfor-mance of each system on a large nationally representative hospital database.
The analysis identifies major differences in the struc-ture and statistical performance of the three DRG sys-tems for neonates. The Medicare DRGs are structurally the least developed and yield the poorest overall statis-tical performance (cost R250.292; mortality R250.083).
The APR-DRGs are structurally the most developed and yield the best statistical performance (cost R2 5 0.627;
mortality R250.416). The AP-DRGs are intermediate to
Medicare DRGs and DRGs, although closer to APR-DRGs (cost R250.507; mortality R250.304).
An analysis of payment impacts and systematic effects identifies there are major systematic biases with the Medicare DRGs. At the patient level, there is substantial underpayment for surgical neonates, transferred-in neo-nates, neonates discharged to home health services, and neonates who die. In contrast, there is substantial over-payment for normal newborns. At the facility level, there is substantial underpayment for freestanding acute chil-dren’s hospitals and major teaching general hospitals. There is overpayment for other urban general hospitals but this pattern varies by hospital size. There is very substantial overpayment for other rural hospitals. The AP-DRGs remove the majority of the systematic effects
but significant biases remain. The APR-DRGs remove most of the systematic effects but some biases remain. Pediatrics 1999;103:302–318; All Patient Diagnosis-Re-lated Groups, All Patient Refined Diagnosis-ReDiagnosis-Re-lated Groups administrative data, case-mix, Diagnosis-Related Groups, hospital discharge data, ICD-9-CM diagnosis and procedure codes, Medicare DRGs, mortality, neonatal in-tensive care units, neonatal medicine, neonates, perinatal medicine, prospective payment system, regionalization, and utilization management.
ABBREVIATIONS. DRG, Diagnosis-Related Group; UB, uniform bill; LOS, length of stay; PPS, prospective payment system; HCFA, Health Care Financing Administration; NACHRI, National Asso-ciation of Children’s Hospital and Related Institutions; PM-DRG, Pediatric Modified Diagnosis-Releated Group; MDC, major diag-nostic category; AP-DRG, All Patient Diagnosis-Related Group; CC, comorbid-complicating condition; RDRG, Refined Diagnosis-Related Group; SR-DRG, Severity Refined Diagnosis-Diagnosis-Related Group; APR-DRG, All Patient Refined Diagnosis-Related Group; OR, operating room; UHDDS, Uniform Hospital Discharge Data Set; RCC, ratio of costs-to-charges; GME, graduate medical edu-cation.
D
iagnosis-Related Groups (DRGs) are a type of classification system for acute inpatient hos-pital care whose purpose is to group together patients who are similar clinically and who have a similar pattern of resource use. They are developed from diagnostic, procedure, and demographic infor-mation routinely available from a hospital inpatient medical record abstract or uniform bill (UB)-92 bill-ing form. There are a variety of DRG classification systems that have evolved over the past 2 decades each with their own strengths and weaknesses.DRG classification systems are used for a number of applications including: case-mix trending, utiliza-tion management and quality improvement by hos-pitals and physicians, comparative reporting by data commissions and hospital groups, prospective pay-ment by governpay-ment agencies, and price negotia-tions between hospitals and payors. For any of these applications it is essential to know the accuracy with which the DRG system can predict resource use and also mortality if an intended application.
It was the objective of this article to assess the adequacy of the three most commonly used DRG systems for neonatal patients. A 2-part methodology is used to assess adequacy. The first part is a descrip-tive analysis that examines the structural character-istics of each system. This provides a framework for understanding the inherent strengths and weak-From the National Association of Children’s Hospitals and Related
Institu-tions, Alexandria, Virginia.
Received for publication Sep 9, 1998; accepted Sep 9, 1998.
Address correspondence to John H. Muldoon, MHA, National Association of Children’s Hospitals and Related Institutions, 401 Wythe St, Alexandria, VA 22314.
nesses of each system and for interpreting the statis-tical performance of each system.
The second part of the methodology examines the statistical performance of each system. This is done in two ways. First, the overall predictive power of each DRG system for resource use and mortality is measured through explanation of variance statistics. Second, payment impacts and systemic effects are measured at the patient level as defined by various patient attributes and at the hospital level as defined by overall results for various groupings of hospitals. To assist with interpretation, the results by hospital type are linked back to the results by patient type.
This article is organized into seven sections. The first, “Evolution of DRG Classification Systems,” ex-plains how DRG systems have evolved since the late 1970s with an emphasis on the different approaches to severity adjustment within a DRG category. The second, “Data Elements for DRG Classification Sys-tems,” describes the data elements, their source, and some of their strengths and limitations. The third, “Comparison of Structural Characteristics of DRG Classification Systems,” provides a summary de-scription and a detailed technical dede-scription of each system. The fourth, “Database for Comparative Analysis of DRG Classification Systems,” explains the representativeness of hospitals in the study sam-ple frame, the source of the data, and strengths and weaknesses of the available measures for resource consumption. The fifth, “Explanation of Variance (R2) for Resource Use and Mortality,” presents the overall explanatory power of each DRG system for predicting cost, length of stay (LOS), and mortality. The sixth, “Payment Impacts and Systematic Effects by Patient Type and Hospital Type,” presents results for a detailed series of payment simulations for each DRG system. The seventh, “Conclusion,” presents the overall conclusions from the study.
EVOLUTION OF DRG CLASSIFICATION SYSTEMS The design and development of DRGs began in the late 1960s at Yale University. The initial motivation was to create an effective framework for monitoring the utilization of services in a hospital setting. The first large-scale application of DRGs was conducted in the late 1970s by the State of New Jersey in its hospital prospective payment system (PPS). In 1984, a DRG-based PPS was implemented for the Medicare program. Subsequently, a number of states and large payors implemented DRG-based PPS for non-Medi-care patients. In addition, DRGs have been used as the basis for global budget allocation and payment in several countries in Western and Eastern Europe as well as Australia.1
The initial DRG system developed by Yale was intended to describe all types of patients seen in an acute care hospital. There was an inherent problem, however, in that the database used for its develop-ment attempted to be representative of a cross sec-tion of community hospitals. This ensured there would not be sufficient case volume of complex low-volume pediatric and neonatal conditions to detect certain problems or to develop solutions. Of note,
freestanding acute children’s hospitals were not in-cluded in the Yale study database.2
The updating of the DRG system used for Medi-care PPS in the 1980s and 1990s has been done by the US Health Care Financing Administration (HCFA). The database used to evaluate potential updates has been a Medicare patient only database and the focus has been on problems related to the elderly and other Medicare recipients. So, the shortcomings of the orig-inal DRGs for pediatric and neonatal patients have never been addressed by the Medicare DRGs. HCFA acknowledged in its annual rulemaking process in August 1991 that its DRG research was designed to develop improvements for the Medicare population and it should not be assumed that the Medicare DRGs are appropriate for other patient populations. Nevertheless, many state Medicaid programs, Blue Cross plans, and other payors have used the Medi-care DRGs to classify newborns, children and non-elderly adults for hospital payment purposes.3
A first attempt to systematically evaluate the Medicare DRG system and develop refinements for children took place from 1984 to 1986 in a study entitled “Children’s Hospital Case-Mix Classification Study Project,” funded by the National Association of Children’s Hospital and Related Institutions (NACHRI), the HCFA, and The Pew Memorial Trust. This led to follow-on work by NACHRI and the release of the Pediatric Modified Diagnosis-Releated Groups (PM-DRGs) in 1988. The PM-DRGs con-tained an extensive set of modifications to the Medi-care DRGs for pediatric patients and a whole new structure for major diagnostic category (MDC) 15, the primary diagnostic category for neonatal pa-tients.4(Note: an MDC is a body system or major disease
process. There are 25 MDCs in most DRG systems). Part of the pediatric and neonatal modifications of the PM-DRGs were incorporated into the All Patient Diagnosis-Related Groups (AP-DRGs) adopted by the New York State Health Department in 1988. The AP-DRG system also introduced other new catego-ries applicable to patients of all ages, including a new MDC for patients with multiple significant traumas and a new MDC for patients with human immuno-deficiency virus. The AP-DRGs have been used for prospective payment by several state agencies, Blue Cross plans and other payors. The US Department of Defense has also incorporated the neonatal defini-tions of the initial AP-DRGs into its DRG-based PPS for the Civilian Health and Medical Program of the Uniformed Services.5
The initial generation of DRG systems provided only modest differentiation for severity within a DRG category. Certain of the DRG categories were split into two categories based on the presence or absence of a secondary diagnosis from a list of co-morbid-complicating (CC) conditions that included approximately 3000 of the 12 0001International Clas-sification of Diseases, 9th Revision Clinical Modification
The effort to develop a more advanced severity ad-justment methodology began in the mid-to-late 1980s when HCFA funded a 2-year study project by Yale University. This project produced the first “Refined” Diagnosis-Related Group (RDRG) system, which is a DRG system with multiple CC (or severity) levels within each DRG category. Nearly all the DRG catego-ries were given either three or four severity subclasses (mild, moderate, major, extreme) based on the presence of certain secondary diagnoses.7
The AP-DRGs implemented by New York State in 1988 designated a subset of secondary diagnoses as major CCs. These diagnoses were similar to those classified as catastrophic by the initial RDRGs. To avoid significantly increasing the number of AP-DRG categories, AP-AP-DRG major CC categories were formed for groups of surgical AP-DRGs and medical AP-DRGs in a body system.8
In 1993 HCFA funded another 2-year study project to develop a severity adjustment methodology for the Medicare DRGs. The study, which was conducted by 3M Health Information Systems, produced a system at the end of 1994 entitled “Severity Refined” DRGs (SR-DRGs). This system was developed using Medicare patient data only and excluded DRGs associated with pregnancy, newborns, and pediatric patients. Major CC subclasses were developed for many of the DRG cate-gories. As of June 1998, HCFA had not announced plans to implement the DRGs, nor have the SR-DRGs been updated since 1994.9
The severity-adjusted version of DRGs that has come into widest acceptance and use in the 1990s is the All Patient Refined DRGs (APR-DRGs), first in-troduced in 1991. As of June 1998, there were.1400 hospitals and other organizations using the APR-DRGs. This included 17 state health departments and data commissions using the APR-DRGs for compar-ative profiling of hospitals. The 17 states are identi-fied in Table 1. One of the first and most extensive hospital profiling reports produced by a state agency was the1996 Guide to Hospitals in Florida.10
The APR-DRGs are developed and updated through the combined research activities of 3M Health Information Systems and the NACHRI. The
APR-DRGs are different from other DRG systems in a number of respects including: 1) definitions for DRG categories; 2) revisions to surgical hierarchies; 3) updates to diagnoses on the CC list; 4) assignment of all diagnoses to one of four CC (or severity) levels; 5) severity subclass algorithm that takes into account the interactive effect of multiple secondary diag-noses; 6) a severity subclass methodology specifically developed for neonatal patients; and 7) a separate subclass methodology for risk of mortality.11
DATA ELEMENTS FOR DRG CLASSIFICATION SYSTEMS
There are six data elements that are the building blocks for all these DRG classification systems. They are the same for each system.
• principal diagnosis • secondary diagnoses
• operating room (OR) and non-OR procedures • age (derived from date of birth and admission
date) • sex
• discharge disposition
These data elements come from or are derived from the Uniform Hospital Discharge Data Set (UHDDS), which defines the core data set for all hospital inpatient medical record abstracting sys-tems. The UHDDS data elements are part of the UB-92 (Uniform Bill 1992), the required electronic billing format for a hospital to submit a bill to a payor. The UHDDS and the UB-92 bill are both con-sidered administrative data sets as they are used for the billing of health care services. They are also called secondary data sets because they are gener-ated as a by-product of a nonresearch activity. They contain a great deal of demographic, diagnostic, and treatment information and so can be used for a num-ber of clinical as well as financial applications.12
The other data elements that are part of the UHDDS are: hospital identifier, patient identifier, date of birth, race, residence (ZIP code), admission date, discharge date, attending physician identifier, surgeon identifier, procedures with dates, and ex-pected source of payment. These additional vari-ables, while not used to group patients into DRG categories, can be used as part of DRG-based analy-ses. For example, data variables such as race and expected payment source (eg, Medicaid, self-pay) can be used to further describe patient attributes.
Of note, birth weight is not a UHDDS data element and there is no field on UB-92 for birth weight. However, birth weight range information can be ob-tained from the fifth digit of the ICD-9-CM prema-turity diagnosis codes. The birth weight ranges are:
,500 g, 500 to 749 g, 750 to 999 g, 1000 to 1249 g, 1250 to 1499 g, 1500 to 1749 g, 1750 to 1999 g, 2000 to 2499 g, .2499 g, and unspecified. In addition, if a hospital medical record abstract system is designed with a separate field for birth weight the software for both AP-DRGs and APR-DRGs is programmed to read birth weight as a separate variable.
The UHDDS diagnosis and procedure codes are both from the ICD-9-CM.13As of October 1997, there TABLE 1. State Agencies With APR-DRG Software Licenses
1. Arizona Department of Health Services 2. California Office of State Health Planning
and Development
3. Delaware Bureau of Health Planning
4. Florida Agency for Health Care Administration 5. Hawaii Health Information Corporation 6. Indiana Department of Health
7. Iowa Health Data Commission
8. Maryland Health Services Cost Review Commission 9. New Mexico Health Policy Commission
10. Ohio Office of Medicaid Policy and Planning 11. Oklahoma Health Care Authority
12a. South Carolina State Budget and Control Board 12b. South Carolina Workman’s Compensation 13. Tennessee Department of Health
14. Texas Health Care Information Council 15. Utah Department of Health
16. Virginia Health Information
17. Wisconsin Office of Health Care Information
were 12 766 valid diagnosis codes and 3560 valid procedure codes. At some point, possibly in the year 2001, the United States will probably convert from ICD-9-CM to ICD-10-CM. Some European countries have already implemented ICD-10. The DRG sys-tems will at that time be converted to read the ICD-10-CM codes. The draft version of ICD-ICD-10-CM has many more codes with more specificity than ICD-9-CM and thus will present an opportunity to intro-duce further improvements to the existing DRG sys-tems.
The predictive power and clinical utility of a DRG classification system is limited or empowered to a large extent by the precision of the available diagno-sis and procedure codes. The ICD-9-CM coding sys-tem is often criticized for lacking sufficient specificity and although this is true to a certain extent, there is also a wealth of information among the many thou-sands of ICD-9-CM codes. There is also a set of
Official ICD-9-CM Guidelines for Coding and Reporting
developed by the American Hospital Association, American Health Information Management Associa-tion, HCFA, and the National Center for Health Sta-tistics and an established process through the ICD-9-CM Coordination and Maintenance Committee to update the codes annually. Thus, there is the oppor-tunity that many physicians and other pediatric health professionals might not be aware of to de-velop proposed reformulations for individual diag-nosis and procedure codes. To illustrate, this is how the fifth digit code for birth weight range was added to the prematurity diagnosis codes.14
In addition to the information content of individ-ual ICD-9-CM codes, a DRG classification system is limited or empowered by the way it uses the com-bined information from all diagnosis and procedure codes reported for a patient. In instances where an individual code is overly broad with respect to a specific diagnostic condition, the DRG grouper can examine for the presence of certain additional diag-noses to differentiate a more severe illness. The DRG grouper can also examine for the presence of certain procedure codes in instances where the procedure is consistently associated with a more severe illness and there is minimal practice pattern variation.
DRG classification systems have purposely restricted their data elements to those defined by UHDDS and used as part of UB-92. This is done to make it possible to assign DRGs to all hospital dis-charge data sets and to take advantage of existing processes for establishing coding guidelines and an-nually updating the diagnosis and procedure codes. At the same time, it is important to recognize that additional clinical data elements collected as part of primary data sets (eg, clinical trials, medical record) might add to the predictive power and/or clinical utility of DRG classification systems. For neonatol-ogy this might include gestational age, Apgar score (at specified time intervals), blood gas values (at specified time intervals), and the presence of or pos-sibly certain types of prenatal care shown to affect outcomes. For this to be a realistic option for broad scale implementation there would have to be agree-ment among the provider and payor communities on
the data elements and definitions and a way to ex-pand the current UB-92 billing form. Whether this is likely to happen is difficult to say but it would prob-ably require a demonstration that the additional data elements provide significant predictive power and clinical utility above that which can be obtained from existing data elements. There would also be a lead time for incorporation into the ongoing billing forms and computer claims processing systems.
In sum, the data elements used by the existing DRG systems are the same. The difference between the DRG systems is in how extensively and effec-tively they use these data elements to form clinically and statistically coherent classifications.
COMPARISON OF STRUCTURAL CHARACTERISTICS OF DRG CLASSIFICATION
SYSTEMS
The structural characteristics of each DRG classifi-cation system identify at a broad level the strengths and weaknesses of each system. They also provide a
conceptual frameworkfor understanding and interpret-ing the statistical performance of each system.
Table 2 provides a comparison of the structural characteristics of Medicare DRGs, AP-DRGs, and APR-DRGs for neonatal patients. Appendices 1, 2, and 3 provide a full listing of all the neonatal cate-gories in each DRG system. This section will begin with a summary description of the structural charac-teristics of each DRG system followed by a more detailed description.
The Medicare DRGsfor neonates are vastly differ-ent from both the AP-DRGs and the APR-DRGs. The Medicare DRGs do not use age to define neonates (MDC 15); do not use birth weight as an initial grouping variable; do not distinguish surgical from medical patients; and do not provide breakouts for multiple problems or severity subclasses. There are only seven DRG categories for neonates including one defined for neonates who are either transferred or die. The Medicare DRGs for neonates have not been substantively updated since their initial imple-mentation in 1984. Given these structural character-istics, there is little reason to expect the Medicare DRGs to yield a high statistical performance or be very meaningful clinically for neonates.
TheAP-DRGs are structurally similar to the APR-DRGsin a number of respects, somewhat different in other respects, and entirely different in still other respects. They both use age to define neonates (MDC 15) and both use birth weight as an initial grouping variable. They both use surgery as a grouping vari-able but do so differently. They both have major problem/other significant problem/other problem diagnoses lists but these lists are quite different. They are also used differently. The APR-DRGs use them to form severity (costliness) subclasses for each DRG category. The AP-DRGs do not form severity sub-classes but do provide separate DRG categories for neonates with multiple major problems who are
TABLE 2. Comparison of Structure of Three DRG Classification Systems for Neonates
Structural Elements Medicare DRGs Version 12.0
AP-DRGs Version 12.0
APR-DRGs Version 12.0
Definition of Neonate (ie, definition of MDC 15)
Newborn V30 code, perinatal diagnosis code, and a subset of approx. ten congenital anomaly diagnoses.
Age,29 days at admission.
Age,29 days at admission.
Use of birth weight No Yes, six birth weight
ranges.
Yes, six birth weight ranges.
Use of surgery No Yes, for neonates.1000 g. Yes, for all neonates.
Types of surgical lists N/A Significant OR procedures;
Minor abdominal OR procedures.
Major OR procedures; Other OR procedures; Minor OR procedures.
Major/extreme problem diagnosis lists
Yes Yes, for neonates.1500 g,
with combined major/ extreme problem list.
Yes, for all neonates, with separate lists for major diagnosis problem and extreme diagnosis problem. Multiple major problem
classifications
No Yes, for neonates.1500 g
through separate categories.
Yes, for all neonates through severity subclasses.
Other significant problem diagnosis list
No, is default category for all neonates not classified as major problem or normal newborn.
Yes, is “other problem” and “minor problem” categories.
Yes, is “other significant problem” category.
Other problem diagnosis list
No No Yes, through subclasses to
differentiate from normal newborns.
Reevaluation of diagnosis problem lists
No Limited Comprehensive
Normal newborns Newborns whose only diagnosis is a V30 newborn code or whose only other diagnoses are from a list of several dozen very minor diagnoses.
Default category for newborns who do not have diagnoses assignable to other categories.
Default category for newborns who do not have diagnoses assignable to other categories.
Severity subclasses No No Yes
Number of severity subclasses
N/A N/A 4
Interactive effect of multiple diagnoses in assigning severity subclass
N/A N/A Yes
Use of Non-OR procedure, mechanical ventilation
No Yes, as one of the criteria
for major problem categories which exist for neonates.1500 g.
Yes, as severity subclass modifier for all neonates, with differential weighting based on neonate’s birth weight and whether duration.96 hours.
Use of LOS No Yes, for transfer-out
patients and early death patients.
Yes, for transfer-out patients only.
Use of death Yes Yes, for patients who die
within first day of life and also those who are
,1500 g.
Not used in definition of categories so that mortality rates within each category can be examined.
Risk of mortality subclass
No No Yes
Number of mortality subclasses
N/A N/A 4
Interactive effect of multiple diagnoses in assigning mortality subclass
N/A N/A Yes
Number of base DRG categories
7 28 43 (Version 12.0)
35 (Version 15.0)
Total number of DRG categories (with multiple major problem or severity subclass breakouts)
7 34 172 (Version 12.0)
140 (Version 15.0)
The version 12.0 DRG classification systems are those which were applicable for the ICD-9-CM diagnosis codes in effect for the time period October 1994 –September 1995 and were applied to this study’s databases.
patients. AP-DRGs use death as a grouping variable. APR-DRGs do not use death as a grouping variable so that death can be used as an outcome variable.
The number of base DRG categories is 28 in AP-DRGs and the total number of categories is 34 with multiple major problem breakouts for certain of the base AP-DRGs. The number of base DRG categories is 35 for APR-DRGs and the total number of catego-ries is 140 with 4-way severity subclass breakouts for all the base APR-DRGs. The APR-DRG system main-tains a large number of categories for neonatal pa-tients for three reasons: 1) to generally increase the clinical meaningfulness of the DRG categories; 2) to maintain a consistent 4-tiered severity subclass hier-archy even although there are some low-volume cells (eg, neonate with major surgery, subclass one); and (3) to support risk of mortality as well as resource use applications (eg, separate categories for neonate with major anomaly/hereditary condition and neonate with respiratory distress syndrome).
The APR-DRGs for neonates are comprehensively reviewed and updated with each substantive update to the APR-DRG system, which occurs every second or third year. The AP-DRGs for neonates are not substantively updated on a regularly scheduled basis but there have been updates.
Following is a summary of how one of the DRG systems, the APR-DRG, actually groups a neonatal patient, and then a detailed comparison of the struc-tural characteristics of each DRG system. Refer to Appendix 3 for a full listing of the APR-DRG cate-gories.
Step 1: Prebirth Weight APR-DRG Assignment
If a neonate is transferred-out within the first 4 days of life, receives an organ transplant or extracor-poreal membrane oxygenation, the neonate is as-signed to one of the pre-birth weight APR-DRGs.
Step 2: Birth Weight Range Classification
If not assigned to a prebirth weight APR-DRG, the neonate is classified to one of six birth weight ranges.
Step 3: Surgical Versus Medical Classification
All neonates assigned to a birth weight range are next classified as either surgical or medical. For ne-onates,2500 g (5.5 pounds) this includes only those with a major OR procedure. For neonates .2499 g, this includes neonates with any OR procedure.
Step 4: Surgical APR-DRG Assignment
All neonates classified as surgical are assigned to a specific APR-DRG in their birth weight range. For neonates.2499 g there are three surgical APR-DRGs numbered in hierarchical order. If a patient has more than one OR procedure, the patient is assigned to the highest category in the APR-DRG surgical hierarchy.
Step 5: Medical APR-DRG Assignment
All neonates classified as medical are assigned to a specific APR-DRG in their birth weight range: be-cause most neonates do not have a principal diagno-sis in the usual sense of the term, a hierarchy among medical APR-DRGs must be specified for patients
with multiple significant diagnostic conditions. Prin-cipal diagnosis is defined by the UHDDS to be “that condition established after study to be chiefly re-sponsible for occasioning the admission of the pa-tient to the hospital for care.” For newborns, the principal diagnosis code is a V30-V39 code indicating newborn birth as this is what led to the hospital admission. This provides no information about med-ical problems and because there is no significance to the sequencing of secondary diagnoses it is necessary to create a hierarchy among medical APR-DRGs. If a diagnosis is not used to assign the neonate to a medical APR-DRG, it is available to be used in the severity subclass algorithm.
Step 6: Assignment to APR-DRG Severity Subclass
Once a patient is assigned to an APR-DRG, then the severity subclass assignment is made based on all the diagnoses, interactions between multiple diag-noses, and select non-OR procedures.
Step 7: Assignment to APR-DRG Risk of Mortality Subclass
Same process is followed as for severity subclass assignment, except that the subclass values assigned to individual diagnoses are often different.
The Medicare DRGs define neonates(MDC 15) by the presence of certain diagnoses codes. There must be either an ICD-9-CM code indicating that the pa-tient is a newborn (codes V30.XX–V39.XX), or a peri-natal diagnosis code (codes 760.XX–779.XX), or one of approximately 10 congenital anomaly diagnosis codes. This definition causes certain patients to be excluded from MDC 15 that are considered neonates by the conventional definition of age 0 to 28 days and causes other patients to be included in MDC 15 who are older than 28 days. The neonatal patients most frequently excluded from Medicare MDC 15 are full term neonates who are either transfer-in or readmis-sion patients. Many of the infants who require sur-gery in the first month of life are full-term babies who are transferred to a facility that can perform neonatal surgery and wind up in a non-neonatal MDC such as the digestive or circulatory MDC.
The AP-DRGs and APR-DRGs both define neo-nates based on age 0 to 28 days at time of admission. The diagnosis codes have no bearing on the defini-tion of a patient as a neonate.
The Medicare DRGs do not usebirth weightas an initial grouping variable. Instead, the very broad diagnosis codes for extreme prematurity and other prematurity are used. The AP-DRGs and APR-DRGs both use birth weight (six ranges) as the initial grouping variable.
define a list of major OR procedures and create a major surgery category for neonates in all birth weight ranges, with a 4-way severity subclass brea-kout. The APR-DRGs also create an other surgery category for neonates.2499 g (5.5 pounds).
The Medicare DRGs do not have severity (costli-ness) subclasses for neonates. The AP-DRGs also do not have severity subclasses but do provide separate DRG categories for neonates with multiple major problems for those in birth weight ranges .1500 g (3.3 pounds). The APR-DRGs have a 4-way severity subclass breakout that is applied to all DRG catego-ries in all birth weight ranges. The severity subclass algorithm considers all the patient’s diagnoses in-cluding interactive effects of multiple diagnoses.
The Medicare DRGs have amajor problem diagno-sis list for neonates that it applies to create two DRG categories, preterm neonate with major problem and full-term neonate with major problem. The list has not been updated in any significant way since its initial implementation in fiscal year 1984. The AP-DRGs have updated the major problem diagnosis list and have applied the list to create DRG categories for neonates with major problems and multiple major problems, but only for neonates in birth weight ranges .1500 g (3.3 pounds). The APR-DRGs have also updated and use a major problem diagnosis list for neonates, which it further differentiates into ma-jor problems and extreme problems. For example, neutropenia and thrombocytopenia are considered major problems and disseminated intravascular co-agulation is considered an extreme problem. All the diagnosis lists and the severity subclass algorithms are comprehensively reviewed and updated with ev-ery substantive update of APR-DRGs, which occurs every second or third year.
The Medicare DRGs do not have another significant problem list per se, but instead define “significant problem” neonates as the default category for full-term neonates who are not assigned to either the major problem or normal newborn category. It con-tains many neonates who on close inspection appear to be normal newborns. The AP-DRGs provide DRG categories for “minor problems” and “other prob-lems” for neonates.1500 g (3.3 pounds). The diag-noses included in these categories roughly corre-spond to the “other significant problem” categories in the APR-DRG system, except that they are less inclusive.
The Medicare DRG approach to defining normal newbornsis entirely different from the AP-DRGs and APR-DRGs. The Medicare DRGs define normal new-borns as those newnew-borns whose only diagnosis is a V30 to V39 newborn code or whose only other diag-noses are from among a list of several dozen very minor diagnoses (eg, 7746 unspecified fetal/neonatal jaundice). If a newborn has any other of the 12 766 ICD-9-CM diagnosis codes and is not classified as major problem or premature, it is assigned to the default category of other significant problem. For example, diagnoses such as transient tachypnea and hypoglycemia will get a neonate assigned to the Medicare DRG of other significant problem. The re-sult of this approach is that the neonates classified as
normal newborns are almost all truly normal new-borns, but many other normal newborns wind up classified as other significant problem. In contrast, the AP-DRGs and APR-DRGs define normal new-borns to be a default category for newnew-borns who do not have a diagnosis assignable to one of the other more specific problem categories.
Medicare DRGs do not use LOS as a grouping variable. The AP-DRGs and APR-DRGs both use LOS to create categories for neonates transferred to another acute hospital in the first 4 days of life so as to identify early triage and referral neonates. There are other neonates who are transferred to another acute hospital at a later point in time but neither classification system addresses this. To illustrate, there are low birth weight and other complex neo-nates who receive several weeks or months of care at a tertiary facility and are then sometimes transferred back to a community hospital closer to home for growth and development care. The acute hospital-ization episode is thereby split up between several hospital stays. This often reflects local geographic and delivery system factors, which can not be ad-dressed through a diagnostic classification system. The transfer and back-transfer issues are very impor-tant but have to be addressed through policies and methodologies tailored to the local environment for specific applications such as prospective payment or outcomes analysis.
The Medicare DRGs usedeath as a grouping vari-able. It combines into one DRG all neonatal deaths, a very heterogeneous group, with all neonates trans-ferred to another acute hospital, another very heter-ogeneous group. Among neonates who die there are several prominent subgroups. There are newborns who are judged to be nonviable and receive only comfort measures and often die within the first or second day of being born. These are mostly ex-tremely premature infants and newborns with cer-tain very severe anomalies. There is another group that receives medical or surgical treatment but who nonetheless die, often within 1 week or several weeks of birth. Then there is another group that dies after many weeks or months of life. The Medicare DRGs place all these neonates together with those who are transferred to another acute hospital.
The AP-DRGs create five categories for neonates who die. There are two categories for neonates who die within the first day of life and three categories for other neonates who die and are in the lower birth weight ranges. The APR-DRGs do not use death as a grouping variable. To be able to examine death as an outcome within the individual DRG categories, it is necessary to not use death to define the categories. For payment system or other purposes it may be indicated to consider separately neonates who die, but this can still be done and tailored to the specific application. This can be done having the benefit of all the information from the classification system to un-derstand the characteristics of neonates who die.
mul-tiple diagnoses to predict the likelihood of a patient dying. The assignment of diagnoses to risk of mor-tality subclasses is sometimes the same but is often different from that for severity (costliness) sub-classes. The reason for this is that some diagnoses may indicate a patient is likely to need a lot of treatment, but is not likely to die. Other diagnoses may indicate a high likelihood of dying and resource use might be lower for that reason.
Finally, the three DRG systems differ with respect to the use of themechanical ventilation. The Medicare DRGs do not classify neonates based on the use of mechanical ventilation although they do for older patients. The AP-DRGs use mechanical ventilation as an additional means to identify neonates with a ma-jor problem when it differentiates based on mama-jor problems (birth weight ranges .1500 g). The APR-DRGs use mechanical ventilation as a severity sub-class modifier with differential weighting based on a neonate’s birth weight and whether the duration of mechanical ventilation is $96 hours, a distinction available in the ICD-9-CM procedure codes. For ne-onates,1000 g (2.2 pounds), the code for mechanical ventilation ,96 hours does not add much informa-tion to what is already known about the infant’s health condition and therefore is not used to modify the severity subclass. For larger infants, particularly those .2499 g, mechanical ventilation ,96 hours is very distinguishing of the infant’s health condition and therefore is considered as a possible modifier to the severity subclass. The code for mechanical ven-tilation$96 hours adds information about the health condition of all neonates and is considered as a pos-sible modifier to the severity subclass. It is especially distinguishing among larger infants and is given particular weight for them as a severity subclass modifier.
In sum, the structure, definitions and logic for the classification of neonates are very different for Medi-care DRGs, AP-DRGs, and APR-DRGs. The process for review and refinement of each DRG system is also very different. It is therefore reasonable to ex-pect that the statistical performance and clinical util-ity of the three DRG systems will also be consider-ably different.
DATABASE FOR COMPARATIVE ANALYSIS OF DRG CLASSIFICATION SYSTEMS
The database used for this study was a calendar year 1993 hospital medical record abstract discharge database that included 675 acute general hospitals and 40 freestanding acute children’s hospitals. To be nationally representative, the study sample frame included all patients from the 675 general hospitals and a 20% random sample from the 40 children’s hospitals.
The 675 general hospitals were generally represen-tative of acute general hospitals in the United States with respect to bed size, teaching status, and urban/ rural location although there was a slight underrep-resentation of rural hospitals. The 675 general hospi-tals included a generally representative number of hospitals from the four Census Bureau regions of the country with the exception of the Northeast, which
was underrepresented. The 40 children’s hospitals were very representative of freestanding acute chil-dren’s hospitals in the United States. The edited data set for this study contained 4 203 646 inpatient dis-charges of which 492 558 were newborns and other neonates (age,29 days at admission).
The study database was built for NACHRI by HCIA. It included all children’s hospitals participat-ing in NACHRI’s Case-Mix Comparative Reportparticipat-ing Program and all general hospitals for whom HCIA had medical record abstract data at the time the database was created. HCIA collects the general hos-pital data from a variety of sources including state agencies, state hospital associations, and individual hospitals. All data must pass a series of clinical, demographic and financial edits developed by the NACHRI Case-Mix Comparative Reporting Pro-gram. The data from each hospital include the UHDDS data elements plus total charges, admission source, and birth weight if reported as a separate data element by the hospital. The database also in-cluded many calculated variables such as LOS, area wage-adjusted charges, area wage-adjusted costs, HCFA DRG, AP-DRG, and APR-DRG.
Four of the variables in the study database are measures of hospital resource use: LOS, total charges, area adjusted charges, and area wage-adjusted costs. The measure selected for most of the study’s analyses was area wage-adjusted costs. This was selected because, of the measures available, it best represented total resource use. Two sets of cal-culations are performed to create this variable. First, total charges are converted to area wage-adjusted charges by applying the HCFA area wage index. This adjusts for differences in a hospital’s charge structure that relate to wage levels in its locale. HCFA publishes this information each year as part of its rule-making process to update Medicare hospital prospective payment system rates. Second, area adjusted charges are converted to area wage-adjusted costs by applying a hospital-wide ratio of costs-to-charges (RCC). This adjusts for overall hos-pital-wide differences from one hospital to another in the markup of charges over costs. The RCCs are obtained from HCFA’s hospital Medicare cost report files that are updated annually and made publicly available. The specific set of hospital-wide RCCs se-lected for this study were the operating plus capital costs RCCs. These RCCs include all Medicare allow-able hospital costs except graduate medical educa-tion (GME). GME costs were excluded to avoid the skewing effect of these costs when comparing teach-ing hospitals and nonteachteach-ing hospitals. It should be noted that these cost figures contain hospital costs only; no physician costs are included.
readmission neonates treated in infant-toddler or other medical-surgical patient care units.
An extensive study on the effect of different cost accounting methods has identified that cost account-ing and pricaccount-ing methods commonly used by acute general hospitals tend to understate the true cost of caring for children, especially young children, those treated in a pediatric or neonatal intensive care unit, and those with serious congenital and chronic health conditions. The reasons for this are many and very complicated. In brief, the actual unit costs of acute care hospital services for children tend to be higher than for adult patients but is often not broken out discretely in the hospital’s cost accounting and pric-ing methods. This is often the case for patient care services such as nursing and respiratory care, and to a lesser extent, for ancillary services and for indirect service costs allocated using statistics from all age patients combined (eg, social services, plant opera-tions, general administrative). The tendency toward average costing (versus more discrete costing) is strongly reinforced by the Medicare hospital cost reporting system that, for example, averages the nursing care costs of all intensive care unit patients and averages the nursing care costs of all medical-surgical unit patients.15
To simplify the data analysis for this study, all patients with the discharge destination of transferred to acute hospital or left against medical advice were removed from the edited database unless they were assigned to an APR-DRG defined on that basis. These are patients with an incomplete hospitaliza-tion so it is not reasonable to expect a DRG system to predict how much care a patient receives before be-ing discharged. For any payment system application it is of course necessary to develop payment policies for these patients or exclude them from prospective per discharge payment. This is an especially impor-tant issue for neonates who are often transferred to tertiary facilities for diagnosis and treatment and are then sometimes transferred back to the community hospital for growth and development care. It is also important to include transfer patients in any delivery system or outcomes analysis that is examining the total cohort of neonates.
EXPLANATION OF VARIANCE (R2) STATISTICS
FOR RESOURCE USE AND MORTALITY One of the most commonly used statistics to mea-sure the performance of DRG classification systems is reduction of variance (R2), often referred to as explanation of variance. It is also a commonly mis-understood statistic. R2 provides a summary mea-sure of the extent to which a DRG system is able to predict the value of a dependent variable such as resource use or mortality, based on the characteris-tics of individual patients. A technical explanation of how the R2statistic is calculated including the actual formula is provided in Appendix 4.
In simplified terms, the denominator in the R2 equation is the total variation in the dependent vari-able for all patients in the database. The numerator is the amount of total variation that can be explained by classifying each patient into a DRG category. If,
for example, 40% of total variation can be reduced or explained by assigning a patient to a DRG category, then the R2equals 0.400. If, for example, 60% of total variation can be reduced or explained, then the R2 equals 0.600. If 100% of total variation could be ex-plained, then the R2would equal 1.00.
The denominator in the R2formula, total variation, is calculated by summing the square of the difference between each individual patient value and the aver-age patient value for all patients in the database. The numerator is calculated by summing the square of differences between each individual patient value in a DRG category and the average value for all patients in the same DRG category. It is important to realize that because the R2formula calculates variation by summing the square of differences, it is very sensi-tive to extreme values. In other words, if there are subgroups of patients with predictably very high costs and these patients can be classified into their own DRG categories, a particularly high R2value can be generated. This would suggest that neonatal and circulatory MDCs might achieve high R2values, neo-natal MDCs because of the predictably very high cost of extremely premature infants and surgical neo-nates and circulatory MDCs because of the predict-ably high costs of certain types of cardiovascular surgery.
There are limits to how high an R2a DRG classifi-cation system is likely to achieve. In the instance of costs there are at least five reasons why it is unlikely for a DRG system to generate an R2that is close to 1.00. First, the available diagnostic and procedure code information is not always as specific and pre-cise as might be desired. Second, even if the codes always had the ideal specificity and coding practices by physicians and hospital personnel were perfect, it is not possible to predict the exact course for each patient. Third, there are differences in physician and hospital practice patterns that affect costs. Fourth, there are differences in hospital operating and capital costs. Fifth, there are limitations to the precision with which costs are measured for individual patients by existing hospital cost accounting and pricing meth-odologies. The first three of these reasons are also applicable constraints to the ability of a DRG classi-fication system to achieve a high R2 for explaining mortality. Actually, because death only occurs for a small subset of patients, one might expect the level and type of information from diagnosis codes alone to be more of a constraint. In other words, the R2 achievable by DRG systems for mortality might be less than that which is achievable for costs.
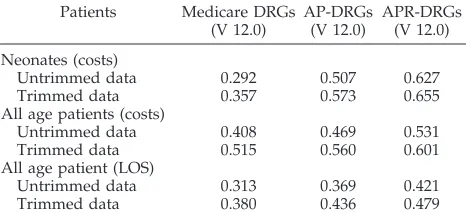
Table 3 provides cost R2statistics for neonatal pa-tients. It also provides cost R2 statistics for all age patients to enable a perspective as to whether the different DRG classification systems seem to perform better or worse for neonatal patients than other pa-tients. Finally, it provides LOS R2statistics for all age patients to show the relationship between LOS R2 and cost R2statistics.
neonatal patients. For all age patients, the cost R2is 0.408 for Medicare DRGs, 0.468 for AP-DRGs, and 0.531 for APR-DRGs. For neonatal patients, the cost R2 is extremely low at 0.292 for Medicare DRGs, increases to 0.507 for AP-DRGs, and to 0.627 for APR-DRGs. So, the cost R2 for neonates is much lower than for other patients in Medicare DRGs, increases to a value a little higher than for other patients in AP-DRGs, and increases to a value that is much higher than for other patients in APR-DRGs. The increase in R2 for AP-DRGs is thought to be attributable to the separate categorization for low birth weight neonates, multiple major problem neo-nates, and surgical neonates. The additional increase in R2for APR-DRGs is thought to be attributable to the more refined set of base categories and the 4-tiered severity subclasses. The neonatal MDC R2of 0.507 in AP-DRGs is the second highest among the 25 MDCs with circulatory the highest at 0.535. The neo-natal MDC R2 of 0.627 in APR-DRGs is the highest followed by circulatory at 0.571.
Table 3 shows as might be expected that the LOS R2is less than the cost R2in all DRG systems. For all age patients, the LOS R2is 0.313 for Medicare DRGs, 0.369 for AP-DRGs, and 0.421 for APR-DRGs. These R2 values are all three-quarters to four-fifths of the cost R2values. The reason for this is that DRG sys-tems are intended to explain variation in total re-source use, ie, costs. A patient’s LOS represents a major component of a patient’s total resource use but there are many other components of costs as well. To illustrate, a surgical patient may not have an ex-tremely long LOS but may still have fairly high costs given the intensity of service while an inpatient. Because the measure of resource use that DRG sys-tems are intended to predict is cost, this article fo-cuses on costs although certainly additional LOS analyses might also be insightful.
This study also produced cost R2 statistics for a trimmed data set, that is, with outliers removed. This was done to show how much the R2statistics can be effected by removing extreme or unusual patients.
For this analysis, it was the intent to remove only very extreme outliers. High-cost outliers were de-fined as the highest 1% of patients in each DRG category in each DRG system. Low-cost outliers were defined as the lowest 1⁄2% of patients in each DRG category in each DRG system. Approximately 7400 of the database’s 492 558 neonates were removed from the trimmed data set for each DRG system, although it is important to note it was a different group of 7400 neonates identified as extreme outliers for each DRG system.
The R2results from the trimmed data set show the same overall pattern as the untrimmed database. The R2values are 0.357, 0.573 and 0.655, respectively for Medicare DRGs, AP-DRGs, and APR-DRGs. There is also another important pattern. The lower the pre-dictive performance of the DRG system with the untrimmed data set, the greater its improvement in the trimmed data set. The R2improves from 0.292 to 0.357 for Medicare DRGs, from 0.507 to 0.573 for AP-DRGs, and from 0.627 to 0.655 for APR-DRGs. The primary reason for this is that the outlier patients are even more extreme in the poorer performing DRG systems. So although the outlier definition used in this study removes 1% of high-cost patients from each DRG system, there is more unexplained varia-tion removed in the instance of the poorer perform-ing DRG systems. It is important to be aware of the effect of trimming outliers from a data set as many comparative analyses are done from trimmed data.
The purpose of the R2statistical analysis for mor-tality is to compare the overall ability of the three DRG systems to explain variation in inpatient hospi-tal morhospi-tality. The DRG systems, in particular the APR-DRGs, are increasingly being used or consid-ered for use for this purpose. Numerous states are now publishing hospital risk-adjusted mortality rates to permit consumers to compare hospital out-comes. For example, the State of Florida Agency for Health Care Administration included an APR-DRG-based mortality analysis as part of its 1996 Guide to Hospitals in Florida. The Medicare DRGs and AP-DRGs systems were developed for predicting re-source use and were not really intended for mortality prediction. In these systems mortality is one of the variables used to define the DRGs (ie, patients are assigned to certain DRGs depending on whether they lived or died). This is not appropriate for a mortality prediction model because it would be cir-cular logic to use mortality to predict mortality. Therefore, for the mortality analyses, the data were regrouped eliminating all mortality distinctions, (ie, patients are grouped into the DRG to which they would have been assigned if the patient had not died). Because APR-DRGs do not use mortality as a grouping variable, regrouping was not necessary for APR-DRGs.
The APR-DRGs have a separate set of severity subclasses that group patients based on risk of mor-tality. These APR-DRG risk of mortality subclasses were used for the mortality analyses instead of the APR-DRG severity subclasses that were used for the analyses of cost and LOS.
Mortality in the hospital is used in this analysis.
TABLE 3. Explanation of Variance Statistics (R2) for Costs and
Lengths of Stay for Three DRG Classification Systems
Patients Medicare DRGs (V 12.0)
AP-DRGs (V 12.0)
APR-DRGs (V 12.0)
Neonates (costs)
Untrimmed data 0.292 0.507 0.627
Trimmed data 0.357 0.573 0.655
All age patients (costs)
Untrimmed data 0.408 0.469 0.531
Trimmed data 0.515 0.560 0.601
All age patient (LOS)
Untrimmed data 0.313 0.369 0.421
Trimmed data 0.380 0.436 0.479
Costs include hospital operating and capital costs, exclusive of graduate medical education costs, adjusted by HCFA area wage index.
Trimmed data set excludes extreme outliers. High-cost outliers are defined as the highest 1% of patients and low-cost outliers as the lowest1⁄2% of patients in each DRG in each DRG system.
The N for neonates 5 492 558. The N for all age patients 5
4 203 646.
Mortality in the hospital is commonly available in hospital administrative records, but if the patient dies the day after discharge from the hospital, this would not be reflected in the hospital’s records. Ide-ally, mortality subsequent to discharge would have been merged with the data, but this information was not available.
The R2for mortality is computed by assigning each patient a value of 0 or 1 indicating whether they were discharged alive or dead, respectively. The predicted mortality for the patient is equal to the average value of the 0/1 variable in the DRG to which the patient is assigned. The average value of the 0/1 value is equivalent to the fraction of patients who die in the DRG. Based on the 0/1 variable, the R2for mortality is computed in the same manner as the R2for cost or LOS.
The R2for mortality for all age patients was 0.108 for Medicare DRGs, 0.1507 for AP-DRGs, and 0.2638 for APR-DRGs. The R2for mortality for neonates was 0.083 for Medicare DRGs, 0.304 for AP-DRGs, and 0.4155 for APR-DRGs. The improvement in mortality R2for AP-DRGs is thought to be attributable primar-ily to the low birth weight categories and secondarprimar-ily to the categories for multiple major problems and surgical neonates. The additional improvement in mortality R2for APR-DRGs is thought to be attribut-able primarily to the risk of mortality subclasses and secondarily to the refined base categories, in partic-ular, those for major anomalies and hereditary con-ditions.
As risk of mortality analysis is a more recent ap-plication of DRG systems than cost analyses, there is not as full of an understanding of how it works and its most appropriate interpretation. In addition, in the case of the APR-DRGs, there have been many revisions introduced to the risk of mortality sub-classes in version 15.0 APR-DRGs released in the spring of 1998. Finally, it should be noted that a DRG-based mortality model is quite different from some of the other neonatal mortality models that may include additional variables such as gestational age (along with birth weight), Apgar score (at spec-ified time intervals), blood gas values (at specspec-ified time intervals), presence of prenatal care, or certain specific types of prenatal care. Some of the other neonatal mortality models also differ in using only certain types of diagnoses or only diagnoses within a certain time period after birth. It would be useful to explore these differences further in future analyses.
In sum, the differences in overall predictive power are very large. The Medicare DRGs have very mod-est power for predicting the costs of neonatal inpa-tient care or inpainpa-tient mortality. The APR-DRGs have much greater predictive power, in fact, more than double for costs and five times greater for mor-tality. The overall predictive power of AP-DRGs is intermediate to the Medicare DRGs and APR-DRGs, although somewhat closer to APR-DRGs. The next section examines how well each DRG system pre-dicts costs for specific groups of neonates and hos-pitals.
PAYMENT IMPACTS AND SYSTEMATIC EFFECTS BY PATIENT TYPE AND HOSPITAL TYPE A key question in evaluating the performance of alternate DRG classification systems is whether they predict equally well the cost for all groups and sub-groups of patients and hospitals. To the extent that patients of certain age ranges or service lines or other attributes have costs that are greater or less than predicted, there is a systematic bias. If certain hospi-tals predominate in the care of patients whose re-source needs are systematically understated, then these hospitals will likewise have their case-mix in-tensity understated and will be underpaid in a pay-ment application.
The statistical measure used in this study to eval-uate the systematic effects or biases of each DRG classification system is aratioof simulated payment to actual cost for various groupings and subgroup-ings of patients and hospitals. A ratio.1.00 indicates that the payment is greater than the actual cost. A ratio,1.00 indicates that the payment is less than the actual cost.
Essentially, the hypothesis being tested is that the AP-DRGs and especially the APR-DRGs will show a payment to actual cost ratio closer to 1.00 than the Medicare DRGs for various groups and subgroups of patients and hospitals. To the extent this is true, they provide a fairer and less biased classification of pa-tients. For the comparative analysis of payment im-pacts for neonates, a neonate is defined as any pa-tient whose age at time of admission is less then 29 days regardless of how classified by the DRG system. Onecaveatis in order. This statistical testing is not intended to represent the testing of a full prospective payment model. For this, additional payment poli-cies would have to be tested, most notably for outlier patients and for transfer patients if they are included in the prospective payment system. Facility level adjustments would also need to be considered. Rather, it is the purpose of this analysis to test the classification system component of a prospective payment model. Secondarily, it will provide insight as to where payment system adjustments may be most needed and whether they seem less important when the AP-DRGs or APR-DRGs are used.
Table 4 presents the overall results for neonates as well as separate results for surgical neonates, medi-cal neonates, and normal newborns.
The ratio of payment to costs for all neonates is 0.899 for Medicare DRGs and increases to 0.994 and 1.000 for AP-DRGs and APR-DRGs. This is because the Medicare DRGs define neonates by the presence of certain newborn and perinatal diagnosis codes and place certain very expensive neonates in non-neonatal DRGs. The AP-DRGs and APR-DRGs de-fine neonates by age (0 –28 days at admission) and so the sum of predicted costs for all neonates will be approximately equal actual costs.
The ratio of payment to costs varies dramatically by service line.The change is most dramatic forsurgical
the standpoint of systematic risk, this is very impor-tant because only a very small number of hospitals offer neonatal surgical services. The opposite pattern presents for normal newborns whose payment ratio for Medicare DRGs is very high at 1.231 and de-creases to .988 for AP-DRGs and 1.016 for APR-DRGs. In Medicare DRGs, many neonates who are really normal newborns are grouped to other signif-icant problems, and as a result, the payment is much higher than actual cost. Although these newborns are relatively inexpensive and dollar differences per case are small, total case volume is very large so total dollar volume is significant.
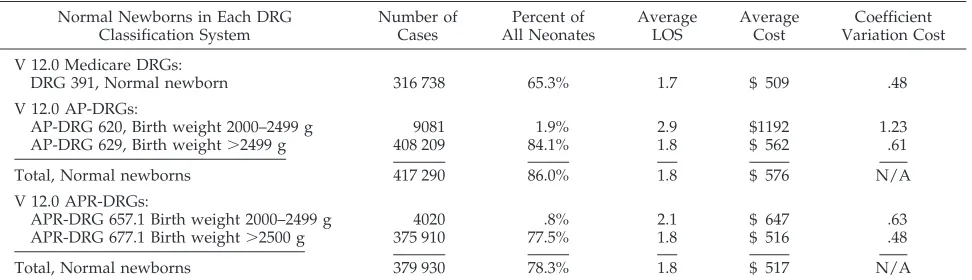
The classification of normal newborns is presented in more detail in Table 5. In Medicare DRGs, 65.3% of neonates are classified as normal newborns. In AP-DRGs, 86.0% of neonates are classified as normal newborns. In APR-DRGs, 78.3% are classified as nor-mal newborns, and another 7.5% are classified in a subclass entitled other problem that is intermediate to normal newborn and other significant problem.
Based on a review of the case counts, costs, and diagnosis codes for neonates classified as normal newborns and the contiguous DRG categories, it is clear that the Medicare DRGs are classifying a sub-stantial number of neonates as having significant problems who really are normal newborns. An op-posite pattern presents with the AP-DRGs where it appears that many neonates classified as normal newborns really have problems that properly should place them in a category intermediate to normal newborn and other significant problem. The most accurate classification of normal newborn is pro-vided by the APR-DRGs.
Table 6 presents another very striking pattern. Ne-onates who are admitted from another acute hospital (transfers-in) have an extremely low payment ratio of 0.548 with Medicare DRGs. This improves to 0.816 with AP-DRGs and to 0.948 with APR-DRGs. This again is very important from the viewpoint of sys-tematic risk. In an area such as neonatology where there is a relatively high regionalization of services,
TABLE 4. Comparison of Payment to Actual Costs for Three DRG Systems for Neonates by Service Line
Neonates by Service Line
Case Totals Ratio of Payment to Cost
Total Cases
Total Costs (000s)
Average Cost per Case
Medicare DRGs (V 12.0)
AP-DRGs (V 12.0)
AP-DRGs versus Medicare DRGs
APR-DRGs (V 12.0)
APR-DRGs versus Medicare DRGs
Neonates (Age 0–28 Days):
Surgical 3880 $ 209 068 $53 884 0.318 0.869 1173.3% 1.004 1215.8%
Medical 61 452 $ 591 673 $ 9628 0.956 1.041 18.9% 0.991 13.8%
Other 95 $ 607 $ 6386 0.649 1.282 197.5% 1.127 173.7%
Normal newborn 427 131 $ 264 942 $ 620 1.231 0.988 219.7% 1.016 217.3%
Total 492 558 $1 066 290 $ 2164 0.899 0.994 110.6% 1.000 111.4%
This is simplified payment simulation with entire payment based on DRG weight and no outlier or facility level adjustments. Costs include hospital operating and capital costs, exclusive of graduate medical costs, adjusted by HCFA area wage index.
For purposes of this comparison, any patient in a surgical DRG in any of the three DRG systems is considered a surgical patient. Any patient in a normal newborn DRG in any of the three DRG systems is considered a normal newborn. Any patient in an obstetrical or mental health DRG in any of the three DRG systems (only possible in Medicare DRGs) is classified as “other.” All other patients are considered medical.
TABLE 5. Comparison of Classification of Normal Newborns in Three DRG Systems
Normal Newborns in Each DRG Classification System
Number of Cases
Percent of All Neonates
Average LOS
Average Cost
Coefficient Variation Cost
V 12.0 Medicare DRGs:
DRG 391, Normal newborn 316 738 65.3% 1.7 $ 509 .48
V 12.0 AP-DRGs:
AP-DRG 620, Birth weight 2000–2499 g 9081 1.9% 2.9 $1192 1.23
AP-DRG 629, Birth weight.2499 g 408 209 84.1% 1.8 $ 562 .61
Total, Normal newborns 417 290 86.0% 1.8 $ 576 N/A
V 12.0 APR-DRGs:
APR-DRG 657.1 Birth weight 2000–2499 g 4020 .8% 2.1 $ 647 .63
APR-DRG 677.1 Birth weight.2500 g 375 910 77.5% 1.8 $ 516 .48
Total, Normal newborns 379 930 78.3% 1.8 $ 517 N/A
Costs include hospital operating and capital costs, exclusive of graduate medical education costs, adjusted by HCFA area wage index. Analytic outliers are removed from the above statistics. High-cost outliers are defined as the highest 1% of patients in each DRG in each DRG system and low-cost outliers are defined as the lowest1⁄2% of patients in each DRG in each DRG system. Thus, approximately 7400
of the database’s 492 558 neonates are removed from the above statistics.
Some of the more expensive neonates classified by the AP-DRGs as normal newborns are classified by the APR-DRGs into an intermediate category for other problems through its severity subclasses. The cost for these neonates is intermediate to that of normal newborns and those with significant problems. Not shown above, the statistics for these neonates are: APR-DRG 677.2, birth weight.2500 g, other problem: 32 037 cases, 2.6 ALOS, $1082 cost, .86 CV; and APR-DRG 677.3, birth weight.2500 g, other problem (multiple): 4422 cases, 4.4 ALOS, $2460 cost, .90 CV.
the DRG system needs to be able to describe fully the characteristics of patients who are transferred to ter-tiary facilities for diagnosis and treatment.
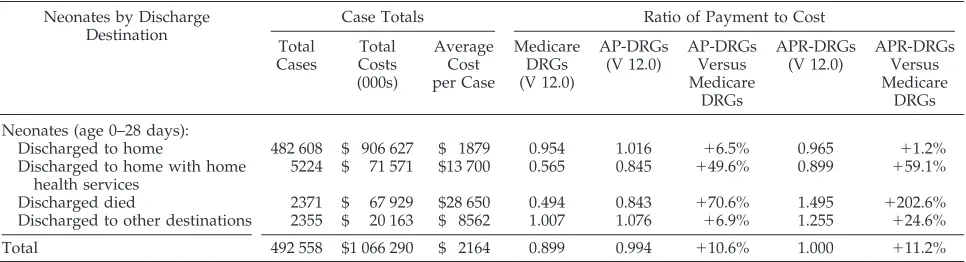
Table 7 identifies two important patterns. Neo-nates who are discharged from the hospital with home health services have an extremely low pay-ment ratio of .565 with Medicare DRGs. This im-proves to 0.845 with AP-DRGs and to 0.899 with APR-DRGs which is a significant improvement but still short of the desired level of 1.000.
The second important pattern by discharge desti-nation is for neonates who die. Their payment ratio is extremely low with Medicare DRGs at 0.494, in-creases to 0.843 with AP-DRGs and then to 1.495 with APR-DRGs. The best results are for AP-DRGs that might be expected because the majority of neo-nates who die are classified into one of the two AP-DRGs for neonates died within first day of life or one of the three neonate died categories for low birth weight neonates. The high level of overpayment with the APR-DRGs represents that more often than not, neonates who die cost less than other neonates in the same APR-DRG category. From a payment system
perspective, this suggests two options to consider: option one, remove neonates who die from prospec-tive per discharge payment and pay on another basis such as percent of charges; or option two, develop a short stay/low-cost outlier policy. Option one is sim-plest and probably fairest. Option two is somewhat complex because some early death neonates receive comfort only measures and other early death neo-nates receive major surgery and other expensive in-terventions.
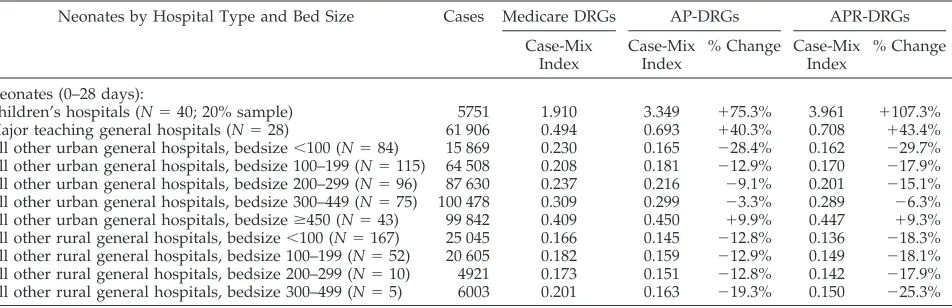
Table 8 identifies important patterns of systematic risk that are significantly but not entirely resolved as the AP-DRGs and then the APR-DRGs are applied.
The payment ratios are by far the lowest for free-standing acute children’s hospitalswith a value of 0.440 for Medicare DRGs, 0.769 for AP-DRGs and 0.910 for APR-DRGs. This is consistent with the payment ra-tios in Tables 4 and 6 for neonates who are surgical and neonates who are admitted from another acute hospital. Because children’s hospitals generally do not offer an obstetric service, nearly all their neonates are transfers-in from another acute hospital or read-missions. Many are surgical patients. These are the
TABLE 6. Comparison of Payment to Actual Cost for Three DRG Systems for Neonates by Admit Source
Neonates by Admission Source
Case Totals Ratio of Payment to Cost
Total Cases
Total Costs (000s)
Average Cost per Case
Medicare DRGs (V 12.0)
AP-DRGs (V 12.0)
AP-DRGs Versus Medicare
DRGs
APR-DRGs (V 12.0)
APR-DRGs Versus Medicare
DRGs
Neonates (age 0–28 days):
Admit from other acute hospital 7423 $ 148 593 $20 018 0.548 0.816 148.9% 0.948 173.0% Admit from a skilled nursing
facility
976 $ 8259 $ 8462 0.593 0.858 144.7% 1.084 182.8%
Admit from other source (most are newborn admissions, some are readmissions)
484 159 $ 909 438 $ 1878 0.959 1.025 16.9% 1.008 14.4%
Total 492 558 $ 1 066 290 $ 2164 0.899 0.994 110.6% 1.000 111.2%
This is simplified payment simulation with entire payment based on DRG weight and no outlier or facility level adjustments. Costs include hospital operating and capital costs, exclusive of graduate medical costs, adjusted by HCFA area wage index.
Many of the neonates coded as admitted from a skilled nursing facility are probably miscoded. In all likelihood, the majority of these neonates were actually admitted from another acute hospital.
TABLE 7. Comparison of Payment to Actual Costs for Three DRG Systems for Neonates by Discharge Destination
Neonates by Discharge Destination
Case Totals Ratio of Payment to Cost
Total Cases
Total Costs (000s)
Average Cost per Case
Medicare DRGs (V 12.0)
AP-DRGs (V 12.0)
AP-DRGs Versus Medicare
DRGs
APR-DRGs (V 12.0)
APR-DRGs Versus Medicare
DRGs
Neonates (age 0–28 days):
Discharged to home 482 608 $ 906 627 $ 1879 0.954 1.016 16.5% 0.965 11.2%
Discharged to home with home health services
5224 $ 71 571 $13 700 0.565 0.845 149.6% 0.899 159.1%
Discharged died 2371 $ 67 929 $28 650 0.494 0.843 170.6% 1.495 1202.6%
Discharged to other destinations 2355 $ 20 163 $ 8562 1.007 1.076 16.9% 1.255 124.6%
Total 492 558 $1 066 290 $ 2164 0.899 0.994 110.6% 1.000 111.2%
This is simplified payment simulation with entire payment based on DRG weight and no outlier or facility level adjustments. Costs include hospital operating and capital costs, exclusive of graduate medical costs, adjusted by HCFA area wage index.
There are no statistics above for neonates discharged to other acute hospital. This is because all patients discharged to other acute hospitals were removed from the study’s analytic data files to ensure that only patients with a complete acute care hospitalization experience were included.