JOURNAL OF GEOPHYSICAL RESEARCH, VOL. 101, NO. B3, PAGES 6021-6036, MARCH 10, 1996
A comparison
of historical
and paleoseismicity
in a newly
formed
fault
zone and a mature fault zone,
North Canterbury,
New
Zealand
Hugh
Cowan
1 and
Andrew
Nicol
2
Department of Geology, University of Canterbury, Christchurch, New Zealand
Phillip
Tonkin
Department of Soil Science, Lincoln University, Lincoln, New Zealand
Abstract.
The timing of large Holocene
prehistoric
earthquakes
is determined
by dated
surface
ruptures
and landslides
at the edge
of the Australia-Pacific
plate boundary
zone in
North
Canterb•, New Zealand. Collectively,
these
data indicate
two large (M > 7)
earthquakes
during the last circa 2500 years, within a newly formed zone of hybrid strike-
slip
and thrust
faulting herein described
as the Porter's
Pass-to-Amberley
Fault Zone
(PPAFZ).
Two earlier events
during the Holocene
are also recognized,
but the data prior to
2500
years are presumed
to be incomplete.
A return period of 1300-2000 years between
large
earthquakes
in the PPAFZ is consistent
with a late Ho!ocene
slip rate of 3-4 mm/yr if
each
displacement
is in the range 4-8 m. Historical
seismicity
in the PPAFZ is characterized
by frequent
small and moderate
magnitude
earthquakes
and a seismicity
rate that is
identical
to a region surrounding
the stmcturally
mature Hope fault of the Marlborough
Fault
System
farther north. This is despite
an order-of-magnitude
difference
in slip rate
between
the respective
fault zones and considerable
dffœerences
in the recurrence
rate of
large
earthquakes.
The magnitude-frequency
distribution
in the Hope fault region is in
accord
with the characteristic
earthquake
model,
whereas
the rate of large earthquakes
in
the
PPAFZ is approximated
(but over predicted)
by the Gutenberg-Richter
model. The
comparison
of these
two œault
zones
demonstrates
the importance
of the structural
maturity
of the fault zone in relation to seismicity
rates inferred from recent,
historical,
and
palcoseismic
data.
Introduction
Earthquake hazard assessment traditionally incorporates the analysis of historic and contemporary seismicity, supplemented where possible by geological information about average slip rates, rupture lengths and slip per event. The timing and magnitude of prehistoric earthquakes resulting in surface rupture are determined by dating features offset by the fault and by examining the geometry of the fault trace. However, these data alone often do not provide sufficient information to characterize large palcoseismic events [e.g. Ward, 1994].
In North
Canterbury,
New Zealand,
we have
supplemented
data
from fault traces with data from landslides distributed throughout the eastern foothills of the Southern Alps. These data are used
collective!y
to assess
the late Holocene
chronology
of large
--l Now
at
Norwegian
Seismic
Array,
Kjeller,
Norway.
2 Now
at
Fault
Analysis
Group,
Departmeat
of Earth
Sciences,
Univer-
sity of Liverpool, Liverpool, England.
Copyright ! 996 by the American Geophysical Union.
Paper Number 95JB01588. 0148-0227/96/95JB.0! 588 $05.00
earthquakes in the Porter's Pass-to-Amberley Fault Zone (PPAFZ), a region of newly formed strike-slip faulting that defines the deformation front at the edge of the Australia-Pacific plate boundary zone in northeastern South Island.
North Canterbury straddles the edge of the Australia-Pacific plate boundary zone between the Hikurangi Trough and the Southern Alps (inset, Figure l a). Dextral strike-slip faults of the Marlborough Fault System (MFS), farther north, transfer oblique plate motion between the Alpine fault and the Hikurangi subduction
zone. These faults have smaller cumulative offsets toward the
southeast but higher slip rates that reflect a southward relative migration of the locus of deformation across the region during the late Quaternary [e.g., Yeats and Berryman, 1987; H. Anderson et al., 1993]. The most southerly element of the MFS is the Hope fault (Figure l a). Sixty kilometers south of the Hope fault, a zone of disseminated shear is evolving along a similar trend (Figure la) [Rynn and Scholz, 1978; Carter and Carter, !982; t!emer and Bradshaw, 1985]. Elements of this zone comprise anastomosing strike-slip and thrust faults that extend east-northeast from the Southern Alps along the northern margin of the Canterbury Plains and pass into a fold and thrust belt near the town of AmberIcy
(Figures
la and 2). We use the name
Porter's
Pass-to-Amber!ey
Fault Zone (PPAFZ) to describe the strike and approximate
6022 COWAN ET AL.: PALEOSEISMICITY IN A NEWLY FORMED FAULT ZONE
! i !
i,
• I
I
/./"
J
1170 E
Figure la. Major structural elements of the northeastern South Island, and the locations and years of selected histor- ical earthquakes. The onshore structure is modified from Gregg [1964], Cowan [1992] and unpublished data of the Active Tectonics Research Group, University of Canterbury. Offshore structure is simplified from Barnes [1994]. The numbered rectangles delineate two regions selected for analysis of historical seismicity. Abbreviations are MFS, Marlborough Fault System; HPF, Hope fault; HRS, Hope River segment; KPF, Kakapo fault; PPAFZ, Porter's Pass- to-Amberley Fault Zone; PBF, Pegasus Bay fault; PP, Porter's Pass; and AY, AmberIcy. Inset shows location of Fig- ures la and lb in relation to the Alpine Fault (Air) and Hikurangi Trough (HT), the main elements of the New Zealand plate boundary. The arrow indicates the direction and magnitude (42 mm/yr) of the plate motaon vector
[DeMets et al., 1990].
geographic end-points of the zone, which has only recently been mapped comprehensively [Cowan, 1992].
The region between the Hope fault and PPAFZ is one of transition from subduction to collision [Reyners and Cowan, 1993], where the geological structure of the upper crust is dominated by northeast striking reverse and thrust faults that dip southeast and are closely associated with growing folds [Yousif, 1987; Nicol et al., 1994]. This region has accommodated ~12-15% northwest- southeast shortening during the Pleistocene, and rates of shortening dose to the Pacific coast are about 1%/100 kyr [Nicol et al., 1994]. Detailed studies along the edge of the plate boundary zone in North Canterbury indicate that deformation probably commenced within
the last 0.5-1 m.y.,
disrupting
a volume
of crust
not significantly
deformed since the Cretaceous [Cowan, 1992; Nicol et al., 1994]. The purpose of this paper is to evaluate the late Holocene record of large earthquakes in the PPAFZ, in order to understand the
frequency-magnitude
distribution
of earthquakes
in a newly
formed
fault zone. We compare historical and palcoseismic data from the PPAFZ with data from the adjacent structurally mature Hope fault
zone, and use these data to evaluate differences in fault behavior between stmcturally mature and newly formed fault zones.
Historic Seismicity
of the North Canterbury
Region
Earthquakes within and adjoining the North Canterbury region during the period 1942-1994 are shown in Figure lb, with those greater than magnitude 6.5 since 1888 indicated on Figure la. The focal depths for most events in the catalogue are uncertain due to the wide spacing of national network seismographs (typically >50 kin), but local studies of microseismicity, recorded on portable, small- aperture seismograph arrays, have indicated that most earthquakes in this region are restricted to the upper 10-15 km of the crust [Rynn and Scholz, 1978; Cowan, 1992; Reyners and Cowan, 1993].
The Hope River segment of the Hope fault (Figure la) and an
adjacent
splay
(Kakapo
fault) have
each
ruptured
during
historic
earthquakes of magnitude M---7.3 and M~7.0, respectively [Eiby, 1968; Cowan, 1991; Yang, 1991, 1992]. Two more events of
magnitude
6.5.-6.9
have occurred
in the eastern
part of North
Canterbury, in 1901 and 1922, and another event of M•, 6.7 occurred in June 1994, to the west of the PPAFZ. The 1994 earthquake occurred in the upper crust, and the 1901 and 1922 events are presumed to have also been shallow, based on relatively limited felt
COWAN
ET AL.- PALEOSEISMI•• IN A NEWLY
FORMED
FAULT
ZONE
6023O0 o
o
ß
Figure
lb. ShaLlow
seismicity
(<40 km) for the region
of Figure
la during
the period
1942-1994
(May 30) [New
Zealand
Seismological
Observatory,
1994].
Symbols
are
scaled
with
magnitude,
and
the
catalogue
is complete
above
M 3.0 since
1988;
M 4.0 since
1964;
M 5.0 since
1942.
The
dense
clusters
of seismicity,
north
of the Hope
fault
and
west of the PPAFZ, are associated with earthquakes of M w 5.9 and M w 6.7, in 1990 and 1994, respectively [Ander-
son
et al., 1993;
,•rnad6ttir
et al., in press].
Canterbury exhibit evidence of Holocene displacement [Gregg, Oligocene and lower Miocene timestone beds across the Mount
1964],
and since
1964, the New Zealand
national
seismograph
Grey
block
and
vector
analysis
of slip
across
Mount
Oxford
(Figure
network has located frequent earthquakes of small to moderate 2) (H.A. Cowan et al., manuscript in preparation 1995).
magnitude (M<5.4) along the PPAFZ, making this one of the better The Porter's Pass fattit forms the principal western element of
defined
surface
fault zones
in New Zealand
[Reyners,
1989].
Data the PPAFZ
and is associated
with Holocene
offsets
near
Porter's
from
the
instrumental
catalogue
are utilized
later
in this
paper
for 'Pass
[Speight,
1938;
Wellman,
1953;
Berryman,
1979;
Coyle,
1988;
comparisons of recurrence parmeters for large earthquakes within
and
between
the
Hope
fault
and
PPAF'Z
regions.
Porter's
Pass-to-Amberley
Fault Zone
The PPAF-Z extends east-northeast from the Southern Alps and passes into a fold and thrust belt near the town of Amberley and
offshore
(Figures
la and 2) [Barnes,
1994;
Nicol et al., 1994].
Principal elements of the PPAFZ bound the northern margin of the
Canterbury
Plains
where
the foothills
of the Southern
Alps
rise
to
2000
m. The PPAF'Z
is defined
by zones
of crushed
Torlesse
greywacke that strike east and northeast, at a tugh angle to the
regional
NW-SE
grain
of Mesozoic
deformation
[Gregg,
1964],
and
locally
cut
through
the
late
Cretaceous-Cenozoic
cover
sequence,
disrupting
late
Pleistocene
and
Holocene
landforms.
A total
offset
of
<2 km across
the PPAFZ
is inferred
from
the
strike
separation
of
Knuepfer, 1992]. New data on late Holocene faulting from this area are presented here. Farther east, the Porter's Pass fault bifurcates around Mount Oxford, and splays extend northeast and east to Lees Valley and the northern Canterbury Plains, respectively (Figure 2). A surface trace in Lees Valley is associated with scarps up to 6 m high on Holocene alluvial fans [Gregg, 1964; Garlick, 1992], and along the southern flank of the Ashley Range, major zones of crushed rock diverge to the east and southeast (Figure 2). The east striking zone extends into a region dominated by thrust faulting and folding centred on Mount Grey, whereas the southeast striking zone passes beneath the Canterbury Plains to the Cust anticline and Ashley fault and may extend offshore to the Pegasus Bay fault zone farther east [Kirkaldy and Thomas, 1963; Herzer and Bradshaw,
6024
COWAN
ET AL.: PALEOSEIS•CITY
IN A NEWLY
FORMED
FAULT
ZONE
Lees
Valley
FAULTS inferred
strike-slip •--
thrust •
surface trace xxxxxx
FOLDS
syncline
•
anticline
•
•
... Basement
I
I Cover
sediments
I
Oxford I
I I
L
'""
Ashley
fault '
t
...
Fig. 4
LANDSLIDES Dated Undated
I
© o.•--•o-•
.•o%3
© o-oo_1
___
•_ _ i.i:• urban
aroa
highway ß 2195 olovation (m)
i
Canterbury Plains
1Okra
I I
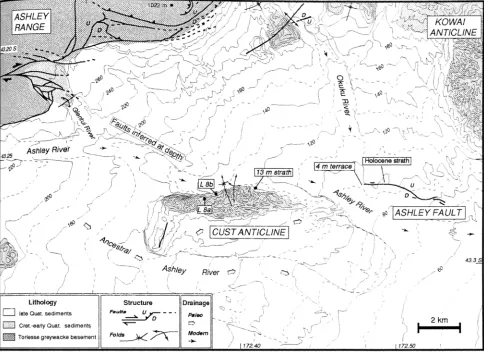
Figure 2. Structural elements of the Porter's Pass-to-Amberley Fault Zone (PPAFZ) in North Canterbury, New Zealand, showing the locations of main faults, folds, and prehistoric landslides. Faults that are depicted without sense-of-movement indicators represent mapped zones of crushed rock. Numbered landslides correspond to data in Table 2 and Figure 6. Thin dashed lines denote the margins of active folds on the Canterbury Plains. Abbreviations are KA, Kowai anticline; CA, Cust anticline; MO, Mount Oxford, and MG, Mount Grey. The locations of Figures 3,
4, and 5 are indicated.
N
Holocene Faulting in the PPAFZ
Porter's Pass Fault
Studies near Porter's Pass, where the PPAFZ is relatively narrow,
indicate a Holocene slip rate of ,--4 mm/yr [Berryman, 1979] and 2.7-3.8 mm/yr [Knuepfer, 1992]. A few hundred meters north of Highway 73 at Porter's Pass (Figure 2), a radiocarbon date from the lower part of a peat column accumulated behind the surface trace indicates that the surface trace probably formed 2000-2500 years
B.P. (Table 1).
In a highway embankment on the south side of the pass, two buried softs, each containing charcoal, are offset across the fault (Figure 3). The crosscutting relationships together with the stratigraphy indicate possibly two ruptures during the Holocene (Table 1). The older of the two soils, offset across fault 1, may
reflect
a rupture
between
7000 and
9000 years
ago.
Faults
2 and
3
have displaced both soils at least once since 7000 years ago.
Cust Anticline
height of 150 m on the northern flank of Cust anticline. A steep north-to-south gradient of Bouguer gravity anomalies across the anticline has been attributed to the presence of a fault with
significant
throw
[Kirkaldy
and
Thomas,
1963].
We infer
that
this
fault
is connected
to the southeast
striking
extension
of the
Porter's
Pass fault at Glentui River, which appears to control the fl0w
direction
of the Ashley
River in the area immediately
to the
northwest of Cust anticline (Figure 4).
Late
Quaternary
uplift
of Cust
anticline
is evident
from
drainage
features
preserved
across
the crest
of the fold,
which
is capped
by
two late Pleistocene
loess
sheets
[Trangmar,
1987].
Ancestral
channels of the Ashley River are incised into the loess sheets
(Figure
4), so
the
diversion
of Ashley
River
to its present
course
has
presumably
accompanied
uplift at the western
margin
of the
anticline, possibly during the early Holocene since the youngest
ancestral
channel
has no loess
cover.
The uplift was
probabl5
caused
by rupture
on a fault
that
is associated
with
a 1.5-
kin-
long
surface trace (Figure 4) and a large (-500 m) offset in basement [Kirkaldy and Thomas, 1963].
Probable
late
Holocene
ruptures
in this
area
are inferred
from
The
Cust
anticline
and
Ashley
fault,
located
on
a major
southeast
dated
landslides
and
the
timing
of Ashley
River
downcutting
along
splay
of the
PPAF-Z,
are
important
sites
for palcoseismic
the
northern
flank
of
the
anticline.
Wood
collected
from
the
base0f
investigation
(Figures
2, 4).
The
recent
nature
of
the
deformation
in gravel
deposits
overlying
the
strath
of a terrace
13 + 12
m
above
this
region
is indicated
by
the
presence
of
consolidated
Pliocene-
the
Ashley
River
was
dated
at
between
2100
and
2500
calibrated
early
Quaternary
siltstone
and
conglomerate
which
crops
out
to a radiocarbon
years
old
(Table
1 and
Figure
4), implying
an
average
6026 COWAN ET AL.: PALEOSEISMICITY IN A NEWLY FORMED FAULT ZONF_,
ß .'.'.'.'.' ' Nothofaguscharcoa!'.'.' ß ... 500-700 •,ea½s B.'P.'.'-'- '.: .
'•..'.',
,'-'.'.'-'.'.',
16900
:L--90
I
ß '- ! ' ";' "';"'''";"'I(NZ 7053)1
ß 's0il'.' .'
ß ' ' i' i' ib•ri•d
''];: '
ß .-.'.'.- ... ß
...
...
ß
...
,.t-11o . ß
ß .
.... .SOil.'.'.' ß '.' .'.'.'
... .-..
'-'-'-.-'.IF
AuLT2I--•.':
-:-:-:-
Figure 3. Age relations between faults and buried soils exposed in a road embankment within the Porter's Pass fault zone at Porter's Pass. See Figure 2 and Table 1 for site location and description, respectively.
downcutting rate of 5.7 _+ 1.4 m/kyr. The height of the terrace strath above the present floodplain presumably reflects an element of tectonic uplift and fold growth, because upstream the fiver is in equilibrium, whereas downstream it is aggrading [Cowan, 1992], Whether or not the downcutting by Ashley River reflects continuous or episodic uplift is unclear, but additional data from landslides at this locality (Figure 4) suggest that the first increment of uplift was induced by coseismic rupture in this sector of the
PPAFZ.
Ashley Fault
The Ashley fault offsets Pleistocene and Holocene terraces of the Okuku River east of Cust anticline and has a surface trace length of 4.5 km [Brown, 1973; Bero'man, 1979] (Figure 4). The fault is
downthrown to the south, with throws of 1-4 m on a late Pleistocene
aggradation surface and 0.5-1.5 m on a Holocene strath terrace [Cowan, 1992]. Differences in the throw of the fault on these two surfaces suggest at least two ruptures since the formation of the late Pleistocene aggradation surface. Variations in throw which accompany slight changes in the strike of the fault, are consistent with a minor fight-lateral component of displacement, but no unequivocal offsets have been documented.
The height of the Holocene strath terrace offset by the Ashley fault is similar to the dated (i.e., 13 m) strath above Ashley River, so the terraces may be of approximately equal age. The fault trace across the Okuku River strath is not significantly degraded, so the fiver presumably abandoned the surface prior to, or at the time of, faulting. The oldest Okuku River terrace not offset by the fault (its riser truncates the surface trace) is about 4 m above the active floodplain (Figure 4). If the average downcutting rate of the Okuku
River is similar to the Ashley River, then the unfaulted terrace formed '-'600-900 years ago. The available data thus imply that the last rupture of the Ashley fault postdated 2500 years B.P. and could have accompanied the growth of Cust anticline prior to 600-900 years B.P.
Mount Grey Fault
The Mount Grey fault comprises a north dipping thrust along the south side of Mount Grey (931 m) in the eastern part of the PPAFZ (Figure 2). The fault loops around the eastern flank of Mount Grey and bifurcates, forming an oblique, left-lateral tear fault that strikes north and dips to the west, and against which the Tertiary cover sequence has been overturned [Wilson, 1963]. The fault is exposed in a number of streams and forms a prominent surface trace and
hillside bench hollow, behind which scree and boulders have
accumulated.
Radiocarbon and weathering-find dates delineate two surface rupture events within the last 2500 years (Table 1). Evidence for the oldest recognized event was obtained from a stream bank exposure of the fault (Figure 2, 5), where wood and peat were preserved on the surface of a debris flow, offset across a fault scarp that is now
buried
3 m below
the
present
ground
surface.
The
wood
was
not
in
growth
position
and
was
buried
beneath
younger
colluvium,
which
in turn
was
offset
by the fault.
A soil,
developed
on the debris
fl0w
and containing
a trace
of charcoal
of unknown
age defined
an
apparent
vertical
offset
(downthrown
to the west)
across
the
fault.
We could
not
discern
from
the
field
relationships
whether
or not
this
buried
soil
was
deformed
or had
merely
developed
on an exposed
fault
scarp
at a later
date.
The
soil
was
buried
beneath
another
debris
COWAN ET AL.: PALEOSEISMICITY IN A NEWLY FORMED FAULT ZONE 6027
KOWAI ANT/CLINE
-"-" / ..."*
I
... -- , ,
• - -•
.
/
•% , _, -'_ I•//,1',;•%¾ l •½ ... •"'•1 ,- /
,
ß
__
•.• " k ', • •---- ) • ... - •
I ,
,,e
Quat.
sediments
'• Cret-early ß Ouat sediment• ' -- __ •
:'.:•
Torlessegre•ackebasement
Fold• •11
)
:• % ;
,,
"
•1 ' I •72-•
'•
....
Figure 4. Map of the northern Canterbury Plains showing the relationships between the Cust anticline, Ashley fault, and range-bounding elements of the PPAFZ. LSa and LSb indicate locations of the radiocarbon dates from landslide 8 (Table 2 and Figure 6). Topographic contours are reproduced at 20-m and 10-m intervals (thin solid and thin dashed lines, respectively) from NZMS 270, sheets L35 and M35, by permission of the Department of Survey and
Land Information, New Zealand.
in growth position. A radiocarbon date of 182 + 60 years B.E obtained from an outer portion of the tree stump (Table 1) indicated a minimum age for the buffed soil and the last surface rupture
recognized at this site.
Chips were collected from Torlesse sandstone boulders and cobbles exposed at the ground surface along the fault trace north of
the
stream
bank
locality,
and
weathering-rind
ages
for these
were
calculated using the method of Chinn [1981] and calibration curve
of
McSaveney
[1992]
to evaluate
the
timing
of site
disturbance.
Two
modal rind thicknesses were obtained and the ages (Table 1) are in good agreement with the time intervals for which surface rupture is
inferred
from
the
radiocarbon
ages.
The
available
data
collectively
imply
surface
rupture
on
the
Mount
Grey
fault,
between
2300-2400
years B.P. and 300450 years B.E
Pre!fistoric
Landslides of the PPAFZ
Landslides
provide
additional
data with which
to assess
the
recurrence interval of large prehistoric earthquakes in the PPAFZ.
Twenty
landslides
have
been
identified
within
the PPAb-Z,
and
the
ages for 10 of these have been determined from radiocarbon and
weathering-rind
dating
(Table
2). The landslides
are mostly
large
(0.2-10
x 106
m
3) rock
avalanches,
derived
from
outcrops
of
Tofiesse basement (Figure 2). The data indicate a clustering of ages between about 500 and 700 years B.P., with others scattered back to more than 7000 years B.P. (Table 2 and Figure 6).
Landslides in the range 500-700 years B.P. are relatively uniformly distributed along the PPAFZ and are well preserved. However, there are insufficient data to confirm a similar spatial pattern of landslides at 2300 years or older, which presumably reflects the removal of landslide debris by erosion. A large landslide identified on the north limb of Cust anticline (Figure 4), which contained whole trees and an articulated skeleton of the largest species of extinct moa, Diornis giganteus [Cowan, 1992], was radiocarbon dated at circa 2300 years B.P. (Table 2). This age is the same as the nearby strath terrace of Ashley River (Figure 4), and we surmise that both the landslide and the onset of fiver downcutting accompanied coseismic uplift of Cust anticline.
COWAN El' AL.: PALEOSEISMI•• I:N A NEWLY FORMED FAULT ZONE
/'-
:.••...:...i•ii•!!::::i::::::•:!ii!i::::•::::ii•!ii•::•!•i;!!!!i!!i::i:•::•
'•.
'-':-
'-:'
ß
ß
ß
-
l Debris
f•ow]
===========================================================================================================
:::::::::::::::::::::::::::::::::::::::::::::::::::::::::::::::::::::::::
•Buried
soilsJ
======================================================================================================================================================
.. _ • • _ _ _ '• ... •:.:::.•:::::.• ... :::::::::::::::::::::::::::::::::::::::::::::::::::::::::::::::::::::::::::::::
x '•.'.•1::::::•.: .,•. • -:.:.:.:.:.:-:.:.:.:-..:-.-'-:-'-' ß ....:.:.:.
[Debris
flow
]
,..,
•
•
'•:-',:.:::s.
...
'"'
,
' ....
' "
':':'
ß
I Co•uviuml
' '- :"-• ....
=======================================================
-I J: '
/
...,•,..--,',',':•-. ================================================================== :::::::::::::: ::::::::::::::::::::::::::::: "::::::i::':i:::'::- '.':-,-"•;:'•...
...
:::
...
:•
...
:...•:::::::::::.•
...
::I::::::
...
:.<:""'
'••":....
"•:••...'•...-::••:..,.:,.•_
"'"'
============================= :::::::::i::::::: :::::::::::::i:::!: ::::::::::::::::::::::::::::::: :::::: ::::::i::::::::..,:::: :::i::: :::" :•..'. ... :::•,...-':••:•....:... •:••...•...,• :-,..--. ... ,•'" •'-"-'•'-' '' ._...:•....)
•.x::':::::::::::::::::::::::::::::::::::::::::::::::::::::::::::::::::::::::: ... ::::::::::::::::::::::::::::::::::::::::•... T :::::::::::::::::::::::::::::::::::::::::::::::::::::::::::::::::::::::::::::::::::::::::::::
... : ... : ... :: ... : ... :::: ... :: ... :::: Crushed oreywacke} ... :<• ... : ... .< ... : ... :::--•: ... • ... :: ...
::::::::::::::::::::::::::::::::::::::::::::::::::
::::::::::::::::::::::::::::::::
-
:::::::::::::::::::::::::::::::::::
':':':':':
:':" ';(:':'"':':':"
W "':'":'"":'"'""'""
...
::::::::::::::::::::::::::::::::::::::::::::::::::::::::::::::::::::::::::::::::::::::::::::::::::::::::.,::
...
:,:
...
...,:.
...
...
:::::::::::::::::::::::::::::::::::::::::::::::::::::::::::::::::::::::::::::::::
...
...
,
...
:::::::::::::::::::::::::::_'-"
.:.:.:.:...•:.:.:.. :.:.:.:,.. • ...-x..-.'.'.'-'.' ... .'.'.'.'.v.'.'.:.•'.'-'.'.'..,i.'-'.'.'.'.'.'-'.'-' ::::::::::::::::::::::::::::::::::::::::::::::::::::::::::::::::::::::::::::::::::::::::: ... : ... :: ... ,:: ... : ... :::::::::::::::::::::::::::::::::::::::::::::::::::::::::::::::::::::::: ... .<: ... '"" "'"'"'""'""" '""•••••••::i..• ::::::::::::::::::::::::::::::::::::::::::::::::::::::::::::::::::::::::::::::::::: ...
I
]
--•
'" [Stream
channel
i -•
Mt
Grey
Fault 2330
+_40
yrs
B.P
0 . 1 (NZ 7852)
metres
Figure
5. Stratigraphy
and
conventional
radiocarbon
ages
associated
with samples
from an exposure
of the Mount
Grey fault in a stream bank on the eastern flank of Mount Grey. See Figure 2 and Table [ for site location and
description, respectively.
documented in the PPAFZ (Figure 6). The ages for three landsfides from the central Southern Alps do overlap with those of the PPAFZ, in the range ~2200-2450 years B.P., but fault data indicate probable rupture of the PPAFZ during that period (Table 1).
Six landslides with ages between 500 and 700 years B.P. are located within 1 km of the major faults of the PPAFZ, and two of these bury the trace of the Porter's Pass fault near Porter's Pass (Figure 2, landslides 1 and 2 ). By contrast, only two landslides within this age range were dated by Whitehouse and Griffiths [1983] in the Southern Alps farther west. Collectively, the spatial distribution of these data suggests that if the landslides were seismically triggered, they are more likely related to local rupture of the PPAFZ rather than to a regional event on the Alpine Fault, an
interpretation
favored
by W.B. Bull (personal
communication,
1994) based on recent 1ichenometric dating of landslides in the Southern Alps.
The interpretation
of landslide
distributions
in paleoseismology
involves two assumptions: (1) that landslides were triggered coseismically; and (2) that all landslides of a similar age were coseismic with the same event. Landslides have been triggered by
all large
(M >7) historic
earthquakes
in New Zealand,
but many
period of 3 months and were followed 39 years later by the M, 7.4, Mw 7.1 Inangahua earthquake [Adams et al., 1968; Anderson et al., 1994]. It is doubtful whether each of these events could be differentiated from the geological record using radiocarbon dating had they occurred during prehistoric time, although dendrochronology and lichenometry could potentially discriminate the 1929 and 1968 events [e.g., Bull et at., 1994]. Second, as the elapsed time since the creation of a landform increases, so too does the likelihood that it will be destroyed, modified, or buried by subsequent processes. Furthermore, periods of non deposition may conceal the occurrence of rupture events at a given site, and assumptions of continuous sedimentation are difficult to test and are rarely proven [e.g. Doig, 1990; Cowan and McGlone, 1991]. We cannot rule out periods of non deposition at any of the sites described in this study, but the temporal clustering of landslides in the range 500-700 years B.P. and their close proximity to the PPAFZ suggest that the most recent rupture of this zone probably occurred during that period. The landslides attributed to earlier events (2000- 2500 years B.P. and 7000-9000 years B.P.) are much less abundant, indicating that in New Zealand's mountainous terrain, landslide data may only be useful for characterising paleoseismicity for up to
large landslides
in seismically
active
regions,
including
the 2000-3000years
B.P.
Southern
Alps, have not been triggered
by earthquakes
[e.g.,
Plafker and Ericksen, 1978; McSaveney et al., 1992; McSaveney, 1978, 1993]. In the absence of independent evidence, the coseismic interpretation of prehistoric landslides must therefore be regarded as tentative [Whitehouse and Griffiths, 1983].
For both fault traces and landslides there are at least two reasons
why evidence
for large
palcoearthquakes
could
be sparse.
First,
it
must be remembered that few dating techniques can discriminate
events
separated
by a few years
or decades,
a point
exemplified
by
three historic earthquakes in northern South Island. Both the Ms 7.8
Bullet
and
M s 7.0 Arthur's
Pass
earthquakes
of 1929
[Henderson,
1937;
Speight,
1933;
Dowrick
and Smith,
1990]
occurred
within
a
Magnitude Estimates
The dating
of surface
fault
ruptures
provides
a check
on
the
likelihood
that a given group
of landslides
was triggered
coseismically,
but
the
estimation
of magnitude
is problematic
in the
absence
of data that define
the rupture
dimensions,
and
these
parameters
are poorly
constrained
for the PPAb-Z.
Relationships
between
landslide
distributions
and earthquake
magnitudes
have
been
proposed
based
on global
compilations
of data
from
historic
events
[Keefer,
1984], but these
probably
do not provide
an
COWAN ET AL.: PALEOSEISMICITY IN A NEWLY FORMED FAULT ZONE 6029
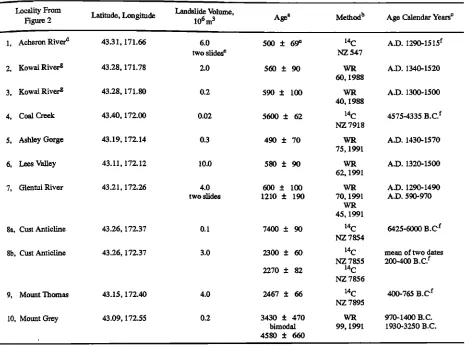
Table
2. Description
of Dated
Landslides
From
the
Porter's
Pass-Amberley
Fault
Zone
Locality From Landslide Volume,
Latitude, Longitude Age a Method b
Figure 2 10 6 m 3 Age Calendar Years ø
1, Ach cron Rivera 43.31,171.66 6.0 500 +_ 69 e
two slides e
2, Kowai River • 43.28, 171.78 2.0 560 + 90
3, Kow aiRiver• 43.28,171.80 0.2 590 + 100
4, Coal Creek 43.40, 172.00 0.02 5600 + 62
14C A.D. 1290-1515 f
NZ 547
WR A.D. 1340-1520
60, 1988
WR A.D. 1300-1500
40, 1988
•4C 4575-4335 B.C. f
NZ 7918
5, Ashley Gorge 43.19, 172.14 0.3 490 + 70 WR A.D. 1430-1570 75, 1991
6, Lees Valley 43.11,172.12 10.0 580 _+ 90 WR A.D. 1320-1500 62,1991
7, Glentui River 43.21,172.26 4.0 600 +_ 100 WR A.D. 1290-1490 two slides 1210 + 190 70, 1991 A.D. 590-970
45, 1991
8a, Cust Anticline 43.26, 172.37 0.1 7400 + 90 i4C 6425-6000 B.C 'f
NZ 7854
8b, Cust Anticline 43.26, 172.37 3.0 2300 + 60 14C mean of two dates
NZ 7855 200-400 B.C. f
2270 + 82 14C
NZ 7856
9, Mount
Thomas
43.15,
172.40
4.0
2467 + 66
I•*C
400-765
B.C
'f
NZ 7895
10, Mount Grey 43.09, 172.55 0.2 3430 _+ 470 WR 970-1400 B.C.
bimodal 99, 1991 1930-3250 B.C.
4580 +_ 660
See Table 1 footnote for explanation of weathering-rind dating errors.
a Years before A.D. 1950, with modal weathering rind ages rounded to nearest 5 years.
b Symbol •4C denotes conventional radiocarbon age and sample numbers; WR is weathering rinds, followed by number of rinds and year (A.D.) of
measurement. 14
e
Symbol
C
ages
(,calendar
years
A.D./B.C.).
d Data from Burrows [ 1975].e Data from W.B. Bull (written communication, 1994).
f Calibrated radiocarbon ages (95% confidence levels unless otherwise stated) based on compilation by $tuiver and Reimer [ I986] of 20-year tree ring data for the period 7210 B.C. to A.D. 1950, with offset of-30 radiocarbon years as recommended by $tuiver and Pearson [ 1986] and Pearson and
$tuiver [1986].
•Data from Coyle [1988].
earthquakes.
Only the largest
prehistoric
rock falls may be
The threshold
magnitude
for surface
rupture
and coseismic
recognized,
and
variations
in earthquake
source
mechanism
and landsliding
in the
PPAPZ
is unclear.
However,
since
all historic
regional
geology
could
strongly
influence
the distribution
of eamhquakes
larger
than
magnitude
M •-7 in northern
South
Island
landslides. For example, the 1929 and 1994 Arthur's Pass earthquakes each triggered rock fails over an area comparable to many global events of similar magnitude (M. McSaveney, personal communication, 1995), but the areas affected by large landslides of
the
1929
Buller
and
1968
Inangahua
earthquakes
[Adams,
1981]
are
smaller
than
might
be expected
from
Ke•er's
global
catalogue.
The
Bu!ler
and
Inangahua
earthquakes
occurred
in a region
composed
largely
of crystalline
Paleozoic
rocks,
in contrast
to the
weakly
mtamorphosed
greywacke
of the Southern
Alps. These
'differences,
together
with variations
in focal depth,
rupture
directivity,
and topographic
effects
illustrate
some
of the
unities that
would
accompany
the estimation
of earthquake
magnitudes
from prehistoric
landslide
distributions.
The
uncertainties
naturally
would
be compounded
by incomplete
aamp!ing
of the
spatial
distribution
of prehistoric
landslides.
have been accompanied by landslides [McKay, 1902; Henderson, 1937; Speight, 1933; Adams et al., 1968] we infer that the late Holocene landslides in the PPAFZ were probably triggered by earthquakes of similar magnitude. More precise estimates of magnitude would depend critically on detailed knowledge of the sub-surface fault dimensions and segmentation [Wells and Coppersmith, 19941, parameters that are poorly defined in this hybrid strike-slip and thrust fault zone. Indeed, lateral variations in fault behavior are to be expected, and historic earthquakes elsewhere [e.g., Arnaike, 1987: Stein and Yeats, 1989; Hull, 1990; Stein and Ekstrem, !992; SrnaIley et aI., !993; Anderson et aI.,
6030 COWAN ET AL.- PALEOSEIS•CITY IN A NEWLY FORMED FAULT ZONE
...
•. pPAFZ"
raPix,
re
-,•:
N:34
• • 8-
• 0
o d
<• • •v •- CA+A
N • --MG
• • rag* -- PP
• • • i• I I I I
' 'D m -- G
• I'2 •9
o 10 10
• • • • 7 ' • 8b ...
I I ... • ß I
0 1000 2000 3000 4000 5000
Years B.P.
Figure
6. Temporal
distribution
of landslides
and
fault
ruptures
in the
PPAFZ,
and
a comparison
with
dated
land-
slides
from
the
Southern
Alps
[Whitehouse
and
Grifflths,
1983].
Weathering-rind
ages
from
the
Southern
Alps
have
been
recalibrated
using
the
calibration
curve
of McSaveney
[ 1992].
Landslide
numbers
correspond
to those
in Table
2 and
are
located
on
Figure
2. Abbreviations
are
A, Ashley
fault;
CA,
Cust
anticline;
MG,
Mount
Grey
fault;
PP,
Porter's
Pass
fault.
Asterisks
denote
fault
ruptures
dated
by weathering
rinds.
Refer
to Tables
1 and
2 for details
of
fault
ruptures
and
landslides,
respectively.
at the eastern end of the PPAFZ and farther north, where late
Holocene
surface
traces
are preserved,
but
locally
display
vertical
offsets
that
are
anomalously
large
with
respect
to fault
length
and
for which no landslides have been correlated [Cowan, 1994; A. Nicol et al., unpublished data, 1991]. Uncertainties in the assessment of fault dimensions and the likelihood of hidden faults
in this
young
fault
zone
also
complicate
the
estimation
of slip
rate
and potential slip per event. Local variations in fault kinematics are
evident
from
the
differential
uplift
at Cust
anticline
(this
study)
and
in the fold and thrust belt farther east [NicoI et aI., 1994]. Davis and
Namson
[1994] and Shaw and Suppe
[1994] have shown
that
deta•ed
structural
analysis
can
reveal
the
presence
of hidden
faults,
and similar
work in progress
in the PPAFZ
(H.A. Cowan
et al.,
manuscript
in preparation,
1995)
may
provide
further
insight
into
the
kinematics
and
subsurface
structure
of the
zone,
especially
if
combined with recent observations of geodetic strain (C.F. Pearson
et al., Strain
distribution
across
the Australian-Pacific
plate
log N(M) = a - am (1)
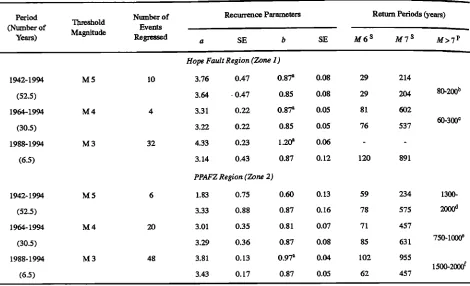
where N(M) is the cumulative number of earthquakes of magnitude equal to or greater than (M); a defines the rate of occurrence, and b is the exponential decay with increasing magnitude, implying self-similarity [e.g., King, 1983]. The parameters a and b are constants of the seismicity model and are computed from a catalogue of historical seismicity. Equation (1) may be integrated to obtain a cumulative exponential distribution, truncated at a maximum magnitude for a given set of faults or
volume of crust, such that
N = No[10
a(Mø'
•) - 10
b(Mø'
Mmax)]
(2)
N O is the number
of earthquakes
of magnitude
M o or greater,
where
M o is an arbitrary
threshold
magnitude
[e.g.,
Youngs
and
Coppersmith,
1985]. When combined
with an appropdm
attenuation
expression,
the seismicity
model
may
be used
to derive
boundary
in the
central
South
Island,
New
Zealand,
from
1992
GPS return
periods
or
probabilities
of exceedance
for
specified
levels
of
and earlier
terrestrial
observations,
submitted
to Journal
of ground
motion.
This
classical
hazard
analysis,
advanced
by
Cornell
Geophysical
Research;
hereinafter
Pearson
et al.; submitted
[1968],
has
been
applied
widely
in seismic
hazard
assessment
[•
manuscript, 1995). Here, we restrict our discussion to the
implications
of available
historical
and palcoseismic
data for
analysis of seismicity rates and fault behavior.
Seismicity
Rate Analysis
The
traditional
approach
to seismicity
rate
analysis
is to assume
a uniform
spatial
distribution
of earthquakes
and
an exponential
distribution
of magnitudes
of the
Gutenberg-Richter
form:
J.G.
Anderson
et aI., 1993]
and
in New Zealand
by,
among
othem
Peek
et al. [!980] and
Smith
and
Berryman
[1986].
Studies of individual faults have shown that the recurrence r•

![Figure lb. ShaLlow seismicity M 3.0 since 1988; M 4.0 since 1964; M 5.0 since Zealand son et al., 1993; west of the PPAFZ, are associated (<40 km) for the region of Figure la during the period 1942-1994 (May 30) [New Seismological Observatory, 1994]](https://thumb-us.123doks.com/thumbv2/123dok_us/9623511.1490462/3.610.121.487.71.408/figure-shallow-seismicity-zealand-associated-figure-seismological-observatory.webp)


![Figure 6. Temporal been Porter's fault ruptures distribution of landslides and fault ruptures in the PPAFZ, and a comparison with dated land- slides from the Southern Alps [Whitehouse and Grifflths, 1983]](https://thumb-us.123doks.com/thumbv2/123dok_us/9623511.1490462/10.610.124.495.57.352/temporal-ruptures-distribution-landslides-comparison-southern-whitehouse-grifflths.webp)