Eurasian Journal of Business and Economics 2019, 12(23), 63-78.
Quality in e-Government accounting services:
A model of relationships between e-service
quality dimensions and behaviors
Cemil KUZEY
*, M. Sait DINC
**, Ali H. GUNGORMUS
***, Lokman INCIRKUS
****Received: April 20, 2019 Revised: May 14, 2019 Accepted: May 20,2019.
Abstract
The purpose of this study is to examine the relationship between perceptions held by accountants regarding the e-service quality dimensions of the e-government website in connection with their behavioral and praising intentions. Using the survey method, 203 responses were collected from accountants in Turkey. A partial least square structural equation model was constructed to test both the reliability and validity of the measurement as well as the structural model. The results showed that several e-service quality sub-dimensions such as graphical quality, emotional benefits, and ease of use and control have a positive and significant impact on behavioral intention and praising intention. The study did not find support for the possible effect of layout clarity upon behavioral intention and praising intention.
Keywords: e-service quality; accountants; partial least square structural equation model.
JEL Classification Codes: M38 UDC:
331.07
DOI:
https://doi.org/10.17015/ejbe.2019.023.04
*
Arthur J. Bauernfeind College of Business, Murray State University, Murray, USA. Email: cemilkuzey@gmail.com
**
American University of the Middle East, Kuwait. Email: Muhammet.Dinc@aum.edu.kw ***
1. Introduction
Recent technological developments in the computer and internet world have brought change and transformation in both the public and the private sectors. The main purpose for using new technologies such as new apps in these sectors has been to enhance effectiveness of service deliveries. In this regard, public organizations have started to use information communication technologies, in particular e-services, in order to enhance their organizational efficiency and to improve their service quality standards on behalf of citizens. Since early 2000, public organizations in Turkey have also begun utilizing e-services for their service deliveries. Because the provision of e-services through the WebPages of each public organization had begun posing technical problems to citizens, all e-services of the public organizations in Turkey have been provided through e-government (www.turkiye.gov.tr) since 2008. In the following years, citizens hesitated when using e-government, due to technical problems as well as their habitual ways of using the traditional services. However, demand for the use of the e-government service has increased in recent years as a result of the fact that Turkish citizens have become aware of improvements in the service and ease of usage.
Accounting professionals have also been influenced by these technological improvements in Turkey. Among the changes created by these developments is the fact that traditional accounting applications have been transferred to information technology, with data registrations being input into computers. This has produced quick, reliable accounting processes, helping both accountants and customers access accounting information swiftly. With the advent of e-government online services being more widely used, online taxation services are now being utilized through integrating internet-based technologies. Following this, tax returns have begun being approved through online services. Finally, all offline processes have been transformed into online taxation e-processes by adding e-bills to the online services. The Ministry of Finance in Turkey has transformed all offline processes into online e-processes in order to minimize tax evasion, to collect taxes swiftly and to decrease the workloads undertaken by the tax office.
2. Conceptual Framework and Hypotheses Development
2.1. Conceptualizing E-service quality
The quality of electronic services (QES) was described by Zeithaml, Parasuraman, and Malhotra (2000) as “the extent to which a website facilitates efficient and effective shopping, purchasing, and delivery” (p. 11). Although this is one of the most cited definitions, it has been criticized by some scholars (Fassnacht & Koese, 2006; Gummerus et al., 2004) for two main reasons. First, they found that the definition created by Zeithaml, Parasuraman, and Malhotra was too narrow because of its concentration on online shopping. Second, the “website” was specified as the only reference object of quality. The website is very important because it can be useful for research which focuses upon website related issues, but QES needs to encompass more than the website. Therefore, to be specific, QES can be defined as the degree to which an electronic service is able to effectively and efficiently fulfill relevant customer needs (Fassnacht & Koese, 2006).
In the last two decades, there have been several studies contributing to the theoretical advancement of service quality significantly (see Brady & Cronin, 2001; Dabholkar et al., 1996; Dabholkar et al., 2000; Dagger et al., 2007; Rust & Oliver, 1994). Within these conceptualizations, some studies have focused on service quality from hierarchical and multi-dimensional perspectives. The suggestions from these works were that the construct should be viewed as being of a higher order that has specific dimensions related to sub-dimensions (e.g. Carman, 1990; Dabholkar et al., 1996; Brady & Cronin, 2001). In this context, “hierarchical” means that sub-dimensions are treated as first-order constructs, whereas dimensions are treated as being second-order constructs of service quality. For example, in Rust and Oliver (1994)’s conceptualization of service quality, three dimensions were used: service environment (physical ambiance), service delivery (interaction), and service product (outcome). Brady and Cronin (2001)’s study, which was based upon the work of Rust and Oliver (1994) and Dabholkar et al. (1996), introduced a hierarchical conceptualization of service quality with three dimensions: environment quality, delivery quality, and outcome quality, with nine related sub-dimensions.
factors in order to capture the e-service quality construct. To date, Fassnacht and Koese (2006) have been the only researchers adapting a hierarchical approach to capturing e-service quality evaluations at the sub-dimension level and the dimension level, as well as using a separate overall evaluation of e-service quality.
2.2. Environment Quality
Fassnacht and Koese (2006) divided the environment of websites into two sub dimensions: graphic quality and clarity of layout. Graphic quality captures the visual representation of relevant user interface elements, while clarity of layout refers to the usefulness of the design structure of the user interface. In Santos (2003)’s exploratory study, elements such as graphics, pictures, and images were deemed to be providing improvements in quality. Structure and layout were articulated as the helpful organization and presentation of content and information placed on the website. Therefore, elements such as simplicity, clearness, and consistency were considered to be providing attractiveness within the structure and layout.
Regarding the website role in e-service quality, Chen et al. (2009) paid attention to three dimensions which might affect consumer usage intention; a user-friendly interface provided by the website which provides ease of usage, search capability, rich content and interactivity. The environment quality was anticipated to improve business performance. Lee and Kozar (2006), in their study focused on the website quality effect on e-business success by using four important dimensions: information quality, service quality, systems quality, and vendor-specific quality.
2.3. Delivery Quality
2.4. Outcome Quality
Emotional benefit was defined as “the degree to which using the service arouses positive feelings” whereas functional benefit can be defined as “match between service and its value proposition” (Fassnacht & Koese, 2006). Lai (1995) also defined the emotional (affective) benefit as being the “product's capacity to arouse feelings or affective states” (305). In the same study, functional quality was defined as the product’s capability in terms of functionality, utility, and physical performance. In the study of Fassnacht and Koese (2006), it was seen that the three sub dimensions of e-service quality had differing contributions. The further functional benefits leading to the final outcome was remarkable. In the study of Carlson and O'Cass (2011), these two dimensions also exhibited strong, yet differing constructs. Thus, these dimensions deserve to be measured and evaluated differently.
Most prior research focused on the relationship between e-service quality, customer satisfaction, and behavioral intention, which included word-of-mouth communication, revisiting the site, and purchase intentions (Gounaris et al., 2010). There were also some studies revealing the relationship between trust, satisfaction and e-loyalty (Lim, 2015; Ladhari & Lecrec, 2013). Within the context of accounting, some studies examined the e-service quality dimensions and satisfaction in relation to accountants. For example, a study conducted with 351 certified accountants found that some dimensions of e-service quality such as empathy, tangibility and convenience contributed towards their satisfaction (Carlos, Macedo, & Monteiro, 2007). With regard to e-government service quality, several studies were conducted recently (Papadomichelaki & Mentzas, 2012; Sá, Rocha, & Cota, 2016a; Sá, Rocha, & Cota, 2016b; Janita & Miranda, 2018). However, some of these studies were done in Turkey (Kurfali et al., 2017; Uyar, 2010; Dinc et al., 20XX). Based upon the literature mentioned above, the following hypotheses were proposed for the present study:
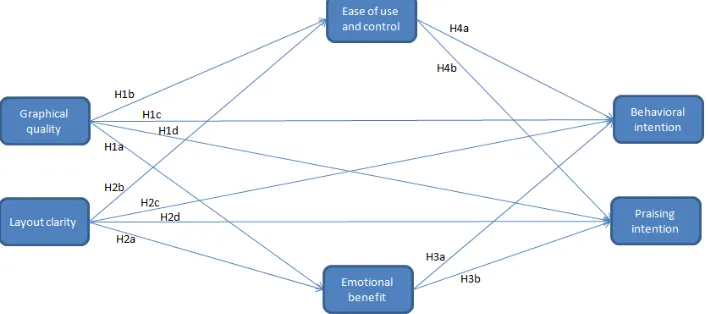
Hypothesis 1a: Graphical Quality has a significant and positive effect on emotional Benefits.
Hypothesis 1b: Graphical Quality has a significant and positive effect on ease of use and control.
Hypothesis 1c: Graphical Quality has a significant and positive effect on behavioral intention.
Hypothesis 1d: Graphical Quality has a significant and positive effect on praising intention.
Hypothesis 2a: Layout clarity has a significant and positive effect on emotional benefits.
Hypothesis 2b: Layout clarity has a significant and positive effect on ease of use and control.
Hypothesis 4d: Layout clarity has a significant and positive effect on praising intention.
Hypothesis 3a: Emotional Benefits has a significant and positive effect on behavioral intention.
Hypothesis 3b: Emotional Benefits has a significant and positive effect on praising intention.
Hypothesis 3a: Ease of use and control has a significant and positive effect on behavioral intention.
Hypothesis 3b: Ease of use and control has a significant and positive effect on praising intention.
Figure 1: Proposed model
3. Research methodology
3.1. Measure and sampling
Multi-item scales were modified and adapted from previous studies in English language sources. The constructs were measures using the 5-point Likert scales, in which 1 represents “strongly disagree” and 5 represents “strongly agree”. Partial Least Square Structural Equation Modeling (PLS-SEM) analysis was employed to test the proposed hypothetical relationship.
language (English). The direct translation method has been used widely whereby a bilingual translator translates the survey items from English to Turkish. The direct translation method is not recommended a) if the translator is not fluent in the base language as well as the respondent’s language, and/or b) if the translator is not familiar with both cultures. Back translation is therefore recommended in order to eliminate any errors produced within the direct translation method. For this study, the survey items were translated from English by a bilingual expert, with the translated items being re-translated back into the original language by a different bilingual expert. As a result of this procedure, translation errors were identified and corrected before a draft version of the survey items was prepared. The draft questionnaire was checked by marketing professors. After following these procedures, the survey items were ready to send to the target group.
The target population was projected to be accountants working in the biggest provinces in Turkey such as Istanbul, Ankara, and Izmir. Accounting offices were contacted online with an explanation of the objective of the study. The initial sample size was 500, out of which 400 agreed to contribute to the study. The respondents were informed that there was no right or wrong answer and assured that their responses would remain anonymous so as not to be linked to them individually or to their firms. This helped participants reduce possible anxiety resulting from a concern that his or her knowledge could be assessed unfavorably by an audience (Bordia et al., 2006). In the end, 203 participants out of the 400 who had initially agreed to participate completed the questionnaires. Due to high missing values, five cases were eliminated which resulted in 188 for the data analysis. Therefore, the final sample size was 188 with a 51% response rate.
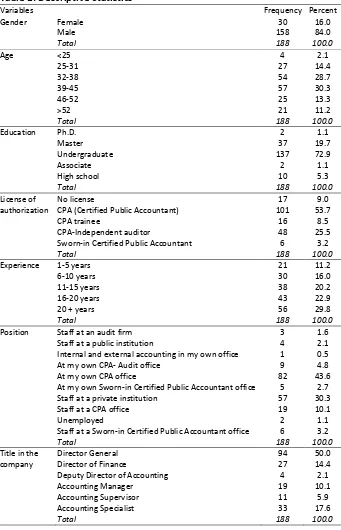
The characteristics of the sample are provided in Table 1. 84% were male and 16% were female. Also, the ages of 30.3% were between 39 and 45 years old, 28.7% were between 32 and 38, while only 2.1% were younger than 25. 73% of the participants held undergraduate degrees, 54% held a certified public accountant license, and almost 53% of the respondents had over 15 years’ experience. In addition, 44% of the participants owned the CPA office, while 30% comprised staff in a private organization. Finally, General Directors were 50% of the respondents, 18% were accounting specialists, 14% were Directors of Finance, and 10% were Accounting Managers.
Table 1: Descriptive Statistics
Variables Frequency Percent
Gender Female 30 16.0
Male 158 84.0
Total 188 100.0
Age <25 4 2.1
25-31 27 14.4
32-38 54 28.7
39-45 57 30.3
46-52 25 13.3
>52 21 11.2
Total 188 100.0
Education Ph.D. 2 1.1
Master 37 19.7
Undergraduate 137 72.9
Associate 2 1.1
High school 10 5.3
Total 188 100.0
License of authorization
No license 17 9.0
CPA (Certified Public Accountant) 101 53.7
CPA trainee 16 8.5
CPA-Independent auditor 48 25.5
Sworn-in Certified Public Accountant 6 3.2
Total 188 100.0
Experience 1-5 years 21 11.2
6-10 years 30 16.0
11-15 years 38 20.2
16-20 years 43 22.9
20 + years 56 29.8
Total 188 100.0
Position Staff at an audit firm 3 1.6
Staff at a public institution 4 2.1
Internal and external accounting in my own office 1 0.5
At my own CPA- Audit office 9 4.8
At my own CPA office 82 43.6
At my own Sworn-in Certified Public Accountant office 5 2.7
Staff at a private institution 57 30.3
Staff at a CPA office 19 10.1
Unemployed 2 1.1
Staff at a Sworn-in Certified Public Accountant office 6 3.2
Total 188 100.0
Title in the company
Director General 94 50.0
Director of Finance 27 14.4
Deputy Director of Accounting 4 2.1
Accounting Manager 19 10.1
Accounting Supervisor 11 5.9
Accounting Specialist 33 17.6
The twenty-three items were subject to factor analysis based on Smart PLS. Table 2 shows the factor loadings. The factor loadings were all above the suggested threshold value of .70, therefore convergent validity was met (Chin, 1998). Since all the items were above the recommended value, none were removed from the analysis. The discriminant validity was satisfied since each item had a higher factor loading on its own construct comparing to the other constructs. Each item had the highest loading than the cross loading on the row level as well as column level. The Cronbach’s alpha values ranged between .83 and .92, and the composite reliability values ranged between .89 and .94 (Table 4). These results indicated that the reliability of the constructs was also satisfied, since they were all above the recommended threshold value of .70.
Table 2: Measurement model’s factor loadings
Items GQ LC EB EUC BI PI
GQ1 .88 .56 .36 .45 .44 .43
GQ2 .92 .64 .51 .58 .51 .54
GQ3 .89 .56 .45 .57 .52 .45
LC1 .58 .87 .46 .56 .53 .45
LC2 .58 .94 .58 .69 .52 .52
LC3 .64 .93 .60 .69 .57 .55
EB1 .41 .42 .84 .59 .62 .57
EB2 .44 .53 .85 .64 .58 .57
EB3 .30 .49 .76 .62 .49 .51
EB4 .47 .53 .82 .76 .62 .59
EUC1 .51 .57 .74 .88 .61 .59
EUC2 .48 .63 .69 .86 .58 .52
EUC3 .55 .58 .66 .85 .61 .60
EUC4 .53 .59 .66 .82 .64 .61
EUC5 .46 .63 .63 .83 .57 .54
BI1 .43 .52 .60 .62 .86 .63
BI2 .42 .53 .60 .61 .77 .62
BI3 .49 .43 .52 .56 .82 .63
BI4 .47 .47 .63 .58 .86 .75
PI1 .51 .52 .60 .62 .76 .90
PI2 .48 .51 .57 .58 .70 .90
PI3 .43 .45 .64 .61 .70 .89
PI4 .48 .52 .64 .62 .70 .89
Notes: GQ: Graphical Quality; LC: Layout Clarity; EB: Emotional Benefits; EUC: Ease of Use and Control; BI: Behavioral Intention; PI: Praising Intention
(CFI)= .95; relative fit index (RFI)= .87; incremental fit index (IFI)=.95; Tucker-Lewis index (TLI)=.94; and root mean square error of approximation (RMSEA)= .06. These fit indices indicated a sufficient evidence of good models. In addition, the convergent validity was satisfied since the items were statistically significantly loaded to their respective latent variable
Table 3: Measurement model results
Latent Variable Items Standardized Coefficients t-Value
GQ
GQ1 .81 -
GQ2 .89 13.63
GQ3 .82 12.43
LC
LC1 .91 -
LC2 .91 18.42
LC3 .78 14.00
EB
EB1 .83 -
EB2 .71 9.46
EB3 .73 10.96
EB4 .71 10.49
EUC
EUC1 .79 -
EUC2 .76 11.43
EUC3 .82 11.39
EUC4 .82 12.63
EUC5 .85 13.20
BI
BI1 .81 -
BI2 .74 12.28
BI3 .72 10.51
BI4 .78 11.81
PI
PI1 .84 -
PI2 .84 15.33
PI3 .84 13.37
PI4 .87 14.12
GQ: Graphical Quality; LC: Layout Clarity; EB: Emotional Benefits; EUC: Ease of Use and Control; BI: Behavioral Intention; PI: Praising Intention. ;
df= 1.82; GFI= .85; NFI= .90; CFI= .95; RFI= .87; IFI=.95; TLI=.94; RMSEA= .06.
3.2. Measurement Model Analysis:
descriptive statistics, average variance extracted values, composite reliability, correlation coefficients, and the square root of average variance extracted value at the diagonal of the matrix of each latent variable in order to assess the discriminant validity, reliability, and convergent validity (Hair et al., 2010). Individual item reliability was already assessed since all item loadings were above.70 (Chin, 1998). The internal consistency was determined using composite reliability. The composite reliability values ranged between .89 and .94, which are all above the suggested value of .70 (Nunally, 1987). Average variance extracted (AVE) and the square root of AVE values versus the correlations coefficients of the latent variables were used to determine the discriminant validity (Fornell & Larcker, 1981). The values of AVE were above the recommended threshold value of .50, which indicated that the given latent variable was different from the other variables. Also, the square root of AVE placed on the diagonal of the correlation matrix was greater than the correlation coefficients of the latent variables placed off-diagonal. Thus, the results indicated that discriminant validity was satisfied.
Table 4: Descriptive statistics, correlation analysis and reliability measures
of the variables
Mean S.D. Variables 1 2 3 4 5 6
1 3.67 .98 GQ .90
2 3.42 1.02 LC .65** .91
3 3.56 .87 EB .49** .59** .94
4 3.59 .90 EUC .59** .70** .79** .96
5 3.89 .82 BI .55** .59** .70** .71** .95
6 3.76 .96 PI .52** .55** .68** .67** .79** .97
C.R. .93 .94 .89 .93 .90 .94
AVE .80 .83 .67 .72 .69 .80
α .88 .90 .83 .90 .85 .92
Notes: GQ: Graphical Quality; LC: Layout Clarity; EB: Emotional Benefits; EUC: Ease of Use and Control; BI: Behavioral Intention; PI: Praising Intention; C.R: Composite Reliability; AVE: Average Variance Extracted; S.D.: Standard Deviation; α: Cronbach’s Alpha; the elements on the diagonal are the square root of AVE, while the elements on the off-diagonals are the correlations between latent variables; **p<.01.
3.3. Structural equation modeling
The explained variance (R2) reveals the explanatory power of a structural equation model. According to Hair et al. (2010), an R2 value of .20 is considered high in PLS-SEM. The results indicated that the explanatory powers of the dependent latent variables were all high, since the explained variance of emotional benefit was .38, ease of use and control was .53, behavioral intention was .58, and praising intention was .54
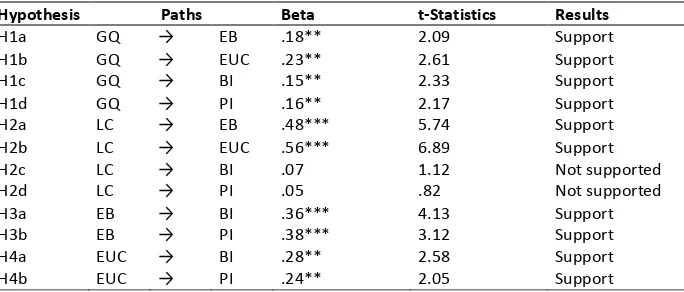
Table 5: Structural equation modeling results
Hypothesis Paths Beta t-Statistics Results
H1a GQ → EB .18** 2.09 Support
H1b GQ → EUC .23** 2.61 Support
H1c GQ → BI .15** 2.33 Support
H1d GQ → PI .16** 2.17 Support
H2a LC → EB .48*** 5.74 Support
H2b LC → EUC .56*** 6.89 Support
H2c LC → BI .07 1.12 Not supported
H2d LC → PI .05 .82 Not supported
H3a EB → BI .36*** 4.13 Support
H3b EB → PI .38*** 3.12 Support
H4a EUC → BI .28** 2.58 Support
H4b EUC → PI .24** 2.05 Support
GQ: Graphical Quality; LC: Layout Clarity; EB: Emotional Benefits; EUC: Ease of Use and Control; BI: Behavioral Intention; PI: Praising Intention;**p<.05; ***p<.01;
The results showed a positive, statistically significant effect between graphical quality and emotional benefit (β=.18, p<.05), ease of use/control (β=.23, p<.05), behavioral intentions (β=.15, p<.05), and praising intention (β=.16, p<.05). Thus, H1a, H1b, H1c, H1d were all supported. In addition, layout clarity had a positive and highly significant impact on emotional benefit (β=.48, p<.01) and ease of use/control (β=.56, p<.01), while it did not show a statistically significant association with either behavioral intention or praising intention. Therefore, H2a and H2b were supported, and H2c and H2d were not supported. Moreover, the results indicated that emotional benefit had a positive and highly significant relationship with behavioral intention (β=.36, p<.01) and praising intention (β=.38, p<.01). Thus, H3a and H3b were also supported. Finally, ease of use/control had a positive and significant impact in behavioral intention (β=.28, p<.05) and praising intention (β=.24, p<.05) which indicated that H4a and H4b were supported.
4. Discussion
emotional benefits, and ease of use and control each have a positive and significant impact upon behavioral intention and praising intention. The study did not find support for the effect of layout clarity on either of behavioral intention and praising intention. The implications of the study are highlighted in the following paragraphs.
In this study, accountants revealed a high perception of quality with regard to graphical quality (M = 3.67; SD = 0.98), layout clarity (M = 3.42; SD = 1.02), emotional benefits (M = 3.56; SD = 0.87), and ease of use and control (M = 3.59; SD = 0.90), indicating that the e-service dimensions of the e-government website were evaluated positively by accountants. Furthermore, this study went further by analyzing the extent to which the aforementioned dimensions are related to the accountants’ behavioral intention and praising intention. The results indicated that graphical quality, layout clarity, emotional benefits, and ease of use and control were strongly and positively correlated with behavioral intention and praising intention. This result is important, since it provides an opportunity to reconsider the provision of e-government online services.
The results of this study have particular relevance for both marketing theory and practice. From the theoretical point of view, this study provides an important contribution for measurements of e-service quality, especially for e-government services. It proposes new items while validating Fassnacht and Koese (2006) and Carlson and O'Cass (2011)’s e-service quality dimensions within the specific context of online e-government dimensions. The results displayed support for the impacts of e-service quality dimensions such as graphical quality, emotional benefits, and ease of use and control on the behavioral and praising intentions of accountants. From a practical standpoint, this study evaluated the opinions of accountants who are necessarily heavy users of the e-government website. Based upon these opinions from those who responded, the services provided by e-government would benefit greatly by enhancing the layout clarity of the environment quality dimension.
5. Limitations and Future Research
References
Bordia, P., Irmer, B.E., & Abusah, D. (2006). Differences in sharing knowledge interpersonally and via databases: The role of evaluation apprehension and perceived benefits. European Journal of Work and Organizational Psychology, 15(3), 262-280. https://doi.org/10.1080/13594320500417784
Brady, M. & Cronin, J. (2001). Some new thoughts on conceptualizing perceived service quality: a hierarchical approach. Journal of Marketing, 65(3), 34-49. https://doi.org/10.1509/jmkg.65.3.34.18334
Brislin, R. W. (1970). Back-translation for cross-cultural research. Journal of cross-cultural psychology, 1(3), 185-216. https://doi.org/10.1177/135910457000100301
Carlos Pinho, J., Macedo, I.M., & Monteiro, A.P. (2007). The impact of online SERVQUAL dimensions on certified accountant satisfaction: The case of taxation services. EuroMed Journal of Business, 2(2), 154-172. https://doi.org/10.1108/14502190710826031
Carlson, J. & O'Cass, A. (2011). Developing a framework for understanding e-service quality, its antecedents, consequences, and mediators. Managing Service Quality: An International Journal, 21(3), 264-286. https://doi.org/10.1108/09604521111127965
Carman, J.M. (1990). Consumer perceptions of service quality: an assessment of the SERVQUAL dimensions. Journal of Retailing, 66(1), 33-55.
Chen, S.C., Chen, H.H., & Chen, M.F. (2009). Determinants of satisfaction and continuance intention towards self-service technologies. Industrial Management & Data Systems, 109(9), 1248-1263. https://doi.org/10.1108/02635570911002306
Chin, W.W. (1998). The partial least squares approach for structural equation modeling, in Marcoulides, G.A. (Ed.), Modern methods for business research, Lawrence Erlbaum Associates, Mahwah, NJ, 295-336.
Dabholkar, P., Shepherd, C., & Thorpe, D. (2000). A comprehensive framework for service quality: an investigation for critical conceptual and measurement issues through a longitudinal study. Journal of Retailing, 76(2), 139-73. https://doi.org/10.1016/S0022-4359(00)00029-4
Dabholkar, P., Thorpe, D., & Rentz, J. (1996). A measure of service quality for retail stores: scale development and validation, Journal of the Academy of Marketing Science, 24(1), 3-16. https://doi.org/10.1007/BF02893933
Dagger, T., Sweeney, J.C., & Johnson, L.W. (2007). Health-SQ: developing a multidimensional health service quality scale. Journal of Service Research, 10(2), 123-42. https://doi.org/10.1177/1094670507309594
Dinc, M.S., Kuzey, C., Gungormus, A.H., & Atalay, B. (2019). Burnout among accountants: the role of organisational commitment components. European Journal of International Management. Forthcoming, https://www.doi.org/10.1504/EJIM.2019.10017013.
Fassnacht, M. & Koese, I. (2006). Quality of electronic services: Conceptualizing and testing a hierarchical model. Journal of service research, 9(1), 19-37. https://doi.org/10.1177/1094670506289531
Gounaris, S., Dimitriadis, S., & Stathakopoulos, V. (2010). An examination of the effects of service quality and satisfaction on customers' behavioral intentions in e-shopping. Journal of services marketing,24(2), 142-156. https://doi.org/10.1108/08876041011031118
Gummerus, J., Veronica L., Minna P., & Allard V. (2004). Customer Loyalty to Content-Based Websites: The Case of an Online Health-Care Service. Journal of Services Marketing, 18(3), 175-86. https://doi.org/10.1108/08876040410536486
Hair, J.F., Anderson, R.E., Tatham, R.L., & Black, W.C. (2010). Multivariate Data Analysis with Readings, 7th Ed. Englewood Cliffs, Prentice Hall, NJ.
Henseler, J., Ringle, C.M., & Sinkovics, R.R. (2009). The use of partial least squares path modeling in international marketing (ed. by Sinkovics, R. R. & PN, G.), pp. 277-319. Emerald, Bingley
Hu, L.T. & Bentler, P.M. (1999). Cutoff criteria for fit indexes in covariance structure analysis: Conventional criteria versus new alternatives. Structural equation modeling: a multidisciplinary journal, 6(1), 1-55. https://doi.org/10.1080/10705519909540118
Janita, M. S., & Miranda, F. J. (2018). Quality in e-Government services: A proposal of dimensions from the perspective of public sector employees. Telematics and Informatics, 35(2), 457-469. https://doi.org/10.1016/j.tele.2018.01.004
Kurfalı, M., Arifoğlu, A., Tokdemir, G., and Paçin, Y. (2017). Adoption of e-government services in Turkey. Computers in Human Behavior, 66, 168-178. https://doi.org/10.1016/j.chb.2016.09.041
Lai, A.W. (1995). Consumer values, product benefits and customer value: a consumption behavior approach, ACR North American Advances.
Lee, Y. and Kozar, K. A. (2006). Investigating the effect of website quality on e-business success: An analytic hierarchy process (AHP) approach. Decision support systems, 42(3), 1383-1401. https://doi.org/10.1016/j.dss.2005.11.005
Nunnally, J. (1978). Psychometric Theory, 2nd ed., McGraw-Hill, New York, NY.
Papadomichelaki, X., & Mentzas, G. (2012). GovQual: A multiplitem scale for assessing e-government service quality. Government information quarterly, 29(1), 98-109. https://doi.org/10.1016/j.giq.2011.08.011
Podsakoff, P.M., MacKenzie, S.B., Lee, J.Y., &Podsakoff, N. P. (2003). Common method biases in behavioral research: A critical review of the literature and recommended remedies.
Journal of Applied Psychology, 88, 879-903. https://doi.org/10.1037/0021-9010.88.5.879 Ringle, C., Wende, S., & Will, A. (2005). Smart-PLS Version 2.0 M3. University of Hamburg. Rust, R.T. & Oliver, R.L. (1994). Service quality: insights and managerial implications from the frontier, in Rust, R. and Oliver, R. (Eds), Service Quality: New Directions in Theory and Practice, Sage, Thousand Oaks, CA.
Sá, F., Rocha, Á., & Cota, M. P. (2016a). Potential dimensions for a local e-Government services quality model. Telematics and Informatics, 33(2), 270-276. https://doi.org/10.1016/j.tele.2015.08.005
Santos, J. (2003). E-service quality: a model of virtual service quality dimensions. Managing Service Quality: An International Journal, 13(3), 233-246. https://doi.org/10.1108/09604520310476490
Uyar, A. (2010). Cost and management accounting practices: a survey of manufacturing companies. Eurasian Journal of Business and Economics, 3(6), 113-125.