Experimental Evolution as a High-Throughput Screen for
Genetic Adaptations
Vaughn S. Coopera,b
aDepartment of Microbiology and Molecular Genetics, University of Pittsburgh School of Medicine, Pittsburgh, Pennsylvania, USA
bPittsburgh Center for Evolutionary Biology and Medicine, University of Pittsburgh School of Medicine, Pittsburgh, Pennsylvania, USA
ABSTRACT Experimental evolution is a method in which populations of organisms, often microbes, are founded by one or more ancestors of known genotype and then propagated under controlled conditions to study the evolutionary process. These evolving populations are influenced by all population genetic forces, including selec-tion, mutaselec-tion, drift, and recombinaselec-tion, and the relative contributions of these forces may be seen as mysterious. Here, I describe why the outcomes of experimen-tal evolution should be viewed with greater certainty because the force of selection typically dominates. Importantly, any mutant rising rapidly to high frequency in large populations must have acquired adaptive traits in the selective environment. Sequencing the genomes of these mutants can identify genes or pathways that con-tribute to an adaptation. I review the logic and simple mathematics why this evolve-and-resequence approach is a powerful way to find the mutations or mutation com-binations that best increase fitness in any new environment.
KEYWORDS evolutionary biology, genomics, population genetics
E
xperimental evolution is a method that is gaining in popularity because of severalinspiring successes and because high-throughput sequencing can reveal the ge-netic basis of the evolutionary process (1, 2). An underappreciated benefit of these studies is their ability to identify mutants in genetic pathways that underlie functions of interest. Thus, the experimental evolution of large populations of microbes can and should be viewed as a powerful genetic screen for adaptations. I outline why the processes underlying most evolution experiments are practically straightforward and why evolved mutants can provide valuable insight into the biology of the microbe under study and its response to environmental pressures.
Experimental evolution is not a new method, dating back to the 1870s when Dallinger conducted continuous culture experiments at steadily increasing tempera-tures (3). It also still underlies a large fraction of vaccine development, in which viruses are propagated in alternative hosts or cell lines to render them nonpathogenic but still immunogenic (4). Likely the best known is the Long-Term Evolution Experiment (LTEE)
in which 12Escherichia coli populations have been propagated daily for more than
30 years (5). Many remarkable studies of the LTEE have taught us a great deal about the evolutionary dynamics of adaptation and revealed numerous adaptive phenotypes, including gains in cell size, metabolic capacity, thermal tolerance, life history parame-ters, and above all, competitive fitness. Yet for the first 13 years of the LTEE, the genetic sources of adaptation remained unknown because the causative mutations did not affect the candidates chosen for Sanger sequencing. The first few mutations were discovered with higher-throughput screens of metabolism, expression microarrays, and by probes targeted to mobile insertion sequences (6–8). The power of each of these
Published9 May 2018
CitationCooper VS. 2018. Experimental evolution as a high-throughput screen for genetic adaptations. mSphere 3:e00121-18.
https://doi.org/10.1128/mSphere.00121-18.
EditorAna Cristina Gales, Escola Paulista de Medicina, Universidade Federal de São Paulo
Copyright© 2018 Cooper. This is an open-access article distributed under the terms of theCreative Commons Attribution 4.0 International license.
Address correspondence to [email protected].
Experimental evolution, paired with genome sequencing, can be the best way to learn how a microbe responds to a new environment. @vscooper
Ecological and Evolutionary Science
crossm
on September 8, 2020 by guest
http://msphere.asm.org/
methods now pales in comparison to today’s genome-enabled screens that harness simple population genetic processes to precisely identify genetic adaptations.
Evolution experiments are influenced by all population genetic forces: selection, genetic drift, mutation, and recombination. In conducting a genetic screen, we can usually ignore the process of recombination, given that we are mostly interested in “first-step” adaptive mutants arising in different clones. Given that mutations occur inevitably, the relative balance of the remaining forces is governed by the effective
population size,Ne, and the strength of selection,s, acting on these mutations (Table 1).
Neis a property that is typically much less than the census population size (N) at any
given time and is biased toward bottlenecks that occur during transfers. In practice,
microbial populations are transferred at sizes ranging from a single cell to ~108
individuals or more. Meanwhile, values forsthat have been measured during
experi-mental evolution range from ~0.01 (e.g., a minor improvement in resource uptake [6]) to ~4 (9) (involving the absolute gain in ability to colonize a new niche), with smaller
values more common. Mutants with s ⬍ 0.01 are likely much more abundant but
remain largely undetected because they are lost by drift or outcompeted by more beneficial mutants in large experimental populations, a process known as clonal interference (Table 1) (2, 10). However, technologies that rarify cells and limit clonal interference could detect even smaller fitness effects (13, 42).
When evolving populations are maintained under conditions in which the product
of these two propertiesNeands is clearly greater than 1 (Nes⬎⬎1), then selection
becomes the dominant force in the population (2, 21, 43). To understand these properties more practically, consider a typical serial dilution evolution experiment in which bacterial populations are grown from a single clone in medium that supports a
population of 108 cells/ml (Fig. 1). Let us also assume that the ancestor is not
pre-adapted to this environment so there is opportunity for improvement. Population
growth on the first day involves ~108cell divisions and generates ~105mutations given
the approximate per-genome, per-generation mutation rate of 10⫺3(11, 12). Selection
could act upon any of these ~105mutations, and the probability that any one of them
would reach a detectable frequency (say, 0.01) depends on the mutant’s frequency and its selective value. So, the earlier a mutation occurs on this first day of population expansion, the more likely it will reach high frequency. Yet most mutations arise in the
final division of population growth, i.e., when the population increases from 5⫻107to
108cells/ml, involving 5⫻107cell divisions. The key point is that after this first growth
cycle, there are already many mutations present in the population, but nearly all are very rare, having arisen in the last generation (16).
In a side note, in considering these estimates, one may wonder if some sites or genome regions may be more mutation-prone than others, thus increasing the number of certain mutations. While mutation rates do vary among sites, such rate variation
typically involves fold changes (2⫻to 5⫻) and rarely more than an order of magnitude
(10⫻) (11, 12). These processes can be influential over hundreds of generations but
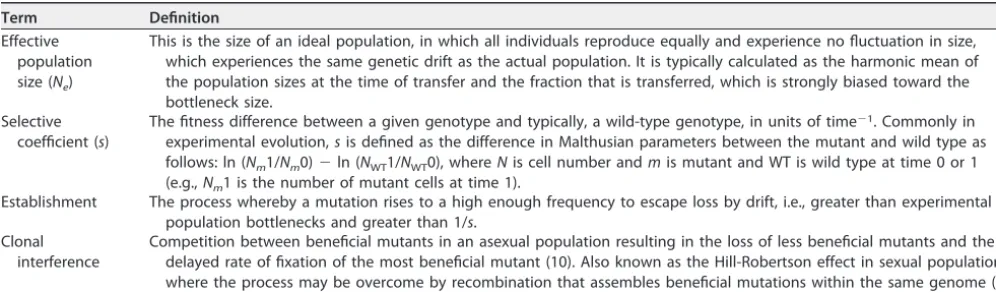
TABLE 1 Key terms used in this article
Term Definition
Effective population size (Ne)
This is the size of an ideal population, in which all individuals reproduce equally and experience no fluctuation in size, which experiences the same genetic drift as the actual population. It is typically calculated as the harmonic mean of the population sizes at the time of transfer and the fraction that is transferred, which is strongly biased toward the bottleneck size.
Selective coefficient (s)
The fitness difference between a given genotype and typically, a wild-type genotype, in units of time⫺1. Commonly in
experimental evolution,sis defined as the difference in Malthusian parameters between the mutant and wild type as follows: ln (Nm1/Nm0)⫺ln (NWT1/NWT0), whereNis cell number andmis mutant and WT is wild type at time 0 or 1
(e.g.,Nm1 is the number of mutant cells at time 1).
Establishment The process whereby a mutation rises to a high enough frequency to escape loss by drift, i.e., greater than experimental population bottlenecks and greater than 1/s.
Clonal interference
Competition between beneficial mutants in an asexual population resulting in the loss of less beneficial mutants and the delayed rate of fixation of the most beneficial mutant (10). Also known as the Hill-Robertson effect in sexual populations, where the process may be overcome by recombination that assembles beneficial mutations within the same genome (41).
on September 8, 2020 by guest
http://msphere.asm.org/
typically contribute little over short time scales because they would add only a handful
of new mutations to a sample of ~105. Nonetheless, if these mutation hot spots encode
a trait under strong selection, such as phase variation of membranes affecting antibiotic resistance (14, 17, 18), they may greatly accelerate the evolutionary rate.
On the next day of the experiment, we transfer some fraction of the first population
to fresh medium, say 1/100, and growth resumes (Fig. 1). For example, 106cells/ml
harboring ~103 mutations (simple dilution) now regrow to reach 108cells/ml, which
involves another 108 cell divisions (106divisions to reach 2⫻ 106cells/ml, 2⫻ 106
divisions to reach 4⫻106cells/ml, and so on) and produces another 105 mutations.
Despite the many individual cell divisions, it is important to realize that the number of
generations the entire population undergoes during the next cycle is log2(108/106)⫽
6.67 generations. This is the number we commonly reference in describing the duration of an evolution experiment over any interval. It is also noteworthy that this demo-graphic measure of generation number does not depend on the population size but
rather on the dilution itself. Under these conditions, theNeof a population cycling
between 106and 108cells/ml each day is ~2⫻106(Table 1).
Now, revisiting the condition in which the force of selection dominates,Nes⬎⬎1,
any mutation with a selective coefficientsmuch greater than 1/Neis likely to rise in
frequency by selection provided it becomes established in the population. By estab-lishment (Table 1), we mean the mutant must also be lucky enough to reach a frequency where it escapes genetic drift and then is guided deterministically by
selection (Fig. 1). This frequency is typically 1/sindividuals (2, 43). Thus, a fairly typical
big-benefit mutation that increases fitness by 10% (s~ 0.1) (19, 20) exceeds the general
Nes threshold by 4 orders of magnitude. If its population size reaches a mere 10
individuals, it is nearly guaranteed to be governed by selection and is likely to completely take over (fix) the population in the absence of competition. However, should this big-benefit mutation cooccur in a population with an even more beneficial
mutation (s⫽0.2 or more), it may lose out to this superior competitor by the process
of clonal interference (Table 1 and Fig. 2). In fact, even though beneficial mutations may amount to only 1% of all mutations (or less), large populations guarantee that many
FIG 1 Design of a typical evolution experiment with microbial populations. A single colony is isolated from an agar plate and used to inoculate a tube of growth medium. Every 24 h for days or weeks, 1/100 of the population is transferred to fresh medium enabling regrowth. Multiple replicate populations are typically established by the same protocol and can be tracked by plating, quantitation of genetic markers, or whole-population genomic sequencing.
on September 8, 2020 by guest
http://msphere.asm.org/
beneficial mutations will arise and compete under these conditions, with only the best of them ever reaching a detectable frequency of 0.01 or more (Fig. 2) (2, 19, 21).
As the experiment progresses, suppose mutants with some potentially adaptive phe-notype (a change in colony morphology indicative of altered secretions, growth parameter, metabolic capacity, host colonization, etc.) are observed in a population after seven transfers or ~46 generations. You pick these mutants to subculture them, and their phenotypes appear heritable. What is the probability that these mutants involve adapta-tions driven by selection and did not become frequent by the random forces of mutation and drift? Virtually certain. Here is why: any given mutation with no effect on fitness (and likely no phenotype) will be governed by genetic drift and will reach a potentially detected
frequency of 0.1 in the following number of generations, where g is the number of
generations,pis the mutant frequency, andis the mutation rate (22):
g⫽⫺log2p
⫽
⫺log20.1
10⫺3
This would equal 3,322 generations, or 499 days in this experimental design. This is the estimated time required for any mutation to reach a frequency of 10% by genetic drift alone. For a mutant to become detected 100 times faster than this in your evolution experiment (and this is not uncommon), the mutant must have been subject to strong positive selection because it is adaptive.
FIG 2 Two representations of the same mutation frequency dynamics during a hypothetical evolution experiment. (Top) Muller plot demonstrating the establishment and rise of four adaptive lineages and eventual fixation of the most-fit competitor (mutant lineage b), shown in purple. A second mutation (mutant lineage e) that further increases fitness subsequently fixes within the purple lineage. (Bottom) Plot of log mutation frequency over time, which demonstrates that adaptive lineages must rise in frequency by several orders of magnitude before they may be easily detected. All lineages may be influenced by transfer bottlenecks that randomly increase or decrease their frequency (see erratic changes in the lineages that went extinct). Dashed lines denote mutations that did not reach a conventionally detected frequency and were driven extinct by competition with more-fit lineages. Dynamics are based on simulations generated by FFPopSim (40) with asexual lineages and periodic 1:100 population bottlenecks.
on September 8, 2020 by guest
http://msphere.asm.org/
As evolution experiments become commonplace for many microbial species in a range of environments, reports of parallel mutations— even identical nucleotide changes in the same gene—are becoming more frequent (15, 23). This observation is often met with the question—is this particular site hypermutable? We need to consider three more questions. First, can a high mutation rate alone drive a mutation to high frequency? Second, what role might selection have played? Third, under what condi-tions would parallelism occur?
Let us suppose that this position is hypermutable, not the usual 1 ⫻ 10⫺10
mutations/bp/generation but 100-fold more mutable at 1 ⫻ 10⫺8 mutations/bp/
generation. Would a high mutation rate alone cause it to rise to high frequency in multiple populations?
Using the same equation above, a specific mutation would reach a frequency of 10%
by drift alone by ⫺log20.1
108 ⫽33,219,289 generations, which is clearly implausible, so
mutation pressure alone cannot lead to parallelism. However, let us imagine this
mutant is strongly selected withs⫽0.2, which is much greater than the mutation rate.
It will rise to 10% frequency in⫺log20.1
0.2 ⫽16.6 generations, or less than 3 transfer days,
which is fast! Selection can cause a highly beneficial mutation to sweep very rapidly, in the typical time required for an efficient laboratory genetic screen.
However, the probability that the same mutation becomes rapidly detected in another population depends on whether this same mutation actually occurs in time.
The evolution experiment we have outlined here generates ~105 new mutations per
day, with only 103on average surviving each bottleneck. The probability of this same
mutation even recurring is the approximate per-site mutation rate of 2⫻10⫺10, which
will occur on average in 108 cell divisions/day ⬇ 39 days or 263 generations.
Site-specific parallelism is therefore still highly improbable. However, strongly selected mutations are much more likely to survive the bottleneck and may also become enriched both by demography (becoming slightly more common in the transfer by chance). Estimating the exact probability of parallelism is not straightforward because it depends on these chance effects as well as on the distribution of effects of other selected mutations within the population, but in essence, if the same mutation does indeed occur by chance in another population and escapes drift and outcompetes other mutants, it will also rapidly reach this frequency of 0.1.
To sum up, any single mutation rising from a frequency of 10⫺7 to 10⫺1 in an
evolution experiment lasting weeks or months (100 to 1,000 generations) must be under positive selection, and equally important, the contribution of other population genetic processes is negligible. Parallelism at the level of nucleotides, amino acids, or even genes in replicate populations adds overwhelming evidence of strong selection on that target.
Why are these inferences useful? Given that the force of selection dominates evolution experiments conducted in large populations, mutants rising to high fre-quency must have acquired adaptive traits in the selective environment. Furthermore, the large population sizes typically used in these experiments often generate multiple beneficial mutants that compete with one another (Fig. 2), meaning that those that ultimately become detectable (e.g., as colonies on a plate) are among the most fit available. Genome sequencing of these mutants can therefore be used as a forward genetic screen for traits that enhance fitness in any environment, including new host organisms (9, 15, 24–27). Sequencing multiple mutants from independent populations or diverse samples of the evolved populations can expand the sample of adaptive mutations. Any parallelism at the level of gene or pathway provides powerful inference that alterations in this pathway provide an ideal adaptive solution. As one example from our screen of adaptations to biofilm growth, we observed four independent D652N mutations in the response regulator protein WspE in different populations of
Burkholderia cenocepaciaselected for only 32 to 64 generations (15). These mutants
produced a characteristic wrinkly colony morphology and increased biofilm. No specific
on September 8, 2020 by guest
http://msphere.asm.org/
features of the nucleotide sequence indicate that this site is hypermutable, but this
remarkable parallelism is consistent with the fitness advantage of s ⬇ 1.0 that
rapidly displaces the ancestor (15). These results also demonstrate that this aspar-tate residue (and not the adjacent asparaspar-tate at position 653) that is outside the primary receiver domain is functionally important for signaling that the cell is in contact with the surface (28, 44). Another example of an evolution experiment
serving as a genetic screen involved E. coli selected for growth in test tubes in
minimal medium containing glucose (19). Some of the most fit mutants acquired
partial loss-of-function mutations inyfgAandprc, genes that encode a cytoskeletal
protein and a protease involved in peptidoglycan synthesis. We reasoned that both mutations could result in the synthesis of a more limited peptidoglycan layer to facilitate transport but also alter cell shape, which we indeed observed as the production of more spherical cells (19). Put simply, this evolve-and-resequence approach is likely to find the best mutations (or mutation combinations) to respond to any selective challenge and can inform how the affected proteins function and enable the mutant to outcompete its ancestor.
Researchers with diverse interests have recognized this opportunity, leading to an explosion of the kinds of questions addressed by experimental evolution and two successful American Society for Microbiology (ASM) meetings focused on the subject. For example, experimental evolution has been used to discover: (i) how bacteria evolve resistance to antibiotics (29, 30) or environmental pollutants (31), (ii) how microbes evolve mutualistic or antagonistic social interactions with other microbes (32–35), (iii) how bacteriophage undergo host range expansion (36, 37), (iv) how microbes adapt to current hosts (38) or novel hosts (9), and (vi) how pathogens evolve during infections (39). These imaginative studies have identified new pathways that reveal how these microbes adapt to new conditions and some recurring themes, such as the selection for mutations in regulators that produce multiple adaptive traits at once. With the wealth of knowledge and experience from almost 150 years of evolution experiments and an influx of creative young investigators, the future of using evolution experiments to reveal unknown mechanisms of adaptation could not be brighter.
ACKNOWLEDGMENTS
I thank Caroline Turner and Chris Marshall for helpful discussions, two anonymous reviewers for useful recommendations, and Richard Neher for assistance with simula-tions.
V.S.C. is supported by NASA NAI CAN-7 NNA15BB04A and by NIH R01GM110444 and U01AI124302-01.
REFERENCES
1. Good BH, McDonald MJ, Barrick JE, Lenski RE, Desai MM. 2017. The dynamics of molecular evolution over 60,000 generations. Nature 551: 45–50.https://doi.org/10.1038/nature24287.
2. Levy SF, Blundell JR, Venkataram S, Petrov DA, Fisher DS, Sherlock G. 2015. Quantitative evolutionary dynamics using high-resolution lineage tracking. Nature 519:181–186.https://doi.org/10.1038/nature14279. 3. O’Malley MA, Travisano M, Velicer GJ, Bolker JA. 2015. How do microbial
populations and communities function as model systems? Q Rev Biol 90:269 –293.https://doi.org/10.1086/682588.
4. Bull JJ. 2015. Evolutionary reversion of live viral vaccines: can genetic engineering subdue it? Virus Evol 1:vev005.https://doi.org/10.1093/ve/ vev005.
5. Lenski RE. 2017. Experimental evolution and the dynamics of adaptation and genome evolution in microbial populations. ISME J 11:2181–2194.
https://doi.org/10.1038/ismej.2017.69.
6. Cooper VS, Schneider D, Blot M, Lenski RE. 2001. Mechanisms causing rapid and parallel losses of ribose catabolism in evolving populations of Escherichia coliB. J Bacteriol 183:2834 –2841.https://doi.org/10.1128/JB .183.9.2834-2841.2001.
7. Cooper TF, Rozen DE, Lenski RE. 2003. Parallel changes in gene expres-sion after 20,000 generations of evolution inEscherichia coli. Proc
Natl Acad Sci U S A 100:1072–1077. https://doi.org/10.1073/pnas .0334340100.
8. Schneider D, Duperchy E, Coursange E, Lenski RE, Blot M. 2000. Long-term experimental evolution in Escherichia coli. IX. Characterization of insertion sequence-mediated mutations and rearrangements. Genetics 156:477– 488.
9. Pankey MS, Foxall RL, Ster IM, Perry LA, Schuster BM, Donner RA, Coyle M, Cooper VS, Whistler CA. 2017. Host-selected mutations converging on a global regulator drive an adaptive leap by bacteria to symbiosis. Elife 6:e24414.https://doi.org/10.7554/eLife.24414.
10. Gerrish PJ, Lenski RE. 1998. The fate of competing beneficial mutations in an asexual population. Genetica 102-103:127–144.https://doi.org/10 .1007/978-94-011-5210-5_12.
11. Dillon MM, Sung W, Sebra R, Lynch M, Cooper VS. 2017. Genome-wide biases in the rate and molecular spectrum of spontaneous mutations in Vibrio cholerae and Vibrio fischeri. Mol Biol Evol 34:93–109.https://doi .org/10.1093/molbev/msw224.
12. Lee H, Popodi E, Tang HX, Foster PL. 2012. Rate and molecular spectrum of spontaneous mutations in the bacterium Escherichia coli as deter-mined by whole-genome sequencing. Proc Natl Acad Sci U S A 109: E2774 –E2783.https://doi.org/10.1073/pnas.1210309109.
on September 8, 2020 by guest
http://msphere.asm.org/
13. Cottinet D, Condamine F, Bremond N, Griffiths AD, Rainey PB, de Visser JAGM, Baudry J, Bibette J. 2016. Lineage tracking for probing heritable phenotypes at single-cell resolution. PLoS One 11:e0152395.https://doi .org/10.1371/journal.pone.0152395.
14. van der Woude MW, Bäumler AJ. 2004. Phase and antigenic variation in bacteria. Clin Microbiol Rev 17:581– 611.https://doi.org/10.1128/CMR.17 .3.581-611.2004.
15. Cooper VS, Staples RK, Traverse CC, Ellis CN. 2014. Parallel evolution of small colony variants in Burkholderia cenocepacia biofilms. Genomics 104:447– 452.https://doi.org/10.1016/j.ygeno.2014.09.007.
16. Luria SE, Delbrück M. 1943. Mutations of bacteria from virus sensitivity to virus resistance. Genetics 28:491–511.
17. Martin P, van de Ven T, Mouchel N, Jeffries AC, Hood DW, Moxon ER. 2003. Experimentally revised repertoire of putative contingency loci in Neisseria meningitidis strain MC58: evidence for a novel mechanism of phase variation. Mol Microbiol 50:245–257. https://doi.org/10.1046/j .1365-2958.2003.03678.x.
18. Gallie J, Libby E, Bertels F, Remigi P, Jendresen CB, Ferguson GC, Desprat N, Buffing MF, Sauer U, Beaumont HJE, Martinussen J, Kilstrup M, Rainey PB. 2015. Bistability in a metabolic network underpins the de novo evolution of colony switching in Pseudomonas fluorescens. PLoS Biol 13:e1002109.https://doi.org/10.1371/journal.pbio.1002109.
19. Dillon MM, Rouillard NP, Van Dam B, Gallet R, Cooper VS. 2016. Diverse phenotypic and genetic responses to short-term selection in evolving Escherichia coli populations. Evolution 70:586 –599.https://doi.org/10 .1111/evo.12868.
20. Peng F, Widmann S, Wünsche A, Duan K, Donovan KA, Dobson RCJ, Lenski RE, Cooper TF. 2018. Effects of beneficial mutations in pykF gene vary over time and across replicate populations in a long-term experi-ment with bacteria. Mol Biol Evol 35:202–210.https://doi.org/10.1093/ molbev/msx279.
21. Patwa Z, Wahl LM. 2008. The fixation probability of beneficial mutations. J R Soc Interface 5:1279 –1289.https://doi.org/10.1098/rsif.2008.0248. 22. Lenski RE, Rose MR, Simpson SC, Tadler SC. 1991. Long-term
experimen-tal evolution in Escherichia coli. I. Adaptation and divergence during 2,000 generations. Am Nat 138:1315–1341. https://doi.org/10.1086/ 285289.
23. Lind PA, Farr AD, Rainey PB. 2017. Evolutionary convergence in experi-mental Pseudomonas populations. ISME J 11:589 – 600.https://doi.org/ 10.1038/ismej.2016.157.
24. O’Rourke D, Fitzgerald CE, Traverse CC, Cooper VS. 2015. There and back again: consequences of biofilm specialization under selection for disper-sal. Front Genet 6:18.https://doi.org/10.3389/fgene.2015.00018. 25. Lind PA, Farr AD, Rainey PB. 2015. Experimental evolution reveals hidden
diversity in evolutionary pathways. Elife 4:e07074. https://doi.org/10 .7554/eLife.07074.
26. McDonald MJ, Gehrig SM, Meintjes PL, Zhang X-X, Rainey PB. 2009. Adaptive divergence in experimental populations ofPseudomonas fluo-rescens. IV. Genetic constraints guide evolutionary trajectories in a par-allel adaptive radiation. Genetics 183:1041–1053. https://doi.org/10 .1534/genetics.109.107110.
27. Marchetti M, Capela D, Glew M, Cruveiller S, Chane-Woon-Ming B, Gris C, Timmers T, Poinsot V, Gilbert LB, Heeb P, Médigue C, Batut J, Masson-Boivin C. 2010. Experimental evolution of a plant pathogen into a legume symbiont. PLoS Biol 8:e1000280.https://doi.org/10.1371/journal .pbio.1000280.
28. O’Connor JR, Kuwada NJ, Huangyutitham V, Wiggins PA, Harwood CS. 2012. Surface sensing and lateral subcellular localization of WspA, the
receptor in a chemosensory-like system leading to c-di-GMP production. Mol Microbiol 86:720 –729.https://doi.org/10.1111/mmi.12013. 29. Toprak E, Veres A, Michel J-B, Chait R, Hartl DL, Kishony R. 2011.
Evolutionary paths to antibiotic resistance under dynamically sustained drug selection. Nat Genet 44:101–105.https://doi.org/10.1038/ng.1034. 30. Barbosa C, Trebosc V, Kemmer C, Rosenstiel P, Beardmore R, Schulen-burg H, Jansen G. 2017. Alternative evolutionary paths to bacterial antibiotic resistance cause distinct collateral effects. Mol Biol Evol 34: 2229 –2244.https://doi.org/10.1093/molbev/msx158.
31. Zhou A, Lau R, Baran R, Ma J, von Netzer F, Shi W, Gorman-Lewis D, Kempher ML, He Z, Qin Y, Shi Z, Zane GM, Wu L, Bowen BP, Northen TR, Hillesland KL, Stahl DA, Wall JD, Arkin AP, Zhou J. 2017. Key metabolites and mechanistic changes for salt tolerance in an experimentally evolved sulfate-reducing bacterium, Desulfovibrio vulgaris. mBio 8:e01780-17.
https://doi.org/10.1128/mBio.01780-17.
32. McCully LM, Bitzer AS, Seaton SC, Smith LM, Silby MW. 2018. Social motility: interaction between two sessile soil bacteria leads to emer-gence of surface motility. bioRxivhttps://doi.org/10.1101/296814. 33. Martin M, Hölscher T, Dragoš A, Cooper VS, Kovács ÁT. 2016. Laboratory
evolution of microbial interactions in bacterial biofilms. J Bacteriol 198: 2564 –2571.https://doi.org/10.1128/JB.01018-15.
34. Martin M, Dragoš A, Hölscher T, Maróti G, Bálint B, Westermann M, Kovács ÁT. 2017.De novoevolved interference competition promotes the spread of biofilm defectors. Nat Commun 8:15127.https://doi.org/ 10.1038/ncomms15127.
35. Hillesland KL, Stahl DA. 2010. Rapid evolution of stability and produc-tivity at the origin of a microbial mutualism. Proc Natl Acad Sci U S A 107:2124 –2129.https://doi.org/10.1073/pnas.0908456107.
36. Burmeister AR, Lenski RE, Meyer JR. 2016. Host coevolution alters the adaptive landscape of a virus. Proc Biol Sci 283:20161528.https://doi .org/10.1098/rspb.2016.1528.
37. Shapiro JW, Turner PE. 2018. Evolution of mutualism from parasitism in experimental virus populations. Evolution 72:707–712.https://doi.org/ 10.1111/evo.13440.
38. Guidot A, Jiang W, Ferdy J-B, Thébaud C, Barberis P, Gouzy J, Genin S. 2014. Multihost experimental evolution of the pathogen Ralstonia so-lanacearum unveils genes involved in adaptation to plants. Mol Biol Evol 31:2913–2928.https://doi.org/10.1093/molbev/msu229.
39. King KC, Brockhurst MA, Vasieva O, Paterson S, Betts A, Ford SA, Frost CL, Horsburgh MJ, Haldenby S, Hurst GD. 2016. Rapid evolution of microbe-mediated protection against pathogens in a worm host. ISME J 10: 1915–1924.https://doi.org/10.1038/ismej.2015.259.
40. Zanini F, Neher RA. 2012. FFPopSim: an efficient forward simulation package for the evolution of large populations. Bioinformatics 28: 3332–3333.https://doi.org/10.1093/bioinformatics/bts633.
41. Hill WG, Robertson A. 1966. The effect of linkage on limits to artificial selection. Genet Res 8:269 –294.https://doi.org/10.1017/S0016672300010156. 42. Dillon MM, Cooper VS. 2016. The fitness effects of spontaneous
muta-tions nearly unseen by selection in a bacterium with multiple chromo-somes. Genetics 204:1225–1238. https://doi.org/10.1534/genetics.116 .193060.
43. Desai MM, Fisher DS. 2007. Beneficial mutation selection balance and the effect of linkage on positive selection. Genetics 176:1759 –1798.
https://doi.org/10.1534/genetics.106.067678.
44. Kim W, Levy SB, Foster KR. 2016. Rapid radiation in bacteria leads to a division of labour. Nat Commun 7:10508. https://doi.org/10.1038/ ncomms10508.