STUDY THE RELATIONSHIP BETWEEN
PRODUCT DIVERSIFICATION
STRATEGY WITH FINANCIAL
PERFORMANCE
V. SUNDRAPRASAD
Assistant Professor of Commerce PSG College of Arts & Science (Autonomous)Coimbatore -14.
Dr. R. KRISHNAKUMAR
Assistant Professor of CommerceSt. Joseph’s College of Arts &Science (Autonomous) Cuddalore -1.
Abstract
In recent years, the relationship between performance and variety of company was an important experimental issue in financial management. Diversification strategies can affect the competitive balance in the industry. This study aims to measure the relationship between the two variables of diversification and financial ratios as criteria of accounting-based performance using required statistical tests. This research follows Ex-Post Facto Method with practical purpose. Statistical sample of this research are 99 companies listed in Tehran Stock Exchange Market. The results of this research have shown that applying relevant diversification strategy has no impact on financial performance of producing companies and irrelevant strategies has diverse tie with performance indicator and growth of company. Moreover, the impact of control
variables of company’s size, financial leverage,
growth opportunities and ratio of market value of equity to book value of equity on the relationships between research variables and assumptions have been measured in this study.
Keywords: Product Diversification Strategy,
Relevant Diversification, Irrelevant
Diversification, Financial Performance, Company’s Growth
I. INTRODUCTION
Many of today's organizations around the world move towards being larger and increase their business activities environment. One of the reasons for this is accountability to multiple needs of customers. Managers try to meet the multiple needs of customers and make them loyal to their organization. For this reason and other technical reasons, such as to prepare the raw material and finished product distribution within the system, many organizations have turned to diversity. The question that may arise in the minds of managers is that the diversification of the company's business to what extent can effect on the Company's performance and growth.
Financial ratios are considered as criteria for assessment of company’s performance. The
Statement of the Problem
This study aims to examine the strategies of diversifying the product and its effects on financial performance and growth. Diversity is the extent to which the institutions simultaneously work in the production and distribution of various products (Varaderajam and Ramanujam 1987). The objective of diversifying the product such as production and distribution is reduction of risk including operational and commercial. Applying product diversification strategy can affect on performance and growth of one company if it was an assessed effort for determining available resources for production of pursuing appropriate and coordinate strategies.
In today's dynamic markets, many firms to meet the needs of customers and the protection of life in competitive economic environments move toward expanding the production and distribution of its products. The company's market share is defined with products that offer in comparison with competitors in industry (Tehran & et al 2008).
New product development is an important factor in a country's economic wealth. Unfortunately, the importance of new product development cannot match with the level of success and the risk of failure is high on new product development. Despite this, and to identify new product failure rates in several studies, scientists warned that the failure rate of new products is still worrying. Therefore, the researchers have attempted to provide a prescriptive approach to help the best field of new product development for its success (Seyed Hosseini & Iranban 2004). The main problem of this research is to assess the modern strategies through product diversification strategies and on the other word, to improve the financial performance and growth by diversifying and to
achieve better result and more interest thorough that.
Importance & Necessity of Research
The profitability and development of selling is one of the most important and basic goals of the company; so, efforts to achieve a wide product and broad market is considered to be one of its main programs. Thus, one way to achieve this is to apply strategy of products diversification and in this study we are going to assess its impact on performance and growth of these companies. Other important reasons that led to assessment of this study are awareness and knowledge for managers who follow this strategy in various circumstances. Because the lack of understanding of the tools, time and conditions of applying, not only would not cause the growth and profitability of companies, but also it would have the opposite result. In recent years, the relationship between performance and diversity is a major issue in financial management. Diversification strategies can affect the competitive balance in an industry; while, the researchers come to three different result (positive tie, negative tie and no tie) between diversification and organizational performance.
Most previous studies deal with the relationship between product diversification strategy with organizational performance, capital structure and organizational structure. Some of the conducted research investigated the relationship between product diversification strategy and financial ratios and efficiency variables as performance variables. Therefore, empirical studies suggest that there is no relationship between product diversification strategy with financial ratios and efficiency for these two reasons:
Objectives of Research
The Ideal Objective: Provide codified guidelines in relation to measuring the performance and growth of the company.
The Overall Objective (Main): The new strategy of product diversification to achieve optimal performance and growth of stock companies.
Specific Objective (Partial): The scientific aim of this study is crediting the research hypothesis so that this research can be effective in raising the level of general knowledge required to the users and also help them better understand the elements of financial statements.
Applied Objective: The purpose of this study was to identify differences in the predictions of investors in the capital market in Iran and seeks to provide ways to reduce the information asymmetry between managers and other users of financial statements; in other words, by analyzing the relationship between product diversification strategy with financial performance and growth in the capital market in Iran, increase of the quality of accounting information demand can be predicted. Method of research:
This research is an analytical-experimental research which is applied in terms of objective. In connection with the results of sample, descriptive method and in generalizing the results of statistical population, inductive inference will be used. Because the collected data from the companies is based on the historical financial statements; so it is considered as an Ex-Post Facto research.
Sampling Method
Systematic elimination sampling method (screening) has been applied to do sampling. Data Collection Method
Study of Documents: Considering type of research, data will be collected based on previous
data based on theoretical basis and background of research.
Internet Search: It is used to collect related data to previous records.
Definition of Words & Expressions
Entropy Index: is the weighted mean of share of different parts’ operations in company
from the company's total operations. In this mean, weight is the inverse logarithm of the ratio of total operations per unit. Therefore, total diversity of a company can be achieved through this relationship:
M
Njj1
M
M N 1 Pijln
Pij j1 i1
NM
M
ln(M )Pjln(Nj)
DT= j1
N: Average sale of industry is gained from this
relationship
Pj: The Ratio of Total Operation (Sale) of
Company from ithIndustry
Pij: The Ratio of Total Operation (Sale) of
Company from ithBusiness in jthIndustry Total Number of Industry
Total Number of Business Nj: Business in jthIndustry
Diversification Strategy: To calculate the diversity of company’s product in three different
levels of total diversity, relevant and irrelevant diversity, the following steps have been gone through: First by using information in the Library of the Tehran Stock Exchange on the company studied collect the entire data concerning the sales of these companies in 2008 to 2013 about the level of products.
each company works in how many industry and business. Finally, applying total, relevant and irrelevant diversity ties, score of diversity in three level of total, relevant and irrelevant diversity for the companies of statistical sample are computed:
Return on Assets: ROA stated a profitability ratio for the company. This ratio is prepared for showing power of profitability of company in proportion of sum of book value of assets that will be compared between two or more companies in on industry in different sizes. ROA will be computed as below:
ROA=NI/TAS (net interest) / (total assets) Return on Equity: ROE stated a profitability ratio for the shareholders. This ratio is provided for showing profitability power of company in proportion to the book capital of the shareholders. ROE is computed as below: ROE=NI/TE (net interest) / (total equity)
Company’s Sales Growth: To assess this
variable, sales growth criteria is used which as measured as below:
GS=
Profit Margin: This ratio shows the profit of each Rial sale.
PM=
Statistical Population
Statistical population of research includes the whole companies listed in Tehran Stock Exchange. Given the 6-year period of research (opening of 2008 till closing of 2013) companies which are at least once a member of Tehran Stock Exchange in beginning of 2008 and their fiscal year end to March have been selected. Method of sampling was stage with systematic elimination. In this research, companies that have the whole following conditions have been elected as sample.
They have been member of Tehran Stock Exchange from the beginning of 2008. Their fiscal year end to March of each year.
Share of stock companies doesn’t have
significant trade gap (more than 6 months).
They have delivered their fiscal statement for review in stock exchange.
Some listed companies, including banks, financial institutions, financial investment companies, financial intermediaries and holding companies that have different reporting structure are removed from the samples. Among all listed companies in Tehran Stock Exchange till closing 2013, considering the foregoing limitations, statistical population reaches to 99 among 2008 to 2013.
Table 1
# of Co. Description
317 Co. The number of companies that were in exchange in the years 2008 to 2012.
(47)Co. Companies that their fiscal year does not end on March; and companies that have changes in fiscal year.
(69)Co. Companies doesn’t have significant trade gap (more than 6 months). (34)Co. Holding companies, financial broker, insurance, banks ...
(68)Co. Companies that have incomplete financial information
99 Co. The number of companies that their data is collected (final sample) In case of applying above terms and
limitations as systematic elimination, 99 companies have been elected as statistical population and all these companies have been selected as sample. Term of research is 6 consecutive year. Therefore,
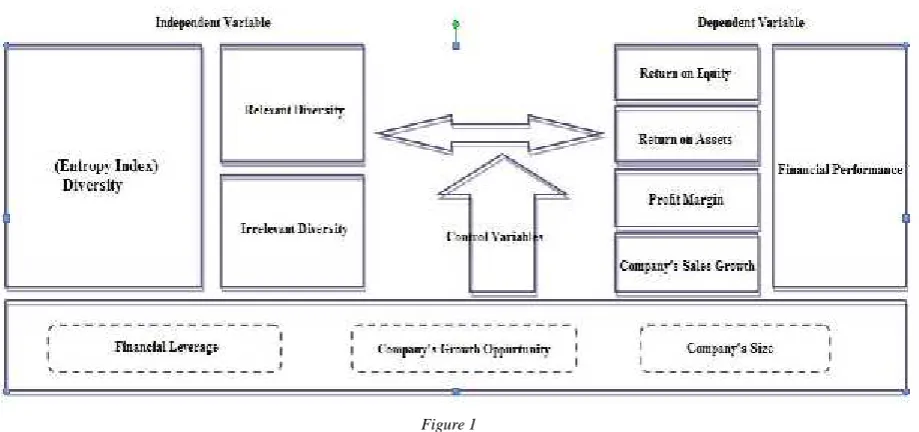
Model of Research
Studied variables in the form of one conceptual model and description of assessment and measurement of variables are as below:
Figure 1
Data Analysis
To analyze data, first collected data shall be transferred to EXCEL and after organizing and performing required computations, Eviews-8 econometric software will be applied for data analysis. Afterward, descriptive statistics are presented and using statistical tests, heterogeneity of variance and correlation coefficient are analyzed. Then, by using analysis of regression model, result of research process, significant assessment of regression model and coefficient of variables, hypotheses will be rejected or confirmed. Statistical Methods
Considering the fact that in this research, Compound Linear Regression is used as compound method or Data Panel, following methods is used for analyzing assumptions:
Kolmogorov–Smirnoff Test to determine normality of distribution of dependent and independent variables. Durbin - Watson Statistics to determine normality of distribution of reminders in Regression
Distribution Diagram or variance comparison tests to assess the stability of variances. Pearson correlation test to analyze linear independence of the independent variables.
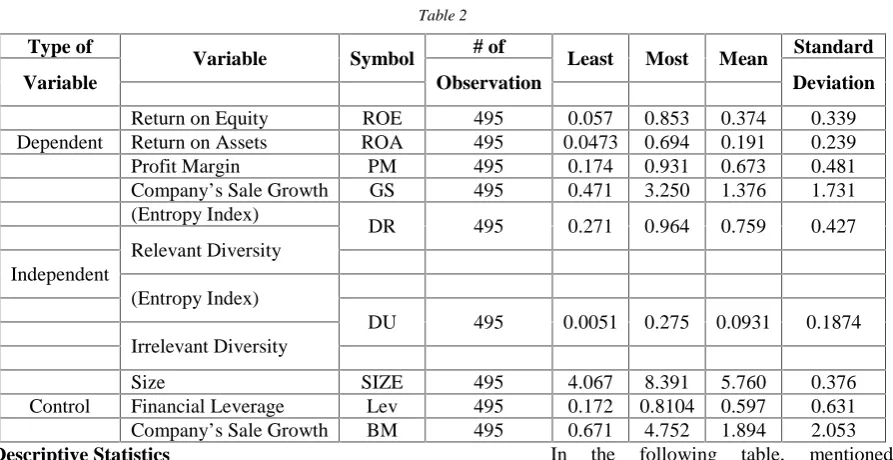
Table 2
Type of
Variable Symbol # of Least Most Mean Standard
Variable Observation Deviation
Return on Equity ROE 495 0.057 0.853 0.374 0.339
Dependent Return on Assets ROA 495 0.0473 0.694 0.191 0.239
Profit Margin PM 495 0.174 0.931 0.673 0.481
Company’s Sale Growth GS 495 0.471 3.250 1.376 1.731
(Entropy Index)
DR 495 0.271 0.964 0.759 0.427
Relevant Diversity Independent
(Entropy Index)
DU 495 0.0051 0.275 0.0931 0.1874
Irrelevant Diversity
Size SIZE 495 4.067 8.391 5.760 0.376
Control Financial Leverage Lev 495 0.172 0.8104 0.597 0.631
Company’s Sale Growth BM 495 0.671 4.752 1.894 2.053
Descriptive Statistics
The main central index is the mean that shows balance and distribution center and is a good indicator to show data centrality. For instance, amount of mean for ROE is 0.374 which indicates that more data are centralized in this point. Moreover, distribution parameters are criteria for determining the amount of each distribution or dispersion relative to the mean. The most important parameters of the distribution is standard deviation that the variable of return on assets and growth opportunities for the company to have the lowest and the highest standard deviation.
Dickey-Fuller Generalized Test for Stability of Variables:
In the following table, mentioned variables have less p-value from 0.05; therefore, H0 is rejected and variables are stable.
Table 3
Variable Statistics P - value
ROE 594 0.000
ROA 594 0.000
PM 594 0.000
GS 594 0.000
DT 594 0.000
Hausman Test
In 1st and other hypotheses, given that p-value obtained is equal to zero in Lymr F test, H0is rejected (p-value≤0.05) and panel data methods are accepted. Furthermore, considering the amount of p-value from Hausman Test that is equal or lower than 0.05, Hausman H0is rejected and fixed effects will be accepted.
Table 5
Hypotheses Lymr F probability p-value Result Hausman probability p-value Result Test
Hypotheses .1 3.942 0.000 P<0.05 Panel data 6.782 0.000 P<0.05 Fixed effects
Hypotheses .2 P<0.05 Panel data 9.7367 0.0001 P<0.05 Fixed
6.384 0.000 effects
Hypotheses Analysis
Testing 1st Main Hypothesis: There is relationship between relevant diversity with financial performance.
PERFit= α0+ β1DRit+ β2size it+ β3lev it+ β4 BMit+ εit
This hypothesis is tested as per following hypotheses: Analyzing Subsidiary Hypotheses: There is relationship between relevant diversity in product with return on equity.
ROEit= α0+ β1DRit+ β2sizeit+ β3levit+ β4BM it+ εit
Table 6
Dependent Variable of ROE
Variable Coefficient Standard Deviation Statistics t P-Value
C 6.57 1.614 4.0712 0.000
DR 57.4 1.474 0.875 0,0008
SIZE 9.97 4.938 2.019 0.0038
Lev 1.14 0.570 1.999 0.0758
BM 0.928 0.176 5.274 0.000
Durbin–Watson Statistics 1.684 Adjusted R-squared
Prob (F-statistic) 0.000 0.3932
Considering the result of regression model test as above, it has been observed that the p-value related to Prob (F-F statistic) that indicated the significance of total Regression is equal to 0.000 and indicate that the model is meaningful in 95% confidence level. Adjusted determination coefficient (R2) is equal to 0.3932 and indicates that 39% of changes of dependent variable can be explained with independent variables that shows the good explanatory power of this Regression. Furthermore, Durbin–Watson Statistics is equal to 1.684 that this value in 1.5 to 2.5 distances
indicates lack of correlation between variables. As it can be seen above, coefficient of relevant diversity (DR) in product is equal to 8.75 and Prob is 0.0008. The t statistics and p-value of this variable indicates the significance of this coefficient in error level of 5%. These results show that there is direct and meaningful relationship between relevant diversity in product with return on equity.
There is relationship between relevant diversity in product with return on assets.
ROAit = α0+ β1 DRit + β2size it + β3lev it + β4 BMit+ εit
Table 7
Independent Variable of ROA
Variable Coefficient Standard Deviation Statistics t P-Value
C 2.91 1.328 2.192 0.0089
DR 3.43 0.970 3.537 0.0014
SIZE 4.58 1.098 4.172 0.0001
Lev 1.18 0.530 2.228 0.0099
BM 277.90 0.081 8.36 0.0000
Durbin–Watson Statistics 1.787 Adjusted R-squared
Prob (F-statistic) 0.000 0.361
Considering the result of regression model test as above, it has been observed that the p-value related to Prob (F-F statistic) that indicated the significance of total Regression is equal to 0.000 and adjusted determination coefficient (R2) is
product is equal to 3.43 and Prob is 0.0013. The t statistics and p-value of this variable indicates the significance of this coefficient in error level of 5%. As to these results, H1based on existence of direct and meaningful tie between relevant diversity in product with return on asset is accepted.
II. CONCLUSION
In diversification, a continued growth should exist in ability of management of diversity-oriented managers. One of the reasons for not getting the desired results is that managers follow the diversity strategy while their management's ability doesn’t have consistent growth with expand
of their complex.
Diversification companies have shortage of skilled and experienced labor that has skill, capability, experience and knowledge of several businesses. This subject can be affective on relationship of diversification & performance.
The cost of setting up diversified companies especially irrelevant diversity is high. As long as the costs are too high, it negatively affects the financial performance of diversified companies.
Iran's economic situation is mostly affected by the profitability of rents, market conditions and government support and minor factors. Therefore, strategy selection will not have expected impact on performance and profitability.
Root of strategy and its effectiveness lies in competition. Since the competition is not a full competition in Iran, strategy selection will not have expected impact on performance, management theories can be applied in competitive situations.
III. REFERENCES
1) Grant R.1988. ‘Diversity, Diversification and Profitability among British Manufacturing Companies’, Academy of Management Jo
urnal, Vol. 31, No. 4.
2) Hall Ernest H.2007. ‘Diversification and Performance Measurement Problems:An International Investigation’, Journal of International Management Studies.
3) Hangr J. David, El Violin T.2002. "The Basics of Strategic Management", translated by Mohammad Arabi and Davood Izadi, Cultur al Research Bureau.
4) Oyedijo A.2012. ‘Effects of Product-Market Diversification Strategy on Organizational Performance and Growth: An Empirical Study of Some
5) Companies in Nigeria’, American International Journal of Contemporary Research, Vol. 2, No. 3, 199–210.
6) Porter M. 2005. Competitive Strategy and Industry Analysis Techniques and Competitors, Majidi, Jahangir, Mehrpooya, A., Raha Cultural Services Institute, 1stEdition. 7) QaemiMH, Shahriari M.2009. Corporate
Governance and Financial Performance of the Companies, Accounting Developments Shiraz University Journal, 2009, Volume I, Number I, Pp 113 to 128.
8) Ramırez A, Escuer M, Espitia M.2002. ‘The impact of product diversification strategy on the corporate performance of large Sp anish firms’, Espanish Economic Review, 4, 119–
137.
9) Rumelt Richard P.1982. ‘Diversification Strategy and Profitability’, Strategic Management Journal, Vol. 3, No. 4, 359-369. 10) Seyed Hosseini SM, Ayranban SJ.2004. "New
Product Development Strategy” The Approach