Analysis of ECG Data Compression Techniques
Full text
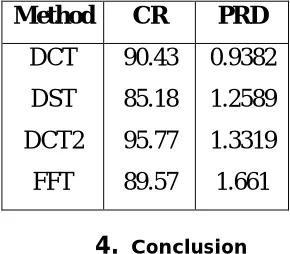
Figure
Related documents
Survey No. Mariano Francisco Rego. T: Narayan llIma Velip. T: Mahadev' Raghunath Shlrodkar. T: Sada Pundalik VeUp. T: Narayan'Rama Velip. Madhu Shamba Naik. T: Sada
As one of our main results, we derive (tight) bounds on the Price of Anarchy for clustering games on Erd˝ os-R´ enyi random graphs, which, depending on the graph density, stand in
Audio signals from the [MIC] connector (FRONT unit; J303 or MAIN unit; J2003) are amplified at the microphone ampli- fier (IC2007, pins 1, 2) and then applied to the DSP circuit
Gas chromatogram of volatile products from the thermochemical degradation of whitefly honeydew on con- taminated cotton lint heated at 180°C under a stream of air for 3 hours
Turn left at the traffic light at the end of the exit ramp onto NC 751/Cameron Blvd and drive approximately 0.7 mile to the third traffic light (Science Drive).. Turn left
High titers of neutralizing antibody against Cox- sackie B, virus were detected in serum specimens obtained on the sixteenth and twenty-third days of illness. TREATMENT AND COURSE :
The proposed indexing that uses Generalized Hash Tree (GHT) expedites projection and selection operations on encrypted medical XML records stored in WORM storage.. We implemented
