[Vértesy
et al.
, 6(9): September, 2019]
ISSN 2349-0292
Impact Factor 3.802
GLOBAL JOURNAL OF ADVANCED ENGINEERING TECHNOLOGIES AND
SCIENCES
INFLUENCE OF THE SIZE OF SAMPLE IN MAGNETIC ADAPTIVE TESTING
G. Vértesy*
1, B. Bálint
2, Sz. Gyimóthy
2, J. Pávó
2*1
Hungarian Academy of Sciences, Centre for Energy Research, Budapest, Hungary
2
Department of Broadband Info communications and Electromagnetic Theory, Budapest
University of Technology and Economics
DOI
: 10.5281/zenodo.3483453
ABSTRACT
Magnetic adaptive testing is a nondestructive method, based on systematic measurement and evaluation of magnetic hysteresis loops, to characterize the degradation of ferromagnetic materials. Magnetic parameters in general depend on the size of the samples to be measured, and results of measurements, performed on different size samples cannot be compared with each other. In this work it is shown, that by proper choice of the size of magnetizing yoke, the degradation of the material can be correctly determined even in that case if different size of samples are measured.
Keywords: Nondestructive testing, Magnetic hysteresis, Electromagnetic simulation, Magnetic adaptive testing.
INTRODUCTION
The long-term operation (LTO) of existing nuclear power plants has already been accepted in many countries as a strategic objective to ensure adequate supply of electricity over the coming decades. LTO requires reliable tools for estimating the remaining useful lifetime. In this context, one of the main questions is: How can nondestructive (NDE) methods monitor the progression of material degradation on components complementary to the destructive sample-based tests while accounting for material heterogeneities? It is well known that changes of the microstructure and material properties can be non-invasive detected. Magnetic measurements are one of the promisingg candidates of novel nondestructive methods. Among others, degradation of nuclear pressure vessel steel material was investigated by a novel magnetic nondestructive testing method, so called Magnetic Adaptive Testing (MAT) [1]. MAT measures series of minor magnetic hysteresis loops and a number of magnetic descriptors are evaluated, which are suitable for proper and sensitive characterization of material degradation. By applying this technique the minor hyteresis loops are measured on a sample series having different material degradation or material characteristics, and the magnetic descriptors of each sample are compared with the corresponding descriptor of the reference sample. Such a way correlation can be found between magnetic parameters and the independent parameter(s) of samples.
Effectivity of MAT was demonstrated in several previous works, as summarized in [1]. In some recent works our attention was focused for application of MAT in nuclear industry. Samples were thermally treated by a special step cooling procedure to produce microstructural changes similar to those occuring at irradiation. It was found that this type of degradation can be easily followed by magnetic measurements. Results of Charpy impact tests were compared with the magnetic parameters. A good, reliable and nearly linear correlation was found between magnetic descriptors and transition temperature [2]. It was also shown that the ferromagnetic base material of reactor pressure wessel steel can be inspected even through the relatively thick cladding, and the measurement through the cladding result the same correlation between magnetic parameters and independent variable as obtained by direct measurement of base material [3].
A basic and important feature of MAT is, that it is a relative method: parameters of the measured, degraded samples are compared with the corresponding parameter of a reference (not degraded) sample. We get information such a way about the degree of degradation of material as function of independently determined parameters. However, for the reliable comparison of the different samples of the same series the measurement should be rigorously performed by the same parameters of measurement, such as size of magnetizing yoke, slope of the change of magnetizing field, surface conditions, etc.
[Vértesy
et al.
, 6(9): September, 2019]
ISSN 2349-0292
Impact Factor 3.802
the sample size on the evaluated MAT parameters. As an example for this analysis, cast iron samples were chosen for investigation.Measurements were performed on a special series of cast iron samples. Cast iron is a very important and traditionally used material in industry [4]. The material properties are determined by the structure of the material: metallic matrix composition and graphite morphology. Both of them have a great influence on mechanical characteristics of the construction objects made of cast iron. This is the reason, why the study of both matrix composition of cast iron material (pearlite, ferrite, chill, carbide content) and graphite morphology is important. There are several types of cast iron. In our work we deal with the study of the so-called ductile cast iron. Ductile cast iron is frequently used in that cases, where weight saving is important. For this purpose thin walled cast iron is required and ductile cast iron is an ideal material, because it can contain proeutectoid cementite structures, known as ‘chill’ structures. Thin-walled cast iron components suffer from an increased cooling rate during solidification in the casting process, and chill structures are often crystallized in them. The inclusion of chill structures makes the cast iron hard and brittle and represents a real danger for cutting tools used during the cast iron next machining. Therefore, quantitative non-destructive evaluation of matrix structures of cast irons becomes a highly required part of castings acceptance in foundry industries. In a previous work the chill structure in ductile cast irons was evaluated quantitatively by the nondestructive incremental permeability method focusing on the dependence of chill structures on magnetic properties [5]. Application of Magnetic adaptive testing on ductile cast iron was reported in [6], where the results of the non-destructive magnetic tests were compared with the destructive mechanical measurements of Brinell hardness and good correlation was found between them.
SAMPLE PREPARATION
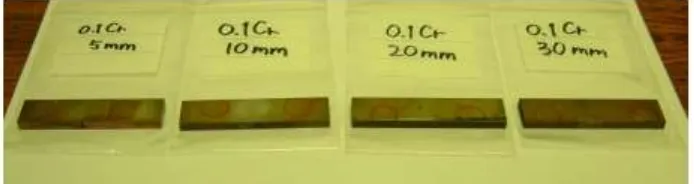
Ductile cast iron samples were cast into a step-bar shape mold, having 4 steps. Thicknesses of the steps are 5 mm, 10 mm, 20 mm, and 30 mm, respectively. The step-bar sample is shown in Fig. 1. Due to the thickness difference, different cooling rates were realized during solidification. This process resulted in different chill inclusions in the different steps of the same sample. Table 1. shows chemical composition of the step-bar sample.
Fig. 1. The step-bar sample.
Table 1. Chemical composition of step-bar ductile cast iron sample (values in wt%)
For the measurements rectangular plate-shaped specimens were machined from each step of the samples, the sizes of them are given in Table. 2. The microstructure of the samples was observed with an optical microscope. The volume fractions of pearlite, ferrite, chill, and graphite were evaluated quantitatively by image analysis of the etched and nonetched specimen micrographs. Detailed results of the image analysis are reported in [3]. Because micro-structure of the ductile cast iron consists of pearlite, ferrite, chill, and graphite structures, the volume fraction of pearlite can be evaluated by xP = 100 – xF – xC – xG, where xP is the fraction of pearlite %
area, xF is the fraction of ferrite % area, xC is the fraction of chill % area, and xG is the fraction of graphite %
area
[Vértesy
et al.
, 6(9): September, 2019]
ISSN 2349-0292
Impact Factor 3.802
Table 2. Original sample sizes
Fig. 2. Original size of samples.
Each piece has different size, as indicated above the photo and givern in Table 2. In the first series of measurement different size samples were used, as shown in Fig. 2., and MAT mesurements were performed on each pieces. In next step, uniform size (60mm x 14.8mm x 4.2mm) pieces (shown in Fig.3) were machined and MAT measurements were repeated on each piece.
Fig. 3. Uniform size (60mm x 14.8mm x 4.2mm) of samples, machined from the original size pieces.
MAGNETIC ADAPTIVE TESTING
Magnetic adaptive testing was used for magnetic measurements. Series of minor magnetic hysteresis loops were measured by using a yoke for magnetizing the samples. During MAT measurement the samples are periodically magnetized with step-wise increasing amplitudes. A specially designed Permeameter [7] with a magnetizing yoke was applied for measurement of families of minor loops of the magnetic circuit differential permeability. The magnetizing coil, wound on the yoke, gets a triangular waveform current with step-wise increasing amplitudes and with a fixed slope-magnitude in all the triangles. This produces time-variation of the effective field in the magnetizing circuit and voltage signal is induced in the pick-up coil wound also on the yoke. As long as the magnetizing field sweeps linearly with time, the voltage signal in the pick-up coil is proportional to the mean differential permeability of the magnetic circuit. It means that the measured permeability loops (which can be presented later) highly depends on the slope of magnetizing field, and also on the actual magnetizing yoke, which is used for the measurements.
[Vértesy
et al.
, 6(9): September, 2019]
ISSN 2349-0292
Impact Factor 3.802
follow the degradation of materials (due to heat treatment, neutron irradiation, etc). We measure the series of samples, and compare the actual magnetic parameters with the corresponding parameter of the reference sample as function of material degradation. It is absolutely necessary that all samples with different degradation should be measured by the same experimental parameters. Details of MAT technique are described in [1]In the present case, where cast iron material is investigated, the term ”degradation” means modification of the matrix structure of cast iron samples, generated by the different cooling rates, and the independent parameters are volume ratio of chill, pearliete and graphite. These type of samples were previously investigated by Magnetic adaptive testing, and it was shown, that the relative pearlite volume fraction of the metallic matrix of cast iron samples could be determined by this method with a good reliability [8]. Another type of cast iron, the so called flake graphite cast iron was also investigated by MAT and good, linear correlation was found between magnetic descriptors and Brinell hardness [9].
SIMULATION OF THE MAGNETIC FLUX CHANGE
As it was shown in [10], simulation of magnetic flux densitiy in the magnetic circuit during MAT measurement is a useful tool for determining the optimal parameters of the actual measurement arrangement. In this calculation the size of the magnetizing yoke was changed and the influence of this modification was studied on the detectable flux density. A similar simulation was performed in the present case, too, becasue it is expected that magnetic flux densitiy in the cross section of the magnetizing yoke depends on the size of the measured sample: by decreasing the size of the sample more and more flux spread to the air. This is the reason, why we also expect different measured permeability loops if the size of the sample is modified, while other parameters of the measurement is kept fixed. To check the validity of this assumption, as a firs step, the variation of the magnetic flux density in the cross section of the magnetizing yoke was calculated if the size of the measured sample was modified.
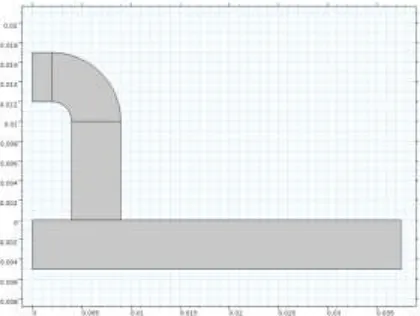
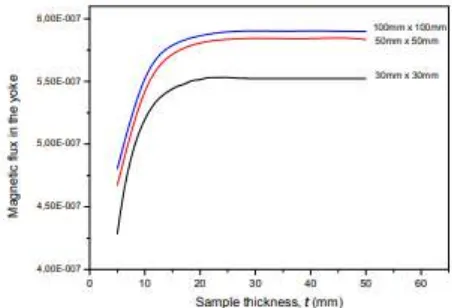
The AC/DC Module of the Comsol Multiphysics® finite element software was used for the simulation [11]. A magnetizing yoke made of laminated steel (having μr = 100 relative permeability) was placed on the top of the sample (having μr = 5000 relative permeability). The size of the sample was modified and the change of the magnetic flux was calculated in the cross section of the magnetizing yoke. The size and geometry of the magnetizing yoke is given in Fig. 4. The lateral size of the sample was modified, and the magnetic flux in the yoke was calculated for three different sizes as functions of the sample thickness. The lateral sizes were 30mm x 30mm, 50mm x 50mm, and 100mm x 100 mm respectively. The excitation is prescribed as a surface current density on the lateral surfaces of the “bridge” of the yoke, which adds up to a total current of 1 AT. The flux of the yoke is computed by the integral of the flux density over the cross-sectional surface of the yoke. The magnetic flux was calculated by systematic modification of the thickness of the sample. Fig. 5 shows, how the surface integral of the perpendicular component of the magnetic induction depends on the thickness of the sample to be magnetized.
[Vértesy
et al.
, 6(9): September, 2019]
ISSN 2349-0292
Impact Factor 3.802
Fig. 5. The calculated magnetic flux in the cross section of the yoke (shown in Fig.3) as a function of the sample thickness for three different samples having lateral dimensions of 30x30, 50x50 and 100x100 mm
It is seen very well in the figure that the generated magnetic flux in the magnetizing yoke depends significantly on the dimensions of the sample to be measured. The calculations proved the assumption that the size of sample has a large impact on the magnetic flux in the yoke by using the same size of magnetizing yoke. It is also demonstrated that the thickness of the sample has larger influence than the lateral size of sample. The curve becomes flat between 15 and 20 mm thickness. If smaller size of magnetizing yoke is used (results are not presented here), this „saturation point” is shifted towards lower values of thickness. The result of simulation gives a chance that by the proper choice of the ratio of magnetizing yoke size and sample size, the influence of sample can be limited.
RESULTS
MAT measurements were made on all original size pieces of samples, described in Section 2, and the measurements were repeated by the same parameters after cutting the samples to unifornm size. Three different size yokes were used for the investigation, all measurements were performed by all of these yokes. The size of yokes are given in Fig. 6 and in Table 3. The yokes are made of C shaped laminated steel.
Fig.6. Sketch and characteristic dimensions of the yokes (on left side the sole of the yoke is shown)
Table 3: Characteristic dimensions of the yokes, used for the measurements
[Vértesy
et al.
, 6(9): September, 2019]
ISSN 2349-0292
Impact Factor 3.802
Fig. 7. The measured permeability loops on original and on uniform size pieces of the 30 mm step samples, by applying yoke „B”.
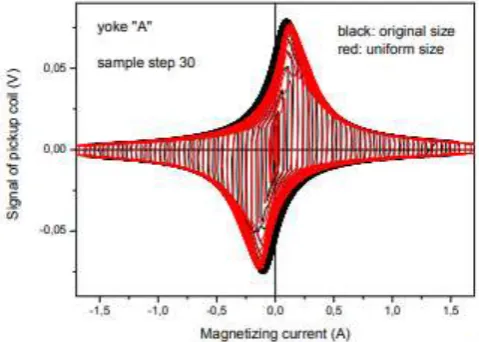
It is seen very well, that the reduction of the sample size originates a significant decrease of permeability, in correlation with the results of simulation. However, if the size of magnetizing yoke is decreased, the differences in the measured permeability almost disappear. Fig. 8 shows the permeability loops measured on the 30 mm step sample, on original and on uniform size pieces, by using yoke „A”
Fig. 8. The measured permeability loops on original and on uniform size pieces of the 30 mm step samples, by applying yoke „B”
MAT evaluation were performed on all pieces of the investigated samples and MAT degradation functions were determined. Those, which were optimized for description of the studied dependences (as functions of pearlite content and of Vickers hardness) were considered. Optimization means that those degradation functions were chosen from the big data pool, generated by the MAT evaluation, which were the most sensitive with respect to the change of the independent parameter, and at the same time they were highly repeatable, and in such a way the most reliable. The details of evaluation is given in [1]. In case of pearlite content the permeability, m, was found as the optimal one, while in case of hardness the permeability, 1/m, was found as the optimal one characterizing the correlation between magnetic and independent parameter.
[Vértesy
et al.
, 6(9): September, 2019]
ISSN 2349-0292
Impact Factor 3.802
Fig. 9. The optimal normalized MAT m–descriptor versus the relative volume fraction of pearlite content (a), and optimal normalized MAT 1/m–descriptor versus the Vickers hardness (b) measured on the investigated original size and uniform
size samples by using magnetizing yoke „C”.
Fig. 10. The optimal normalized MAT m–descriptor versus the relative volume fraction of pearlite content (a), and optimal normalized MAT 1/m–descriptor versus the Vickers hardness (b) measured on the investigated original size and
uniform size samples by using magnetizing yoke „B”.
Fig. 11. The optimal normalized MAT m–descriptor versus the relative volume fraction of pearlite content (a), and optimal normalized MAT 1/m–descriptor versus the Vickers hardness (b) measured on the investigated original size and
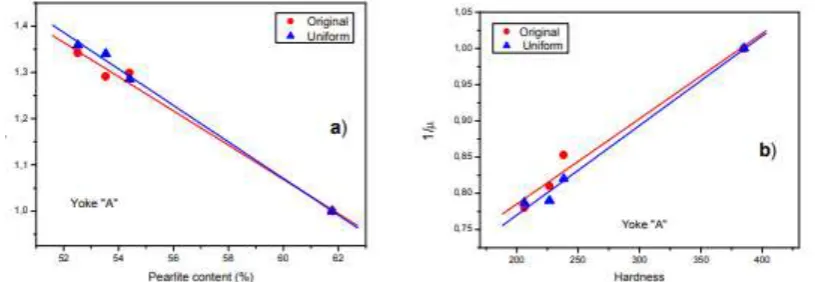
uniform size samples by using magnetizing yoke „A”
DISCUSSION
[Vértesy
et al.
, 6(9): September, 2019]
ISSN 2349-0292
Impact Factor 3.802
confirm the existing linear correlation between magnetic parameters and permeability and also between magnetic parameters and hardness.The novelty of the present work is the investigation of the influence of the sample size on the magnetic descriptors. It is seen very well that both the directly measured permeability curves (Figs. 7 and 8) and the MAT descriptors (Figs. 9, 10 and 11) depend significantly on the size of the sample. If we want to make any statement about correlation between magnetic parameters and independent other characteristics, this fact should be taken into account.
However, if the size of the magnetizing yoke is decreased, the difference is disappearing. Fig. 11 demonstrates that by using the smallest size magneziting yoke (yoke „A”) the obtained correlation between MAT descriptors and independent parameters is the same, regardless on the size of the actual sample. With other words: the size of the sample should not be taken into account, reliable correlation can be get between MAT parameters and structural characteristics. It is interesting and worth of mentioning that in any case linear correlation exists, but the slope of the line is significantly different if different size samples are measured and compared.
The slope of the line in both cases is the same if the measurements are performed on uniform size samples, regardless on the size of the yoke, and on any size of samples by using small size magnetizing yoke. This fact confirms that the „proper” correlation is determined either by using uniform size sample or by using small size magnetizing yoke in the case of different size samples, too.
CONCLUSIONS
It was demonstrated both empirically and by simulation that the result of magnetic measurement (performed by systematic measurement and evaluation of minor magnetic hysteresis loops) strongly depend on the size of sample and of the size of magnetizing yoke, which is used for magnetization. However, if the size of the magnetizing yoke is decreased to a proper size (or the sample is large enough compared with the size of yoke), the correlation does not depend any more on the sample size. Evidentlya, the exact size of magnetizing yoke can be determined in the knowledge of the size of samples to be investigated. In this work we made only an illustration by using a certain geometry on a certain material.
ACKNOWLEDGEMENTS
The work was supported by “NOMAD” project. This project (Nondestructive Evaluation System for the Inspection of Operation-Induced Material Degradation in Nuclear Power Plants) has received funding from the Euratom research and training programme 2014-2018 under grant agreement No 755330. Authors are indebted to Prof. Uchimoto and to Dr. Matsumoto (Institute of Fluid Science, Tohoku University, Sendai, Japan) for the sample series to be measured and for providing the hardness and pearlite content data.
REFERENCES
[1]. Tomáš, G. Vértesy, „Magnetic Adaptive Testing“, in Nondestructive Testing Methods and New Applications, M.Omar (Ed.), ISBN: 978-953-51-0108-6, (2012), InTech: http://www.intechopen.com/articles/show/title/magnetic-adaptive-testing
[2]. G. Vértesy, A. Gasparics, I. Szenthe, F. Gillemot, I. Uytdenhouwen, Inspection of Reactor Steel Degradation by Magnetic Adaptive Testing, Materials 2019, 12, 963.
[3]. G. Vértesy, A. Gasparics, I. Szenthe, F. Gillemot, Magnetic nondestructive inspection of reactor steel cladded blocks, GLOBAL JOURNAL OF ADVANCED ENGINEERING TECHNOLOGIES AND SCIENCES, 6(6): June, 2019, ISSN 2349-0292, DOI:10.5281/zenodo.3246763
[4]. C.F. Walton and T.J. Opar (Eds.), Iron casting handbook, Iron Casting Society, Inc., NewYork, 1981. [5]. T. Matsumoto , T. Uchimoto, T. Takagi, G. Vertesy, Evaluation of Chill Structure in Ductile Cast Iron
by Incremental Permeability Method, International Journal of Applied Electromagnetics and Mechanics 50, 1–4, (2015)
[6]. G. Vértesy, T. Uchimoto, I. Tomáš, T. Takagi, Nondestructive characterization of ductile cast iron by magnetic adaptive testing, Journal of Magnetism and Magnetic Materials, 322, 3117–3121, (2010). I. Tomáš, O. Perevertov, Permeameter for Preisach approach to materials testing, JSAEM Studies in Applied Electromagnetics and Mechanics 9, Ed. Takagi T, Ueasaka M, IOS Press, Amsterdam, p. 5., 2001
[Vértesy
et al.
, 6(9): September, 2019]
ISSN 2349-0292
Impact Factor 3.802
[8]. G. Vértesy, T. Uchimoto, T. Takagi, I. Tomáš, H. Kage, Nondestructive characterization of flakegraphite cast iron by Magnetic adaptive testing, NDT & E INTERNATIONAL 74, 8-14, (2015) [9]. G. Vértesy, B. Bálint, A. Bingler, S. Gyimóthy, S. Bilicz, J. Pávó, Simulation of magnetic lux
distribution for the measurement of the local thinning of ferromagnetic plates, International Journal of Applied Electromagnetics and Mechanics 55, 597–612, (2017).