A STUDY ON CHALLENGES AND IMPACT
OF SUPPLY CHAIN MANAGEMENT OF
FMCG IN RETAIL SECTORS IN INDIA
V. MAHALAKSHMI NATCHATHIRAM
Associate professor
P.G and Research Department of Commerce Pachaiyappa’s College
Chennai 600 030
Dr. SHRIMATHY RAMALINGAM
Associate Professor and Head Department of Commerce Pachaiyappa's College for Women
Kancheepuram.
Abstract
Retailers have met so many challenges on time-to-market reductions are necessary due to shorter and shorter product life cycles, greater product variety causing more fluctuation in demand calls for high responsiveness in supply chains, and the ever-increasing need for shorter lead times continues. However, as a result of the power that comes with control over consumer contacts, retailers today have the opportunity to organize the work in their supply chains in suitable ways.
The aim of this paper examines the retailers organize their supply chain challenges and impact of day to day market compete to the customer’s needs and how are supply chain management affected the retail sector. These studies conduct the survey in order to utilize the cost competition and their organized activities of cost value propositions. According to the research utilizing time-based competition was conducted. Eventually, the studies were found with line theories in this filed, i.e., that the nature of products’ demand pattern is crucial for that which should be focused on, and that physical efficiency is important to cost-based competition and market responsiveness in time-based competition.
Keywords: Supply chain, Retail sectors, Market
Competition, etc.
I. INTRODUCTION
xMost of the modern organizations have adopted the new environment and the main shift is featured as the shift from the vertical bureaucracies to horizontal corporations. There are seven major modern trends which feature such corporations and they are as organized around the process, not tasks; a flat hierarchy; team management; measuring performance by customer satisfaction, maximization of contacts with suppliers and customers; information, training, and retraining of employees at all levels and rewards based on team performance.
The contemporary business life cycle is process driven and chain oriented; hence integration has become a core-question for companies. The problems and challenges with the traditional vertical co-operation between organizations are costly and time-consuming, instead of co-operating; there is also no scope of cost reductions or profit improvements at the expenses of someone else in the supply chain.
Supply Chain
difficult to put into a practical context. Therefore, the business view on supply chains is somewhat arbitrary, leaving managers to decide their own boundaries of the supply chain. The alignment of
firms is in the literature alternating called a supply chain, a demand chain, a value chain, or a marketing channel. Figure: 1.1
Work in a Supply Chain
The work in a supply chain includes the performance of label marketing flows. Nine generic flows between channel members are identified. Some of the flows move forward through the channel (physical, ownership, promotion), some move backward (ordering and payment), whereas other flows move in both directions (negotiation, financing, risking, information). Figure: 2
Influence of Supply Chain Management
There are various ways to look at the supply chain. One can say that it starts with the raw material vendor and ends with the customer; thus, it includes purchasing, marketing and even consumer buying the product. Therefore all the processes involved in the entire spectrum from demand generation to demand satisfaction can be called as supply chain management. Today, in some advanced companies
sale of the product takes place. This implies that there are transparency and information flow in the entire chain resulting inappropriate action at each point.
value generated. The value a supply chain generates is the difference between what the final product is worth to the customer and the costs the supply chain incurs in filling the customer's request. For most commercial supply chains, the value will be strongly correlated with supply chain profitability (also known as supply chain surplus), the difference between the revenue generated from the customer and the overall cost across the supply chain.
For example, a customer purchasing a mobile Best Buy pays Rs.1800, which represents the revenue the supply chain receives. Best Buy and other stages of the supply chain incur costs to convey information, produce components, store them, transport them, transfer funds, and so on. The difference between the Rs.1800 that the customer paid and the sum of all costs incurred by the supply chain to produce and distribute the router represents the supply chain profitability or surplus. Supply chain profitability or surplus is the total profit to be shared across all supply chain stages and intermediaries. The higher the supply chain profitability, the more successful is the supply chain. Supply chain success should be measured in terms of supply chain profitability and not in terms of the profits at an individual stage.
II. RESEARCH METHODOLOGY Since the core objective of the study is to identify and study the process for Supply Chain Management with performance indicators of the supply chain in FMCG industry thus the primary
focus was to gather the factors from literature which is important for the task at hand & to ensure that they are correlated factors in practice also. Primary data were collected using questionnaire cum interview methodology and was analyzed using different techniques. In addition to that research is focused on the impact of Supply Chain Management on Productivity and efficiency.
Focus groups
• Diaries / written accounts
• Participant observation / non-participant observation
• Media sources • Through schedule • Warranty cards
• Distributors or Store audits • Pantry audits
• Consumers panels • Use of mechanical device • Projective technique
Hypothesis
H1. There is no significant gap between the consumers and the product available in the market.
H2. There is no significant change in the integrated variables through-out the supply chain product distribution.
H3. There is no significant mark of change in consumer satisfaction with desired product available according to their demand, taste, preferences, and income.
III. DATA ANALYSIS AND INTERPRETATION
Gender
Frequency Percent Valid Percent
Cumulative Percent Valid
Male 133 60.5 60.5 60.5
Female 87 39.5 39.5 100.0
Taste
Frequency Percent Valid Percent Cumulative Percent
Valid
Agree 70 31.8 31.8 31.8
Strongly Agree 44 20.0 20.0 51.8
Neutral 32 14.5 14.5 66.4
Dis Agree 41 18.6 18.6 85.0
Strongly Disagree 33 15.0 15.0 100.0
Total 220 100.0 100.0
Product Available in Market
Frequency Percent Valid Percent Cumulative Percent
Valid
Satisfied 70 31.8 31.8 31.8
Highly Satisfied 42 19.1 19.1 50.9
Neutral 40 18.2 18.2 69.1
Dissatisfied 34 15.5 15.5 84.5
Highly Dissatisfied 34 15.5 15.5 100.0
Total 220 100.0 100.0
Income
Frequency Percent Valid Percent
Cumulative Percent
Valid
Upto 20,000 62 28.2 28.2 28.2
20,001 - 30,000 70 31.8 31.8 60.0
30,001 - 40,000 34 15.5 15.5 75.5
More than 40,000 54 24.5 24.5 100.0
Total 220 100.0 100.0
Demand
Frequency Percent Valid Percent Cumulative Percent
Valid
Satisfied 62 28.2 28.2 28.2
Higly Satisfied 74 33.6 33.6 61.8
Netural 41 18.6 18.6 80.5
Dissatisfied 23 10.5 10.5 90.9
Highly Dissatisfied 20 9.1 9.1 100.0
Total 220 100.0 100.0
Desirable Product
Frequency Percent Valid Percent Cumulative Percent
Valid
Agree 73 33.2 33.2 33.2
Highly Agree 56 25.5 25.5 58.6
Neutral 57 25.9 25.9 84.5
Disagree 18 8.2 8.2 92.7
Highly Disagree 16 7.3 7.3 100.0
The above table reveals that out of 220 respondents only 133(60.5%) of respondents are a male group and remaining 87(39.5%) of respondents are a female group of amongst respondents. Regarding the Product Available in market 70(31.8%) of respondents are satisfied their available product and 42(19.1%) of the respondents their answers regarding available products is highly satisfied in their desired product. Regarding the survey 70(31.8%) of their income under 20,001 –
30,000. Very less than the respondents of their income between 30,001 – 40,000. As per the table of taste, the respondents only 32(14.5%) of respondents are their taste is neutral. The above table shows related to respondents demand their product in the market only 74(33.6%) of respondents are having highly satisfied their demanded product. Rest of the table connect to respondents their desirable product avail in market.
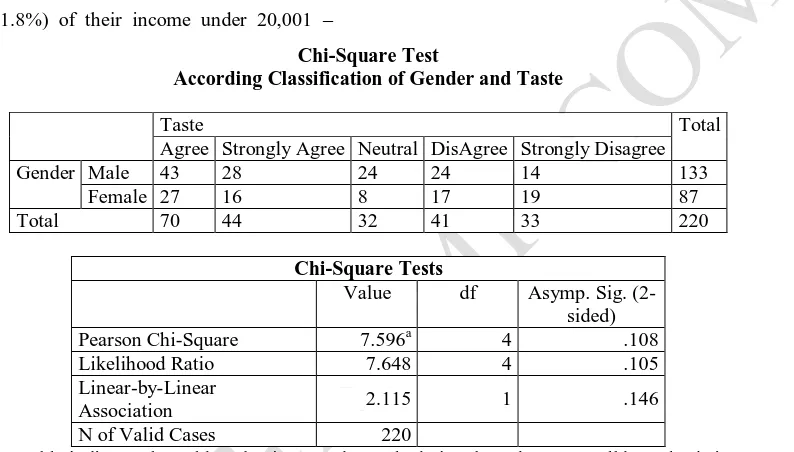
Chi-Square Test
According Classification of Gender and Taste
Taste Total
Agree Strongly Agree Neutral DisAgree Strongly Disagree
Gender Male 43 28 24 24 14 133
Female 27 16 8 17 19 87
Total 70 44 32 41 33 220
Chi-Square Tests
Value df Asymp. Sig. (2-sided)
Pearson Chi-Square 7.596a 4 .108
Likelihood Ratio 7.648 4 .105
Linear-by-Linear
Association 2.115 1 .146
N of Valid Cases 220
The above table indicates that table value is more than calculating the value. So Null hypothesis is accepted, an alternative hypothesis is rejected. There is no relationship between gender and of their age.
Anova
Association between demands versus desirable product
Sum of Squares df Mean Square F Sig.
Between Groups (Combined) 1.976 4 .494 .312 .870
Linear Term Unweighted .925 1 .925 .584 .445
Weighted .463 1 .463 .293 .589
Deviation 1.512 3 .504 .319 .812
Within Groups 340.183 215 1.582
Total 342.159 219
IV. SUGGESTIONSANDCONCLUSION SUGGESTIONS
This research report outlines some measures for raising productivity, efficiency and making FMCG competitive as follows: Level of abatement for soaps and is revised to 45 percent in consideration of various inputs. Excise duty facilities on should be on par with about 50 percent without CEN VAT credit alcohol based toiletries is very high and with non-alcoholic toiletries. Higher and different sales tax rates in different states. VAT applicable for these products should fall within the proposed 4 per a distribution system of its own or rely on product awareness and demand creation try already established popular product lines.
The Companies should introduce product variants that distinctive regional tastes as well as a wide range of package sizes and prices to suit to purchasing preferences of India’s varied consumer segments. The survey confirms that the FMCG sector is poised for further growth because of the merging opportunities and strong fundamentals developing in the economy. This report highlights the need for pro-active government action for helping the industry to achieve lower cost, improved quality and better performance in the competitive environment.
The survey foresees that future growth will come from newer segments such as the youth and through increased rural and small-town penetration. The Internet and e-commerce will change the dynamics of this industry helping companies improve their procurement, distribution and selling efficiencies. This will, in turn, help them reduce prices and still remain profitable.
CONCLUSION
This study has had a quite broad and explorative
propositions and business strategies. It would be interesting to conduct a more detailed study, focusing on one case company. Such a study could include detailed product life cycles and product flow analyses, which could be used to find ways of reducing non-value adding time. An activity-based costing study would illustrate where costs occur and also how much the costs of performing activities is reflected in end customers prices. The development within the IT area has enabled companies to increase their control over product flows and inventories, arguably allowing reductions in safety stocks. Most likely, these developments have had impacts on companies’ cash flows. Such a study would perhaps benefit from having a relationship focus, examining the value of trust, information sharing, and possible occurrences of open book accounting in supply chain relationships.
V. REFERENCE
1) Abernathy, F.H., Dunlop, J.T. and Hammond, J. (2000), “Retailing and supply chains in the information age”, Technology in Society, Vol. 22, pp. 5-31.
2) Andersen, P.H., and Rask, M. (2003), “Supply chain management: new organizational practices for changing procurement realities”, Journal of Purchasing & Supply Management, Vol. 9 No. 2, pp. 83-96.
3) Balakrishan, A. (2004), “Collaboration and coordination in supply chain management and e-commerce”, Production and Operations Management, Vol. 13 No. 1, pp. 1-2.