SIMULATION OF BUS LANES IN MOTORCYCLE-DOMINATED
TRAFFIC FLOW BY USING AGENT-BASED MODEL
Tran Vu Tu1, Vo Trong Bo2
1,2 Faculty of Civil Engineering, Ho Chi Minh City University of Technology and Education, Vietnam
Received 11 January 2017; accepted 31 March 2017
Abstract: In this paper, the authors firstly proposed a model for motorcyclist behavior when travelling in motorcycle – dominated traffic flow. The proposed model is proposed to define the influence space of each motorcyclist as a “cone of vision” with included two inputs, the vision distance (radius) and the viewing angle. The proposed model with significant estimation parameters was then used to simulate traffic scenarios by employing Netlogo. The three scenarios were considered, including ordinary lane with mixed flow, ordinary lane with motorcycle exclusive lane and bus exclusive lane. The paper initial result emphasizes the roles of bus lanes as well as the impacts of motorcycle travel on the performance of bus lanes in motorcycle-dominated urban streets in terms of travel time delay.
Keywords: bus lanes, simulation, motorcycle, exclusive lane, Netlogo.
1 Corresponding author: [email protected]
1. Introduction
The important role of bus lane systems is proved in the formation of a sustainable transport system due to its flexibility, easy navigation and low costs. Improving bus service to attract more bus users switching from private car to bus is an indispensable trend to relieve traffic congestion, traffic accident in developing countries like Vietnam, where the nominated transport mode is motorcycle. Although there have been many studies on bus priority schemes such as with-flow bus lanes, contra-flow bus lanes, bus ways (Tian and Jia, 2016; Wang et al., 2016; Chen et al., 2016; Cesme et al., 2016) as well as its benefits, the application of bus lanes in motorcycle dominated traffic is difficult due to the complexity of motorcycle movement in traffic flow. The benefit of bus lanes was proved early. Indeed, Cox
Fig. 1.
Bus in Motorcycle-Dominated Traffic in Vietnam
It is clear that bus lanes in car-dominated traffic were the popular topic that has been studied. In reality, the operation of bus lanes in motorcycle-dominated traffic in developing countries like Vietnam has suffered negatively the disruption of motorcycle movement. The interference of motorcycles as well as its non-lane travel makes the deployment prospects of bus lanes in Vietnam different from others of developed countries. The majority of motorcycles in traffic flow that is up to 80% menaces to the success of the deployment of bus lanes. The non-lane travel of motorcycles affects significantly the efficiency of bus operation. Therefore it is necessary to have research studied to find ways to improve bus service in such motorcycle dominated traffic situations. In this research, the authors investigate into bus lane operation in motorcycle-dominated traffic flow in terms of travel time as well as other impacts on traffic flow based on simulation models. The scope of this study is related to traffic
flow at mid-block urban roads, the impact of signalized intersections is beyond this paper.
2. Paper Objective
The paper focuses on two main points. The first main point relates to the estimation of a model for motorcyclist behavior in motorcycle-dominated urban streets in Vietnam. The second main point is related to simulation of bus operation under typical scenarios such as ordinary lanes with mix flow, ordinary lane with motorcycle exclusive lane and exclusive bus lane. Based on the simulation result, the paper aims at evaluating the effect of motorcycles on the operation of bus lanes in terms of travel time delay.
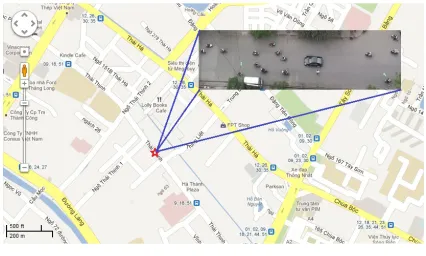
3. Data Collection
motorcycle and car movement. The authors used a camera setting on a high rise building to record the traffic flow. The study site is located in Hanoi downtown, which is a
two-way street with the road width of 11 meters. The videos were recorded in the day time and under normal weather condition. The collected site is shown as in Fig. 2 and Fig. 3.
Fig. 2. Study Site
Fig. 3.
Video Image of the Study Site
Based on the observation of videos, the authors collected necessary information of speed, vehicle types, traffic density as well as the relative distance among vehicles. The collected data is used to
calibrate simulation models as well as validate the simulation results. The traffic composition was classified into 4 groups of Bus, Car, Motorcycle and Cycle as shown in Fig. 4.
3%
73%
Motorcycle Car Bicycle Bus 9%
15%
Fig. 4.
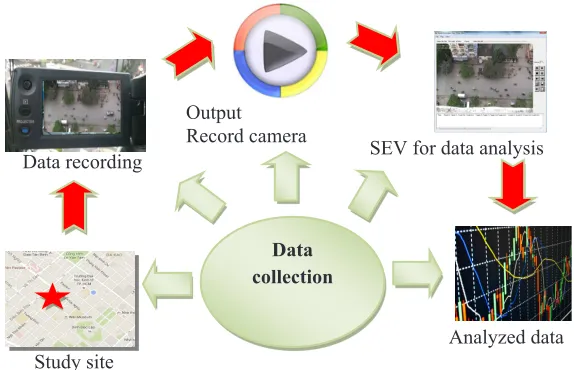
The process of analyzing the collected data is shown as in Fig. 5. After recording the video from the study site, the authors input these video clips into software named SEV (Speed Estimation from Video Data) developed by Minh (2007). This software can measure multi-positions of a vehicle over time interval as low as one thirtieth of a second and can be repeated several times to verify preceding results or recollect missing data as well as to skim unnecessary data.
The ability of measuring the trajectory of several vehicles simultaneously as well as user-friendly operation of the SEV is advantages to be employed to select information from raw data in the videos and to carry out statistical analysis. The output file is an Excel compatible file, which has advantages in analyzing numbered data and operating necessary functions. The data collection and extraction using video recorders, media player, and SEV software can be as illustrated in Fig. 5.
Study site Data recording
Output
Record camera SEV for data analysis
Analyzed data
Data collection
Fig. 5.
Diagram of Data Collection and Extraction Using Video Techniques
4. Model Development
4.1. Proposal Models for Motorcycle
Movement
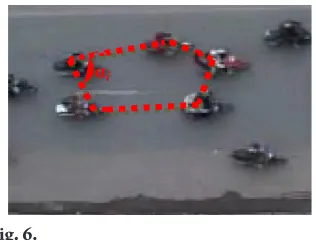
Based on the real data, the authors developed a model for motorcycle and car movements in motorcycle dominated traffic flow based on
so-called “influence spaces”. The influence spaces of car and motorcycle are estimated separately because of its characteristics.
i
Fig. 6.
Influence Spaces Defined for Motorcycles and Cars
By using the real coordinates being integrated into the coordinates in SEV, the authors can measure the positions of any vehicles in the SEV window. These positions are the bases to determine these above influence spaces.
To easily simulate the reaction behavior of vehicles in Netlogo, the authors simply suppose a “cone of vision” in front of each subjected vehicle to define the influence area. The cone is defined by the two inputs, the vision distance (radius) and the viewing
angle (Eq. (1)). The viewing angle (Fig. 7) may range from 0 to 360 and is centered around the subjected vehicles current heading.
π α.
. 360
i i i
S
R = (1)
Where: Ri: The vision distance at time i (m), Si: The area of the influence area at time i (m2), α
i: The viewing angle at time i (degree).
Fig. 7.
Influence Spaces of Cone of Vision for Motorcycles
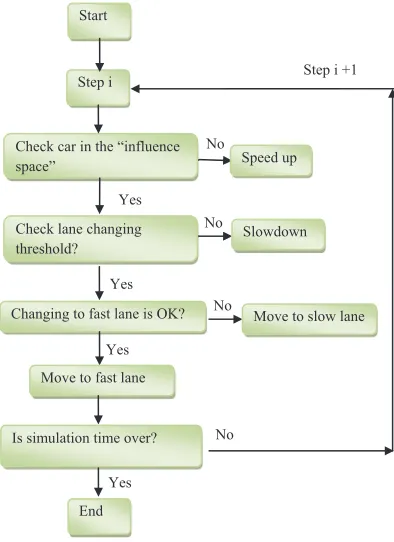
4.2. Algorithm to simulate in Netlogo
NetLogo is a multi-agent programmable modeling environment, using agents in the form of turtles, patches, links and the
No Start
Step i
Is simulation time over?
End Yes
No
Step i +1
No
Speed up
No Slowdown
Move to slow lane Check car in the “influence
space”
Yes Check lane changing threshold?
Yes Changing to fast lane is OK?
Yes Move to fast lane
Fig. 8.
Vehicle-Following and Lane Changing Models
As shown in Fig. 8, once a new step runs, all vehicles check the availability of empty spaces in the influence space. The influence space which was defined above as an area in front of the subjected vehicles is estimated based on the collected data. The vehicles are assumed to be moving following a model tentatively called “cone model”. For the simplicity, the authors consider estimating the parameters of the “cone model” for motorcycles only, the model for four-wheel vehicles is assumed to be simple, in which the “influence space” is supposed to be a rectangle. The width of the rectangle is assumed to be constant and the length edge of the rectangle depends on the availability of front vehicles during simulation steps. Depending on the availability of vehicles
in the inf luence area of any subjected vehicle, the subjected vehicle will react to change lanes to the fast lane or the slow lane or to slow down if the changing lane threshold is satisfied. The lane changing threshold concludes constraints in terms of surrounding space availability and the time period to the nearest previous lane changing.
5. Study Results
5.1 Estimated Models
Table 1
The Correlations Among Parameters
As shown in the estimation result (Table 1), the viewing angle is assumed to be a function of velocity. The positive parameter of velocity indicates the direct proportion between the velocity and the viewing angle. This is reasonable because the higher the velocity is, the larger the viewing angle is due to the safety reason. Similarly, the estimation result of the vision distance gives a reasonable result. The vision distance of vehicles is
diversely proportional to its current velocity. The values of t-test are significant to confirm the validity of the model.
5.2 Simulation Models
(ordinary lane with mixed flow or ordinary lane type 1). The two lanes (lane 1 and lane 2) of each travelling direction play an
equal role to all types of vehicle (bus, car, motorcycle). The snapshot of the simulation can be displayed as follows:
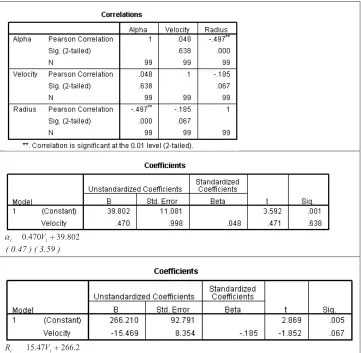
Fig. 9.
Ordinary Lane (Type 1)
As for the second scenario called ordinary lane type 2, in which the fast lane (lane 2) is used for bus and car traveling. Meanwhile, the slow lane (lane 1) is used
only for motorcycle (ordinary lane with motorcycle exclusive lane). The snapshot of the simulation can be displayed as follows:
Fig. 10.
Ordinary Lane (Type 2)
As for the third scenario named exclusive bus lane, in which the fast lane is used for car and motorcycle.
The slow lane is designated for bus only. The snapshot of the simulation can be displayed as follows:
Fig. 11.
Exclusive Bus Lane
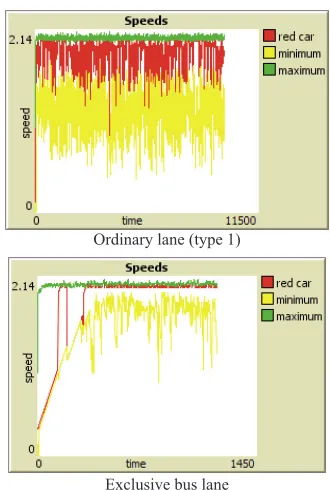
In simulation scenarios, the authors setup studied buses as red cars. The average speed of red cars (buses) is compared with
Traffic flow validation Ordinary lane (type 1)
Ordinary lane (type 2) Exclusive bus lane Observed flow (veh/min)
Simulated flow (veh/min)
Fig. 12.
Simulation Results
As shown in Fig. 12, the simulation model is validated in terms of traffic flow. The simulation flow and validation one distributed along 45 degree line. After validating the model, the authors investigate three scenarios as mentioned above. The simulation result shows that the bus speed in the scenario of exclusive bus lane reaches to the maximum speed of cars. This is reasonable because the lane for bus travelling in this scenario is an exclusive lane designated for bus only. Meanwhile, in the scenario of ordinary lane (type 1), the fluctuation of the bus speed is very huge. This is due to the interference of other cars as well as motorcycle during travelling. The scenario of ordinary lane (type 2) shows the speed of bus remains rather stable. However, the gap between the maximum speed of cars and the average bus speed is bigger than that
in the scenario of exclusive bus lane. It can be conclude that the impact of motorcycle on bus travel is significant. Meanwhile, the effect of cars on bus service performance is more stable, but it makes bus speeds reduce significantly compared with the scenario of exclusive bus lane.
6. Conclusion
concerns the situation that bus, car and motorcycle. The research aims at simulating bus lanes in motorcycle-dominated traffic f low. By developing simulation models in Netlogo, the authors investigate three simulation scenarios, including the scenario of ordinary lane (type 1), the scenario of ordinary lane (type 2) and the scenario of exclusive bus lane. The simulation result shows that, the impact of motorcycle on bus travel is significant. Meanwhile, the effect of cars on bus service performance is more stable, but it makes bus speeds reduce significantly compared with the scenario of exclusive bus lane.There are many shortcomings that should be conducted in further research. The car following models and car lane changing models are very simple, which cannot reflect the real behavior of cars and motorcycles. A better model validated based on the real data should be studied. Moreover, the comparison among scenarios should be conducted not only in terms of bus speed, but other aspects such as travel time, collision, convenience, etc. That should be the objectives of future study.
References
Arasan, V.T.; Vedagiri, P. 2008. Bus priority on roads carrying heterogeneous traffic: a study using computer simulation, European Journal of Transport and Infrastructure Research 8(1): 45-64.
Cesme, B.; Altun, S.; Jia, W.; Eichler, M.; Torruellas, C.; Santhanam, S.; Wang, Z.; Brulle, T. 2016. Application of Bus-Only Lanes in Downtown Washington, DC: Concurrent Versus Contraflow Bus Lanes, Transportation Research Record: Journal of the Transportation Research Board
(2539): 119-129.
Chen, X.; Yu, L.; Jia, X.; Gong, H. 2016. Capacity Modeling for Weaving, Merge, and Diverge Sections with Median Exclusive Bus Lanes on an Urban Expressway,
Transportation Research Record: Journal of the Transportation
Research Board (2553): 99-107.
Cox, A.M. 1975. Reserved bus lanes in Dallas, Texas,
Journal of Transportation engineering 101(4): 691-705. Huanyu, Y.; Gan, A.; Ubaka, A.I.C.P. 2003. A decision model for bus–only and HOV lanes on freeways. In
Proceedings of the 82nd Annual Meeting of the Transportation
Research Board.
Minh, C.C. 2007. Analysis of motorcycle behavior at midblocks and signalized intersections, Doctoral Dissertation, Nagaoka University of Technology, Japan.
Sakamoto, K.; Abhayantha, C.; Kubota, H. 2007. Effectiveness of bus priority lane as countermeasure for congestion, Transportation Research Record: Journal of
the Transportation Research Board (2034): 103-111.
Seo, Y.U.; Park, J.H.; Jang, H.; Lee, Y.I. 2005. A study on setting-up a methodology and criterion of exclusive bus lane in urban area. In Proceedings of the Eastern Asia Society for Transportation Studies 5: 339-351.
Shalaby, A.S. 1999. Simulating performance impacts of bus lanes and supporting measures, Journal of
Transportation Engineering 125(5): 390-397.
Shalaby, A.S.; Soberman, R.M. 1994. Effect of with-flow bus lanes on bus travel times, Transportation research record (1433): 25-30.
Takeshita, H.; Shimizu, K.; Kato, H. 2007. Ex-post evaluation of bus rapid transit system in Nagoya City. In
Proceedings of the 11th World Conference on Transport Research
Tanaboriboon, Y.; Toonim, S. 1983. Impact study of bus lanes in Bangkok, Journal of Transportation Engineering
109(2): 247-256.
Tian, Z.; Jia, L., 2016. A new bus lane on urban expressway with no-bay bus stop, In Compendium of Papers of the 95th Annual Meeting of the Transportation
Research Board.
Wang, J.; Liu, H.; Xie, C. 2016. Transit Network Design with Exclusive Bus Lanes. In Proceedings of the 95nd Annual
Meeting of the Transportation Research Board (No. 16-3513).
Wilensky, U. 1998. NetLogo traffic 2 lanes model. Available from internet: <http://ccl.northwestern.edu>. Zhu, L.; Yu, L.; Zhang, Y.; Chen, X.; Guo, J.; Sun, M., 2010. Simulation approach to the analysis of exclusive bus lane on Western 3rd ring-road expressway in Beijing.
In Proceedings of the Transportation Research Board 89th