BENEFITS OF THE
CLEAN DEVELOPMENT
BENEFITS OF THE CLEAN
DEVELOPMENT MECHANISM
2012
CLEAN DEVELOPMENT MECHANISM
United Nations
United Nations
Framework Convention on Climate Change
Benefits of the Clean Development Mechanism 2012
EXECUTIVE SUMMARY
7
I. INTRODUCTION 10
II. SUSTAINABLE DEVELOPMENT AND CDM PROJECTS
13
2.1. Definition of sustainable development
13
2.2. Assessing sustainable development
13
2.3. Indicators of sustainable development
14
2.3.1 Method and assumptions in assessing sustainable development
16
2.4. How CDM projects contribute to sustainable development
16
2.5. Sustainable development contributions by project type
17
2.6. Sustainable development contributions by host country
18
2.7.
Trends in sustainable development contributions
19
2.8. Comparison of claims in project design documents and survey responses
21
2.9. Other studies on the sustainable development contributions of the CDM
22
2.10. Summary
25
III. TECHNOLOGY TRANSFER VIA CDM PROJECTS
27
3.1. Definition of technology transfer
27
3.2. Technology transfer claims of CDM projects
28
3.3. Technology transfer by project type
28
3.4. Technology transfer by host country
29
3.5. Trend in technology transfer
30
3.6. Comparison of claims in project design documents and survey responses
32
3.7.
Sources of imported technology
33
3.8. Statistical analysis of technology transfer
35
3.9. Other studies on technology transfer and the clean development mechanism
36
3.10. International transfer of wind technology and the CDM
37
3.11. Summary
38
United Nations
Framework Convention on Climate Change
4
Benefits of the Clean Development Mechanism 2012
IV. CDM PROJECT FINANCE AND COSTS
41
4.1. Investment triggered by CDM projects
41
4.1.1. Investment by project type
41
4.1.2 Investment by year
43
4.1.3. Geographic distribution of investment
44
4.2. Comparison of CDM projects with similar projects in Annex I countries
45
4.2.1. Average power generation capacity
45
4.2.2. Average capital intensity
46
4.2.3. Average capital investment
47
4.2.4. Sources of finance by project type
48
4.2.5. Trends in domestic and foreign finance
49
4.2.6. Amount of foreign investment attracted by CDM projects
50
4.2.7. Sources of foreign investment in CDM projects
50
4.3. Mitigation costs of CDM projects
51
4.3.1. Project mitigation costs
51
4.3.2. Viability of CDM projects
52
4.3.3. Interpretation of negative mitigation costs
53
4.3.4. Other studies of the mitigation costs of CDM projects
53
4.4. Revenue from the sale of CERs
54
4.5. Compliance cost savings for Annex I Parties
55
4.5.1. Compliance cost savings due to CER use by installations in the EU ETS
55
4.5.2. Cost savings due to CER use by Japanese firms
57
4.5.3. Compliance cost savings by firms and governments for 2008–2012
57
4.5.4. Summary of compliance cost savings
58
United Nations
Framework Convention on Climate Change
Benefits of the Clean Development Mechanism 2012
V. REGIONAL DISTRIBUTION OF CDM PROJECTS
61
5.1. Current distribution of CDM projects
61
5.2. Drivers of regional distribution
64
5.2.1. National emissions
64
5.2.2. Investment climate
65
5.2.3. National CDM capacity
65
5.3. Summary
66
VI. OPPORTUNITIES FOR IMPROVEMENT
69
VII. REFERENCES 73
VIII. ANNEX A
78
IX. ANNEX B
92
9.1. Methodology and data sources for estimation of total investment in CDM projects
92
9.2. Methodology and data sources for comparison of CDM and Annex I renewable energy projects
92
9.3. Methodology and data sources for calculation of mitigation costs for CDM projects
93
9.4. Methodology to determine the relationship between operating CDM projects in a country and country
characteristics 94
United Nations
Framework Convention on Climate Change
Benefits of the Clean Development Mechanism 2012
EXECUTIVE SUMMARY
The end of the first commitment period of the Kyoto Protocol (2008–2012) marks a turning point in the history of the clean development mechanism (CDM). This junction warrants posing the question: Did the CDM fulfil its initial design objectives and were there any other benefits?
The CDM was designed to meet two objectives, namely to help Annex I Parties to cost-effectively meet part of their emission reduction targets under the Kyoto Protocol and to assist non-Annex I Parties in achieving sustainable development. While CDM projects create certified emission reductions (CERs) that project participants can sell to Annex I Parties to help them meet their Kyoto Protocol targets, they can also provide complementary benefits to non-Annex I Parties such as new investment, the transfer of climate-friendly technologies and
knowledge, the improvement of livelihoods and skills, job creation and increased economic activity.
United Nations Climate Change Secretariat has analysed aspects of CDM project activities and reported on the levels and types of benefits the CDM has provided. Expanding on the study in 2011, this report analyses approximately 4,000 registered CDM projects (excluding programmes of activities) according to four topics: sustainable development, technology transfer, finance and regional distribution.
SUSTAINABLE DEVELOPMENT
Since the registration of the first CDM project in 2004, scholars and policymakers alike have attempted to understand how the CDM contributes to sustainable development. All of the studies rely mainly on
information provided in project design documents and they use different indicators of sustainable development. Various positive impacts with benefits distributed across economic, environmental, and social areas is claimed for all project types. Some studies claim that hydrofluorocarbon (HFC) and nitrous oxide (N2O) projects yield the fewest sustainable development benefits. Other studies suggest a trade-off in favour of producing low-cost emission reductions at the expense of achieving sustainable development.
This study assesses the claims made by project
participants in the project design documents submitted for registration. The relative reliability of these claims, as verified by a follow-up survey, suggests that the CDM is making a contribution to sustainable development in host countries in addition to the mitigation of greenhouse gas (GHG) emissions. Almost all CDM projects claim multiple sustainable development benefits, but the mix of benefits claimed varies considerably by project type.
The most prominent benefit claimed is stimulation of the local economy through employment creation and poverty alleviation, followed by reduction of pollution and promotion of renewable energy and energy access. The mix of benefits claimed has not changed significantly since the first CDM project was registered, except that claims of environmental and noise pollution reduction have become more common.
Under the CDM modalities and procedures, each non-Annex I Party (host country) has the authority to assess whether a CDM project contributes to sustainable development according to national development priorities. A comparison of projects across different countries shows that the host country has an effect on the mix of benefits claimed by a project. However, social benefits tend to be cited (or possibly required of projects) less often than economic and environmental benefits in all countries.
There is room for improvement in both the standards and approaches used for the declaration of sustainable development of CDM projects, as confirmed by many other studies.
TECHNOLOGY TRANSFER
United Nations
Framework Convention on Climate Change
8
Benefits of the Clean Development Mechanism 2012
Executive summary
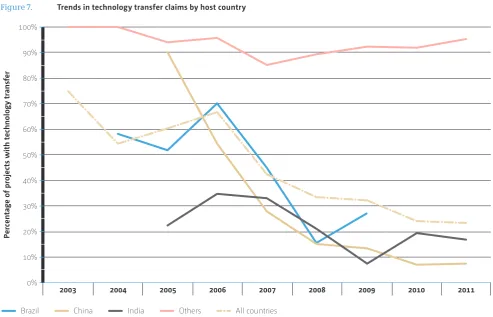
This study, and others, show that the frequency of technology transfer declines over time as local expertise related to the relevant technologies grows. CDM project activities help develop this expertise; the frequency of technology transfer declines as the number of projects of a given type in a host country increases. The frequency of technology transfer via CDM projects has declined over time in China, India and Brazil – the countries that host the largest numbers of projects – but remains high in almost all other host countries.
The frequency of technology transfer differs significantly by project type and by host country. Not surprisingly, the rate of technology transfer is lowest for hydro and cement projects, which use mature technologies already widely available in developing countries. Many countries have requirements related to the technology used by CDM projects, separately or as part of their sustainable development criteria, which explains why the host country has an impact on the frequency of technology transfer.
A comparison of technology transfer in projects across different countries shows that CDM host country characteristics, such as population, GDP per capita, foreign direct investment, renewable share of electricity generation and knowledge stock significantly impact the rate of technology transfer via the CDM. Furthermore, a change to these host country characteristics has an almost immediate effect (after just one to two years) on the rate of technology transfer. Efforts to identify the specific characteristics that influence the rate of technology transfer have made some progress, but further research is needed.
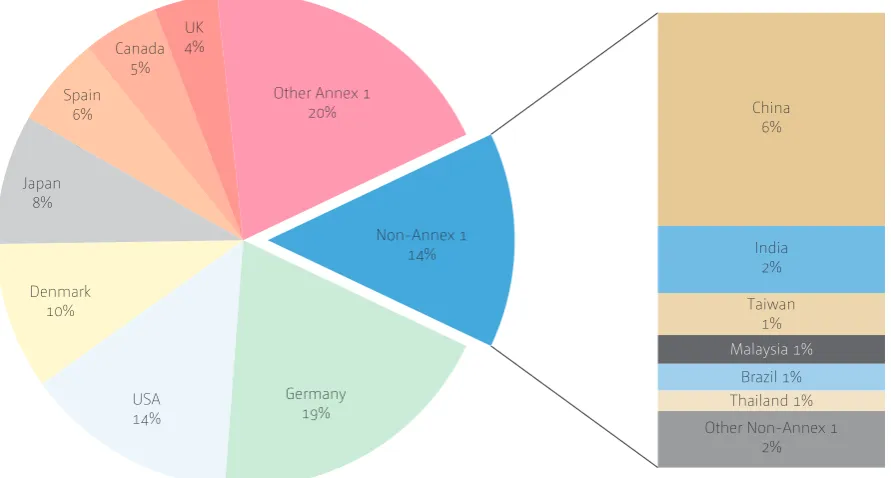
Innovation on climate mitigation technologies occurs primarily in developed countries with the top five technology suppliers for CDM projects being Germany, the USA, Denmark, Japan and China. Within these countries there tend to be many technology suppliers indicating that project developers have a choice among a number of domestic and/or foreign suppliers with no dominant supplier able to restrict the distribution of the technology and/or keep the price high.
FINANCE
The total investment in registered or soon-to-be-registered CDM projects as of June 2012 is estimated at USD 215.4 billion. The investment in projects that are known to be operating is USD 92.2 billion. The annual investment peaked in 2008 at USD 13.9 billion (operating projects) and USD 40.4 billion (all projects), but the large number of projects undergoing validation could lead to a new, much higher, peak in 2012 or thereafter.
The average investment per project is approximately USD 45 million. China and India which make up the bulk of projects in Eastern Asia and Southern Asia respectively account for 65 per cent of the total investment with 45 per cent of the projects. Projects in Eastern Asia have relatively large capital investment due to the capital-intensive nature of the projects undertaken (renewables) and their large average size. In contrast, the capital investment per project of almost every other region is equal to or below the overall average. A comparison of renewable energy CDM projects with similar projects in Annex I countries shows that CDM projects are often much larger and less capital-intensive (lower cost per MWe of capacity) than corresponding projects in Annex I countries.
Approximately 90 per cent of CDM projects and 65 per cent of similar renewable energy projects in Annex I countries are solely domestically financed. However, there is a strong indication that the share of foreign investment is increasing in both CDM and Annex I country projects. The pattern of foreign investment in CDM projects is complex, with funds coming from both developed and developing countries and often from multiple countries for a single project.
United Nations
Framework Convention on Climate Change
Benefits of the Clean Development Mechanism 2012
Executive summary
There is evidence of economies of scale – lower mitigation cost per tonne of CO2 e for larger projects – for some types such as renewable, forestry and transport projects, and diseconomies of scale – higher mitigation cost per tonne of CO2 e for larger projects – for others such as demand-side energy efficiency, supply-demand-side energy efficiency, and methane avoidance project activities.
Over 750 million CERs had been transferred from the CDM registry by the end of 2011. The revenue generated by the sale of these CERs is estimated to be at least USD 9.5 billion and possibly as much as USD 13.5 billion.
Savings for Annex I countries through the use of CERs are estimated to be at least USD 3.6 billion for 2008 to 2012. The CDM is projected to reduce compliance costs for firms in the European Union Emissions Trading System and in Japan by at least USD 2.3 billion for the period 2008 through 2012. The estimate is based on the difference between CER prices and European Union Allowance (EUA) prices. Since CERs also had the effect of lowering the price of EUAs, the estimate understates the savings. The use of CERs by Annex I Party governments to meet their 2008 to 2012 national emission limitation commitments is expected to yield an additional USD 1.3 billion in savings.
Furthermore, other studies suggest that investors focus on projects with low abatement cost so the CDM market is working relatively efficiently. They also suggest, however, that there is still significant untapped potential for CDM projects even in countries with many CDM project activities.
REGIONAL DISTRIBUTION
Although the text of the Kyoto Protocol does not refer to the regional distribution of CDM project activities, it has long been a concern of the Conference of the Parties serving as the meeting of the Parties to the Kyoto Protocol (CMP). The CMP has never defined “equitable regional distribution”, so there is no benchmark against which to compare the evolving distribution of project activities.
As a market mechanism, the distribution of CDM project activities and CERs has generally matched the distribution of mitigation potential across countries as represented by national emissions and economic development. Although the number of host countries continues to grow, many countries with small economies and low GHG emissions have few, if any, CDM projects. These include many countries in Africa and the least developed countries (LDC) group, as well as some in Asia. Various initiatives, both under and outside the Kyoto Protocol, have been implemented with the aim of increasing the number of CDM projects in such countries. It is too early to assess whether they have been successful. Having a strong institutional capacity for the CDM is necessary but not sufficient to attract projects. As many CDM project activities are domestically financed, a lack of access to early stage seed funding for CDM costs and high unit transaction costs are significant barriers in many poorer countries. The lack of underlying project finance prevents CDM projects from moving ahead in under-represented countries.
United Nations
Framework Convention on Climate Change
10
Benefits of the Clean Development Mechanism 2012
I. INTRODUCTION
The end of the first commitment period of the Kyoto Protocol (2008–2012) marks a turning point in the history of the clean development mechanism (CDM). This junction warrants posing the question: Did the CDM fulfil its initial design objectives and were there any other benefits?
The CDM was designed to meet two objectives, to assist Annex I Parties in complying with their emission limitation and reduction commitments and to assist non-Annex I Parties in achieving sustainable development and in contributing to the ultimate objective of the United Nations Convention on Climate Change (i.e. to achieve a stabilization of atmospheric GHG concentrations at a level that will prevent dangerous human induced interference with the climate system). Although CDM projects create certified emission reductions (CERs) that project participants can sell to Annex I Parties to help them meet their Kyoto Protocol targets, they can also provide complementary benefits, such as the transfer of technology, rural energy provision, reduction of pollutants, contributions to livelihood improvement, employment creation and increased economic activity.
In the same vein as the 2011 study (UNFCCC, 2011), this report presents further evidence relating to the benefits and impacts of the CDM in time for the end of the first commitment period of the Kyoto Protocol. Specifically the CDM’s contributions to sustainable development and to technology transfer are examined as well as emerging patterns in CDM capital investment, costs, savings and revenue and the geographic distribution of projects. Throughout this study it is assumed that co-benefits associated with CDM projects are solely due to the influence of the CDM, although there may be benefits which could be derived from other project baseline scenarios.
The evidence comes from six sources of information:
• UNFCCC (CDM) Analytical Database as of June 2012 – a database maintained by the UNFCCC secretariat comprising individual CDM project information for all projects in the CDM pipeline 1 including among other information, project status, project specific data on the expected and issued CERs, the crediting period chosen, and time related data (e.g. project design document submission, registration, monitoring and issuance dates). The database is augmented with data from project design documents (PDDs) gathered in various capture campaigns starting in 2006 (such as technology transfer, sustainable development and financial parameters);
• Responses to an ongoing survey 2 of project participants concerning the sustainable
development and technology transfer impacts of their projects;
• Published research on and analyses of the CDM and its impacts;
• The United Nations Environment Programme (UNEP) Risø Centre CDM pipeline as of June 2012. 3 These data were used to classify projects by their type (wind, hydro, etc.) and subtype (run-of-river, dam, etc.);
• The Institute for Global Environmental Strategies (IGES) CDM Project Database as of May 2012. 4 These data were used to establish the start dates of the CDM projects;
• Bloomberg new energy finance (BNEF) data as of May 2012 – a proprietary database of all major financing events related to specific renewable energy projects worldwide. The data include the asset value (capital investment) and capacity for individual projects by country by year of financial closure, the originating country of the investment, and type of finance (debt/equity).
1 The CDM pipeline is taken to be all projects for which a PDD
containing a description of the proposed CDM project has been completed and made available for public comment.
2 Available at: <https://www.research.net/s/unfccc>.
3 The UNEP Risø Centre CDM Pipeline provides monthly updated data
for most CDM projects. Available at: <http://www.cdmpipeline.org/>.
4 The IGES Market Mechanism Group provides monthly
United Nations
Framework Convention on Climate Change
Benefits of the Clean Development Mechanism 2012
Introduction
This study is structured as follows. Section 2 summarizes the claimed contributions of CDM project activities 5 to sustainable development in their host countries. Section 3
highlights the transfer of technology via CDM projects.
Section 4 provides estimates of finance and costs for various types of projects, and savings and revenue due to the use of CERs 6. Section 5 examines the regional distribution of CDM projects. Finally, Section 6 discusses opportunities for improvement and further work.
5 Unless otherwise stated, for ease of exposition “projects” or “project
activities” should be interpreted to exclude “programmes of activities”.
United Nations
Framework Convention on Climate Change
Benefits of the Clean Development Mechanism 2012
II. SUSTAINABLE
DEVELOPMENT AND
CDM PROJECTS
2.1. DEFINITION OF SUSTAINABLE DEVELOPMENT
The Brundtland Report, Our Common Future, defined sustainable development as “development that meets the needs of the present without compromising the ability of future generations to meet their own needs”. 7 It spawned an extensive body of literature on the concept of sustainable development as well as numerous attempts to measure whether specific actions contribute to sustainable development.
There is still no universally accepted definition of
sustainable development or agreed basis for determining whether a specific action, such as a proposed CDM project, would contribute to sustainable development. However, it is widely agreed and was recently reiterated in the outcome of the Rio+ 20 conference 8 that sustainable development comprises three mutually reinforcing dimensions, namely economic development, social development, and environmental protection. 9
Owing in part to the absence of an accepted international definition of sustainable development, the responsibility for determining whether a CDM project contributes to national sustainable development as defined by the host country currently resides with its designated national authority (DNA). The DNA therefore states in its letter of approval of the CDM project that, in its judgement, the proposed CDM project will contribute to the country’s sustainable development. 10 A Designated Operational Entity (DOE must ensure confirmation by the DNA of the host country that the project activity assists in achieving sustainable development in the host country. 11
2.2. ASSESSING SUSTAINABLE DEVELOPMENT
Assessing the contribution of the CDM in assisting host countries in achieving sustainable development is challenging for the same reason – the lack of an agreed operational definition. Two types of assessment of the contribution of the CDM to sustainable development are possible on a project-by-project basis:
• How a CDM project contributes to sustainable development; and
• How much a CDM project contributes to sustainable development? 12
To determine how a CDM project contributes to sustainable development requires only a list of sustainable development indicators against which a project is assessed to show the nature of its contribution. 13How much a CDM project contributes to sustainable development in addition to the mitigation of greenhouse gas (GHG) emissions requires a list of indicators, a quantitative or qualitative measure for each indicator that can be used to score the project, and weights that allow the scores for the different indicators to be aggregated into an overall measure of the extent of the contribution to sustainable development.Only two studies – by Sutter and Parreño (2007) and Alexeew et al. (2010) – attempt such an assessment. They are summarized in Section 2.10 below.
2
7 World Commission on Environment and Development, 1987, p. 8.
8 2012A/CONF.216/L.1, United Nations, Rio de Janeiro, Brazil 20-22 June.
9 Adams, 2006; Olsen, 2007; and Alexeew, et al., 2010.
10 TERI, 2012, section 2.3, discusses the criteria used by DNAs to assess
the contribution of CDM projects to sustainable development. Olsen and Fenhann, 2008, table 1, p. 2821, summarizes the approaches used by seven countries. Sterk et al., 2009, summarizes the sustainable development requirements of 15 DNAs using the Gold Standard as a basis.
11 Decision 3/CMP.6, paragraph 40.
12 Olsen and Fenhann, 2008, p. 2820.
United Nations
Framework Convention on Climate Change
14
Benefits of the Clean Development Mechanism 2012
Sustainable development and CDM projects
2.3. INDICATORS OF SUSTAINABLE DEVELOPMENT
A list of sustainable development indicators is
a requirement for both types of assessment. As yet there is no agreed list of indicators suitable for CDM projects. In this study a set of 10 indicators was derived from the statements made in the PDDs for registered CDM
projects. 14 These indicators, presented in Table 1, cover the economic, environmental and social development dimensions of sustainable development. They encompass most of the criteria used by other studies. 15 The descriptions attempt to clearly distinguish the differences so that claimed benefits can be assessed consistently.
14 The UNFCCC 2011 study made use of 15 indicators. In this study the
same indicators were merged or disaggregated into more discrete and appropriate indicators.
15 Input from Luz Fernandez; Charlotte Unger; Alexeew, et al., 2010;
United Nations
Framework Convention on Climate Change
Benefits of the Clean Development Mechanism 2012
Sustainable development and CDM projects
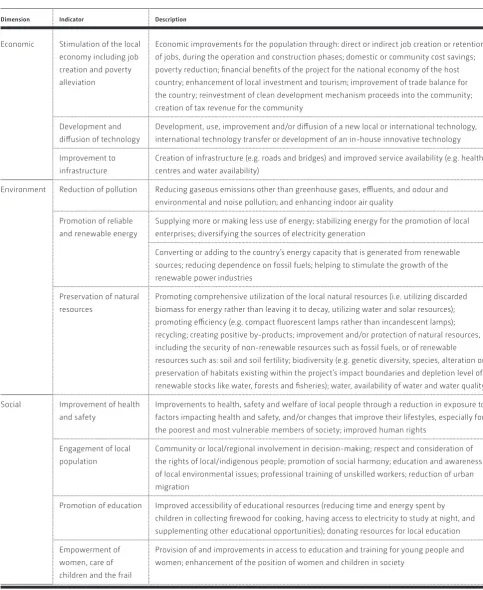
Table 1. Sustainable development dimensions and indicators for clean development mechanism projects
Dimension Indicator Description
Economic Stimulation of the local
economy including job creation and poverty alleviation
Economic improvements for the population through: direct or indirect job creation or retention of jobs, during the operation and construction phases; domestic or community cost savings; poverty reduction; financial benefits of the project for the national economy of the host country; enhancement of local investment and tourism; improvement of trade balance for the country; reinvestment of clean development mechanism proceeds into the community; creation of tax revenue for the community
Development and diffusion of technology
Development, use, improvement and/or diffusion of a new local or international technology, international technology transfer or development of an in-house innovative technology Improvement to
infrastructure
Creation of infrastructure (e.g. roads and bridges) and improved service availability (e.g. health centres and water availability)
Environment Reduction of pollution Reducing gaseous emissions other than greenhouse gases, effluents, and odour and
environmental and noise pollution; and enhancing indoor air quality Promotion of reliable
and renewable energy
Supplying more or making less use of energy; stabilizing energy for the promotion of local enterprises; diversifying the sources of electricity generation
Converting or adding to the country’s energy capacity that is generated from renewable sources; reducing dependence on fossil fuels; helping to stimulate the growth of the renewable power industries
Preservation of natural resources
Promoting comprehensive utilization of the local natural resources (i.e. utilizing discarded biomass for energy rather than leaving it to decay, utilizing water and solar resources); promoting efficiency (e.g. compact fluorescent lamps rather than incandescent lamps); recycling; creating positive by-products; improvement and/or protection of natural resources, including the security of non-renewable resources such as fossil fuels, or of renewable resources such as: soil and soil fertility; biodiversity (e.g. genetic diversity, species, alteration or preservation of habitats existing within the project’s impact boundaries and depletion level of renewable stocks like water, forests and fisheries); water, availability of water and water quality
Social Improvement of health
and safety
Improvements to health, safety and welfare of local people through a reduction in exposure to factors impacting health and safety, and/or changes that improve their lifestyles, especially for the poorest and most vulnerable members of society; improved human rights
Engagement of local population
Community or local/regional involvement in decision-making; respect and consideration of the rights of local/indigenous people; promotion of social harmony; education and awareness of local environmental issues; professional training of unskilled workers; reduction of urban migration
Promotion of education Improved accessibility of educational resources (reducing time and energy spent by children in collecting firewood for cooking, having access to electricity to study at night, and supplementing other educational opportunities); donating resources for local education Empowerment of
women, care of children and the frail
United Nations
Framework Convention on Climate Change
16
Benefits of the Clean Development Mechanism 2012
Sustainable development and CDM projects
The sustainable development claims in the PDDs of 3,864 projects registered and undergoing registration as at June 2012 were tabulated using the indicators in Table 1. Up to six indicators were assigned to each project, which was sufficient to cover all of the sustainable development claims. Project participants sometimes make more than six statements in the PDDs but one indicator is often sufficient to cover several statements made. For instance, the indicator “Stimulation of the local economy including job creation and poverty alleviation” can cover three or more statements made in a PDD 16.
A few (32) PDDs make no statement as to the project’s contribution to sustainable development, while an even smaller number (8) make no specific sustainable development statements, but do, however, state that the project adheres to the host country’s sustainable development criteria. As these projects had no specific statement which could attribute the project action to any of the indicators listed in Table 1, they were not included in the analysis of sustainable development.
2.3.1 Method and assumptions in assessing
sustainable development
Assessing the statements from various sections of the PDDs 17 involves some subjectivity. To control this source of variance, the manner in which the data were collected used the following method and assumptions:
1. Different analysts using different assessment methods could place different emphasis on or assign different indicators to any given project. 18 To be as consistent as possible, all projects were assessed and assigned indicators by a single analyst.
2. The source of the data is the PDD; therefore only positive contributions to sustainable development were assessed since project developers never state anything negative about their projects.
3. No attempt was made to independently verify the sustainable development claims so statements made may not reflect the actual delivery of the claimed sustainable development benefit. 4. Claims of reduction in GHG emissions were not
treated as sustainable development claims and were not part of the sustainable development indicators since this is a prerequisite for a CDM project.
5. “Non-negative” sustainable development claims such as “the project will not lead to environmental degradation” were not treated as sustainable development claims due to their imprecision. 6. General statements relating to the promotion of
sustainable development in the host country, but not directly related to the project, were not treated as sustainable development claims due to a lack of specific attribution of the project action to any of the indicators listed in Table 1.
2.4. HOW CDM PROJECTS CONTRIBUTE TO
SUSTAINABLE DEVELOPMENT
The indicators for 3,864 projects were used to describe how CDM projects claim to contribute to sustainable development (comprising an additional 1,614 projects to those in UNFCCC 2011 19). 20 The indicators are based on information in the PDDs, which reflects the expected contributions at the time the project is being validated. The actual contributions may differ – an issue that is explored in Section 2.9 below.
Figure 1 shows the number of projects that mentioned
each of the 10 indicators. The sustainable development contributions claimed most frequently are stimulation to the local economy including job creation and poverty alleviation (29 per cent of the projects), reduction of pollution (22 per cent of projects), and promotion of reliable and renewable energy (19 per cent of the projects). Although the percentages are very different, Olsen and Fenhann found a similar pattern: employment generation was the most likely impact, followed by contribution to economic growth and improved air quality. 21
16 PPD´s were found to make a maximum of six statements, which could
be related to the indicators in Table 1. 92 per cent of PDDs stated four or
less indicators.
17 Most information on sustainable development contributions is found
in section A.2 of the PDD. “Description of the project activity”, where the view of the project participants on the contribution of the project activity to sustainable development is requested (maximum one page).
18 Olsen and Fenhann, 2008, p. 2823.
19 UNFCCC, 2011, p. 22. Several PDD’s assessed in 2011 were revisited in
2012.
20 So that the contribution of each project has the same weight, the
indicators for each project have a total weight of 1 – if there is a single indicator, it is given a weight of 1, if there are two indicators each has a weight of 0.5, if there are three indicators they each have a weight of 0.333, and so on.
21 Olsen and Fenhann, 2008, p. 2825, based on analysis of 296 projects in
United Nations
Framework Convention on Climate Change
Benefits of the Clean Development Mechanism 2012
Sustainable development and CDM projects
Figure 1. Number of sustainable development claims by indicator
Source: Based on statements in the PDDs for 3,864 projects registered and undergoing registration as of June 2012.
As shown in Figure 1, claims of environmental benefits (49 per cent of projects) and economic benefits (45 per cent of projects) far exceed those of social benefits (6 per cent of projects). In contrast, Olsen and Fenhann found the distribution of claimed benefits among the three dimensions to be fairly even, with the most benefits claimed in the social dimension, followed by the economic and environmental dimensions. 22
2.5. SUSTAINABLE DEVELOPMENT CONTRIBUTIONS
BY PROJECT TYPE
The sustainable development claims by project type are shown in Figure 2. The project type definitions are presented in Table A-1. Indicators in the economic dimension are shown in shades of blue on the left of the graph, environmental indicators in shades of red in the middle, and social indicators in green on the right. It is clear that the economic and environmental dimensions are dominant for most project types. The social dimension is most prominent for PFC and SF6 23, N
2O, energy efficiency service, and landfill gas project mostly due to statements about how the project improves health and safety and, for N2O projects, engagement of the local population.
0 200 400 600 800 1000 1200
Improvement of health and safety Economic
Environment
Social
Stimulation of the local economy including
job creation and poverty alleviation 1112
Development and diffusion of technology 446
Improvement to infrastructure 147
Preservation of natural resources 311
Reduction of pollution 837
Promotion of reliable and
renewable energy 738
120
Promotion of education 10
Empowerment of women,
care of children and the frail 5 Engagement of local population 96
22 Olsen and Fenhann, 2008, p. 2825. In some cases the distribution
of claimed benefits among the three dimensions is not directly comparable. For instance, Olsen and Fenhann categorized employment as a social benefit, whereas it is categorized as an economic benefit here.
23 For PFC and SF
6 projects,there are only 10 projects that make a
United Nations
Framework Convention on Climate Change
18
Benefits of the Clean Development Mechanism 2012
Sustainable development and CDM projects
Figure 2. Sustainable development claims by project type as a percentage of the total claims
Source: Based on statements in the PDDs for 3,864 projects registered and undergoing registration as of June 2012.
Although almost all sustainable development indicators are claimed by most project types, similar projects tend to claim similar sustainable development contributions. HFC projects report the most economic sustainable development contributions and the highest levels of stimulation to the local economy including job creation and poverty alleviation. This indicator is claimed more often than any other indicator for all project types except energy efficiency industry, fossil fuel switch, methane avoidance, and N2O. Preservation of natural resources is claimed more often for afforestation/reforestation, energy efficiency industry and fugitive projects. 24 In the social dimension, Improvement of health and safety seems to be reported more often for coal bed/mine methane, energy efficiency own generation and landfill gas projects, owing in part to safer working conditions due to lower risk of explosions from methane leakage. The PFCs and SF6 project type claim improvement of health and safety more often, but there are only a few projects of this type.
2.6. SUSTAINABLE DEVELOPMENT CONTRIBUTIONS
BY HOST COUNTRY
The distribution of sustainable development claims by host country is shown in Figure 3 for the 10 countries with the most registered projects and for all other host countries combined. As per the chart above, the economic indicators are shown in shades of blue on the left, the environmental indicators in shades of red in the middle, and the social indicators in green on the right. Since the 10 are countries with a relatively large number of projects and also of a mix of project types, it is to be expected that the projects they host claim almost all sustainable development contributions. Projects in each of the host countries cite at least eight of the 10 sustainable development indicators. No single indicator is prominent in the 10 largest CDM project host countries.
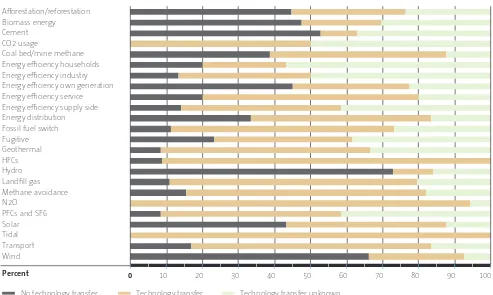
0 10 20 30 40 50 60 70 80 90 100 Afforestation/reforestation
Biomass energy Cement CO2 usage
Coal bed/mine methane Energy efficiency households Energy efficiency industry Energy efficiency own generation Energy efficiency service Energy efficiency supply side Energy distribution Fossil fuel switch Fugitive Geothermal HFCs Hydro Landfill gas Methane avoidance N2O
PFCs and SF6 Solar Tidal Transport Wind
Stimulation of the local economy including job creation and poverty alleviation Improvement to infrastructure
Reduction of pollution
Improvement of health and safety
Empowerment of women, care of children and the frail
Development and diffusion of technology Preservation of natural resources
Promotion of reliable and renewable energy Promotion of education
Engagement of local population
Percent
24 Many project participants refer to the preservation of fossil fuels when
United Nations
Framework Convention on Climate Change
Benefits of the Clean Development Mechanism 2012
Sustainable development and CDM projects
It is noteworthy that although the sustainable development indicators differ between countries, the overall proportions of the dimensions between countries are the same. In other words economic contributions are claimed more often than the others even though Malaysia, the Philippines and Thailand make no claims
of improvement to infrastructure. The social contributions are consistently cited less often than the economic and environmental indicators in all countries. This also indicates the relative emphasis various countries place on different aspects of sustainable development, which tend to be predominantly economic in nature.
Figure 3. Sustainable development claims as a percentage of the total claims by host country
Source: Based on statements in the PDDs for 3,864 projects registered and undergoing registration as of June 2012.
2.7. TRENDS IN SUSTAINABLE DEVELOPMENT
CONTRIBUTIONS
The distribution of sustainable development claims for projects by the year the CDM Executive Board registered the project is shown in Figure 4. The year 2004 is
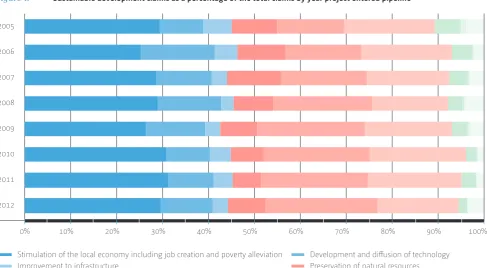
excluded as there were only four projects with data. The economic indicators have remained relatively constant over time but stimulation of the local economy including
job creation and poverty alleviation has fluctuated slightly dropping as low as 26 per cent of all claims in 2006 and climbing as high as 31 per cent in 2011. Reduction of pollution claims have increased from 15 per cent of all claims in 2005 to 24 per cent in 2012, and social claims have fallen from 11 per cent to 6 per cent over the same time span.
0 10 20 30 40 50 60 70 80 90 100 Brazil
China
India
Indonesia
Republic of Korea
Malaysia
Mexico
Philippines
Thailand
Vietnam
Other countries
Development and diffusion of technology Preservation of natural resources
Promotion of reliable and renewable energy Promotion of education
Stimulation of the local economy including job creation and poverty alleviation Improvement to infrastructure
Reduction of pollution
Improvement of health and safety
Empowerment of women, care of children and the frail Engagement of local population
United Nations
Framework Convention on Climate Change
20
Benefits of the Clean Development Mechanism 2012
Sustainable development and CDM projects
Figure 4. Sustainable development claims as a percentage of the total claims by year project entered pipeline
Source: Based on statements in the PDDs for 3,864 projects registered and undergoing registration as of April 2012.
These trends may be due to shifting patterns of sustainable development claims over time or changes in the project mix each year. As can be seen in Figure 5,
biomass projects were prominent in 2005 but have declined since 2007. Wind and hydro projects, on the other hand, have increased exponentially since 2011.
0% 10% 20% 30% 40% 50% 60% 70% 80% 90% 100%
2005
2006
2007
2008
2009
2010
2011
2012
Stimulation of the local economy including job creation and poverty alleviation Improvement to infrastructure
Reduction of pollution
Improvement of health and safety
Empowerment of women, care of children and the frail
Development and diffusion of technology Preservation of natural resources
Promotion of reliable and renewable energy Promotion of education
United Nations
Framework Convention on Climate Change
Benefits of the Clean Development Mechanism 2012
Sustainable development and CDM projects
Figure 5. Trend in the type of project registered and undergoing registration
2.8. COMPARISON OF CLAIMS IN PROJECT DESIGN
DOCUMENTS AND SURVEY RESPONSES
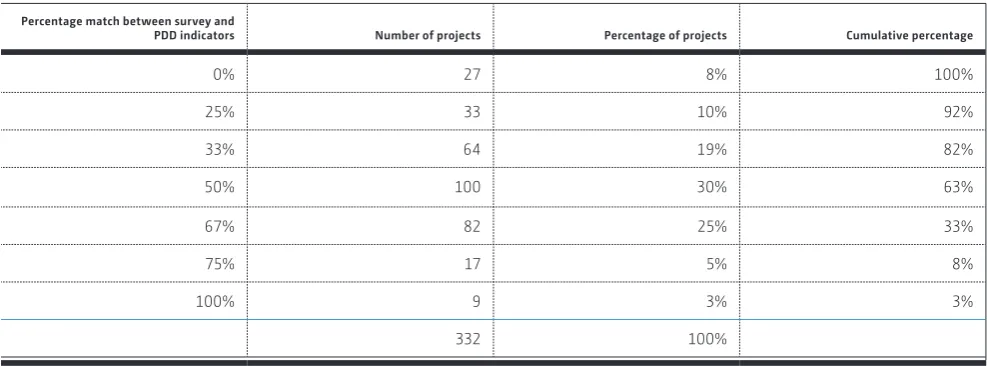
PDD statements about contributions to sustainable development are expectations at the time the project is being validated. The actual sustainable development contributions therefore may be different. The United Nations Climate Change secretariat conducted a survey of project participants after projects had been registered in 2011 to assess each project’s contribution to sustainable development. The survey attracted responses from 392 projects of which 332 25 overlapped with the projects for which data were recorded from PDDs. 26 The survey responses were compared with the indicators compiled from the PDDs.
Table 2 shows the percentage of the survey response
indicators that match the indicators obtained from the PDD for the same projects. 27 For 8 per cent of the projects, none of the indicators from the PDD and the survey responses match. For 30 per cent of the projects, half the indicators from the two sources match. For 63 per cent of the projects at least half of the indicators matched. The survey responses and the indicators from the PDD´s are identical (100 per cent match) for nine of the 332 projects.
0
50 100 150 200
2004m 7
2005m 1
2005m 7
2006m 1
2006m 7
2007m 1
2007m 7
2008m 1
2008m 7
2009m 1
2009m 7
2010m 1
2010m 7
2011m 1
2011m 7
2012m 1
Hydro Solar Methane
Number of projects Wind Biomass energy Others
25 Due to different indicators used in this study, the total number of
matches is slightly (4) lower than in UNFCCC 2011.
26 Approximately 7 per cent of the projects (29) were assessed by
up to four different respondents, who provided slightly different assessments of the contribution of the same project to sustainable development.
27 For the 29 projects with multiple survey responses, an average
United Nations
Framework Convention on Climate Change
22
Benefits of the Clean Development Mechanism 2012
Sustainable development and CDM projects
Table 2. Comparison of sustainable development indicators from project design documents and survey responses
Percentage match between survey and
PDD indicators Number of projects Percentage of projects Cumulative percentage
0% 27 8% 100%
25% 33 10% 92%
33% 64 19% 82%
50% 100 30% 63%
67% 82 25% 33%
75% 17 5% 8%
100% 9 3% 3%
332 100%
Considering that both the survey and the PDDs have up to 10 indicators, the choice of which could vary from the time the PDD was drafted and the project implemented, that upwards of two-thirds of projects have similar sustainable development claims indicates that some claims made in the PDDs are reasonable representations of the sustainable development contributions expected by project participants. The lack of perfect agreement may be due to differences in judgment or interpretation concerning the applicable indicator or changes to the project’s stated sustainable development contributions.
The developer of a Gold Standard 28 project is required to submit a sustainability monitoring plan in addition to the sustainable development assessment in the PDD. The monitoring plan is used to verify whether the CDM project has indeed contributed to sustainable development as anticipated in the PDD. This may cause the project developer to consider the impacts of the project carefully. 29 It may also create an incentive to keep the PDD analysis brief to minimize the monitoring requirements. The survey responses in Table 2 include responses in relation to 19 Gold Standard projects. The Gold Standard projects have approximately the same number of sustainable development indicators as non-certified CDM projects and the match between the survey and PDD indicators is the same as for non-certified CDM projects. 30
2.9. OTHER STUDIES ON THE SUSTAINABLE
DEVELOPMENT CONTRIBUTIONS OF THE CDM
Since the Kyoto Protocol entered into force in early 2005, the sustainable development contributions of the CDM have been the subject of extensive commentary and research in the academic literature.
Olsen (2007) reviewed 19 studies that focused on
sustainable development aspects of the CDM available as at June 2005. None of the studies assessed registered CDM projects, although some analysed projects similar to CDM projects. Olsen concluded that, at the time, a consensus was emerging that the CDM produces low-cost emission reductions at the expense of achieving sustainable development benefits.
28 See <http://www.cdmgoldstandard.org/>
29 Sterk et al., 2009, p. 16.
United Nations
Framework Convention on Climate Change
Benefits of the Clean Development Mechanism 2012
Sustainable development and CDM projects
Sutter and Parreño (2007) applied multi-attribute utility theory 31 to assess the sustainable development contribution of the first 16 registered CDM projects. 32 Each project was scored on three equally weighted criteria – employment generation, distribution of returns from the sale of CERs, and improved local air quality – to get an overall score for its contribution to sustainable development. Also the additionality of each project was measured by the effect of the revenue from the sale of CERs on the project’s profitability; the larger the increase, the greater the additionality of the project. Projects were then categorized as making a large or small contribution to sustainable development and having low or high additionality. Sutter and Parreño found no projects that made a large contribution to sustainable development and were highly additional. 33 Most of the emission reductions (over 95 per cent) came from HFC and landfill gas projects that were highly additional but made a small contribution to sustainable development. They concluded that the first 16 registered CDM projects may have been far from delivering their claims to promote sustainable development although this conclusion could have changed with different indicators and weights. 34
In response to concerns about the sustainable development contribution of CDM projects, several initiatives, including the Gold Standard and the Community Development Carbon Fund (CDCF) 35 were launched to support projects that meet specific sustainable development criteria. The Gold Standard label rewards best-practice CDM projects while the CDCF focuses on promoting CDM activities in underprivileged communities. Nussbaumer (2009) used multi-criteria analysis to compare the sustainable development contributions of Gold Standard, CDCF and regular CDM projects. He applied 12 sustainable development criteria to 39 projects in 10 categories located in 12 countries. 36
Nussbaumer found that the sustainable development profiles of Gold Standard and CDCF projects tend to be comparable with or slightly more ample than similar regular projects. 37 The Gold Standard and CDCF projects performed better with respect to social criteria while regular CDM projects perform better on economic criteria. Overall, Nussbaumer concluded that “labeled projects do not drastically outperform non-labeled ones”, however the differences in the sustainable development performance of comparable categories of projects might be within the range of uncertainty intrinsic to such assessments.
The sustainable development claims of a random sample of 409 projects in the pipeline as of October 2008 were analysed by Watson and Fankhauser (2009). Benefits expected to occur in all projects, such as GHG reductions, and negative impacts were not counted. The frequency of the claims for the eight indicators analysed was employment (82%), training (67%), technology transfer (33%), livelihood benefits (23%), pollution reduction (21%), infrastructure building (21%), education (5%) and environmental benefits (4%). HFC, PFC, and N2O reduction projects were found to have less sustainable development benefits than renewable energy or forestry projects.
Alexeew et al. (2010) applied a methodology similar to that used by Sutter and Parreño (2007) to assess the contribution to sustainable development and the additionality of 40 registered projects in India. 38 Contribution to sustainable development was assessed using 11 criteria – four social, four economic and three environmental. A project was given a score of between –1 and +1 for each criterion. The scores were summed – the criteria were weighted equally – to get an overall score for each project. Additionality was measured by the impact of the revenue from the sale of CERs on the project’s profitability.
31 CDM projects were assessed with respect to multiple attributes
(indicators), and the scores for the different attributes were weighted and aggregated to arrive at an overall assessment.
32 The 16 projects cover seven project types – six hydro projects, three
landfill gas projects, two biomass projects, two HFC-23 destruction projects and one project each for residential energy efficiency, fossil fuel switch and wind – in nine host countries.
33 The paper includes conflicting information on this conclusion.
Figure 3 and the text (p. 87) indicate that there are no projects with a high rating for both additionality and sustainable development. But Table 17 reports that two projects accounting for 0.1 per cent of the projected emission reductions for the 16 projects have both high additionality and a high contribution to sustainable development.
34 Sutter and Parreño, 2007, p. 89.
35 See < http://wbcarbonfinance.org/>
36 The 12 sustainable development criteria consist of four each for the
social, economic and environmental dimensions. The criteria are not aggregated or weighted. The project categories are: biogas (thermal): (four projects); industrial energy efficiency: (six); landfill gas: (three); biomass: (three); biogas (electricity generation): (three); building energy efficiency: (three); hydro (run of river): (six); hydro (new dam): (three); wind: (six) and solar cooking: (two). Ten of the projects are CDCF, six are Gold Standard and 23 are regular CDM projects. Seventeen projects are located in India, eight in China, two each in Argentina, Honduras, Republic of Moldova and Nepal, and one each in Chile, Indonesia, Mexico, Panama, Peru and South Africa.
37 Nussbaumer, 2009, p. 99. A project’s profile is its scores for the 12
sustainable development indicators.
38 The 40 projects are a sample of the 379 that had been registered by
United Nations
Framework Convention on Climate Change
24
Benefits of the Clean Development Mechanism 2012
Sustainable development and CDM projects
The sustainable development scores for individual projects range between 2 and 5.6 out of a possible range of –11 to +11. The values for each dimension of sustainability differ significantly across project types. Wind, hydro and biomass projects provide a relatively high number of sustainable development benefits. Energy efficiency and particularly HFC-23 projects did not contribute to sustainable development as the other kinds of projects. 39 Projects are categorized as making a large or small contribution to sustainable development and having low or high additionality. None of the projects both make a large contribution to sustainable development and have high additionality. 40
In a detailed study of 10 CDM projects Boyd, et. al. (2009) found that it can be misleading to assess a project´s sustainable development outcomes only through the project documentation as local conditions change or are not declared due to either a lack of understanding of possible contributions or by intentional omission of critical views and opinions. 41
The sustainable development claims of 122 projects in China, India, Brazil, Peru, Malaysia and South Africa were assessed using 15 criteria by Disch (2010). These countries face different challenges, have different priorities and are at different stages of development, and thus use different approaches to assessing the sustainable development contributions of proposed CDM projects. Disch concluded that the host countries’ frameworks for CDM project approval, except in the case of Peru, fall short of ensuring a sustainable development benefit. Peru takes a distinct approach including stakeholder involvement and on-site visits, to confirm a projects’ contribution to sustainable development.
Lee and Lazarus (2011) evaluated the potential for
sustainable development benefits for 77 projects covering 12 bioenergy project types. Projects were evaluated against 15 sustainable development criteria using text analysis software reviews of their PDDs. 42 The most common benefits claimed were renewable energy production (100%), stakeholder consultation (99%), waste reduction (82%), employment generation (60%), and indirect income generation through local sourcing of feedstock (57%). The sustainable development benefits claimed differ as widely among bioenergy project types as among all other CDM project types. Bioenergy projects that rely on on-farm residues claim to offer the greatest number of benefits while those that rely on industrial forestry residues claim the fewest.
Subbarao and Lloyd (2011) analysed the sustainable development claims in the PDDs of 500 registered small-scale projects. The projects were mainly (nearly 90%) renewable and energy efficiency, such as biomass energy, methane recovery, micro/small hydro and solar cookers. Projects were scored on 10 criteria with values from -1 to +2. The average score for all of the criteria, except impacts on local resources, was close to zero. Thus the authors concluded that local communities have not benefited significantly from the small-scale CDM projects.
Using the Human Development Index (HDI) as a measure of sustainable development, Huang et al. (2012a) analysed CDM activity and HDI values for 58 host countries for the period 2005 through 2010. 43 They found that a higher host country HDI is associated with more CERs per capita, a higher ratio of CERs per dollar of GDP, a larger share of CERs relative to total emissions, and a higher ratio of CDM investment per dollar of GDP. The causality is not clear; CDM projects may contribute to the host country’s sustainable development or countries with better economic and social development may attract more CDM projects.
39 Alexeew et al., 2010, p. 12.
40 Alexeew et al., 2010, figure 4, p. 11. This is consistent with Sutter and
Parreño (2007). Unlike Sutter and Parreño, Alexeew et al. found that most projects make a large sustainable development contribution. That may be due to the project mix. Alexeew et al. (2010) assessed 15 biomass and seven hydro projects (out of 40) – project types that Sutter and Parreño also found to make a large contribution to sustainable development.
41 This is consistent with the comparison of sustainable development
indicators compiled from PDDs and those from survey responses for
the same project discussed in Section 2.9 above.
42 The 15 criteria are the same as those used by Disch (2010).
43 The HDI is an index of life expectancy, literacy, education and
United Nations
Framework Convention on Climate Change
Benefits of the Clean Development Mechanism 2012
Sustainable development and CDM projects
2.10. SUMMARY
Since the registration of the first CDM project in 2004, scholars and policymakers alike have attempted to understand how the CDM contributes to sustainable development. All of the studies rely mainly on information provided in project design documents and they use different indicators of sustainable
development. A positive impact with benefits distributed across economic, environmental, and social areas is claimed for all project types. Some studies claim that hydrofluorocarbon (HFC) and nitrous oxide (N2O) projects yield the fewest sustainable development benefits. Other studies suggest a trade-off in favour of producing low-cost emission reductions at the expense of achieving sustainable development.
This study assesses the claims made by project
participants in the project design documents submitted for registration. The relative reliability of these claims, as verified by a follow-up survey, suggests that the CDM is making a contribution to sustainable development in host countries in addition to the mitigation of greenhouse gas (GHG) emissions. Almost all CDM projects claim multiple sustainable development benefits, but the mix of benefits claimed varies considerably by project type.
The most prominent benefit claimed is stimulation of the local economy through employment creation and poverty alleviation, followed by reduction of pollution and promotion of renewable energy and energy access. The mix of benefits claimed has not changed significantly since the first CDM project was registered, except that claims of environmental and noise pollution reduction have become more common.
Under the CDM modalities and procedures, each non-Annex I Party (host country) has the authority to assess whether a CDM project contributes to sustainable development according to national development priorities. A comparison of projects across different countries shows that the host country has an effect on the mix of benefits claimed by a project. However, social benefits tend to be cited (or possibly required of projects) less often than economic and environmental benefits in all countries.
There is room for improvement in both the standards and approaches used for the declaration of sustainable development of CDM projects, as confirmed by many other studies. It should be noted that some of the conclusions from these other studies are based on
United Nations
Framework Convention on Climate Change
Benefits of the Clean Development Mechanism 2012
III. TECHNOLOGY
TRANSFER VIA
CDM PROJECTS
Transfer of technology is an important benefit of the CDM, assisting developing countries in reducing GHG emissions and achieving sustainable development. Some host countries explicitly specify technology requirements, including technology transfer, as a requirement for approval of a project. 44 Most GHG mitigation technologies originate in developed countries. 45 To reduce emissions in developing countries the appropriate technologies need to be transferred to those countries. 46 The CDM is one means by which mitigation technologies can be transferred; others include licensing, foreign direct investment, trade and, more recently, establishment of global research and development networks, acquisition of firms in developed countries, and recruitment by firms in developing countries of experts from developed countries.
3.1. DEFINITION OF TECHNOLOGY TRANSFER
There is no universally accepted definition of technology transfer. 47 The Intergovernmental Panel on Climate Change (IPCC) defines technology transfer as “a broad set of processes covering the flows of know-how, experience and equipment for mitigating and adapting to climate change amongst different stakeholders such as governments, private-sector entities, financial institutions, non-governmental organizations (NGOs) and research/education institutions”. 48This definition covers every relevant flow of hardware, software, information and knowledge between and within countries, from developed to developing countries and vice versa whether on commercial terms or on a preferential basis. The IPCC acknowledges that “the treatment of technology transfer in this report is much broader than that in the UNFCCC or of any particular Article of that Convention”. 49 In particular, the Convention and the CDM, as an international mechanism, focus on international transfers of technology.
Transfer of knowledge, not just equipment, is an important aspect of technology transfer. The United Nations
Conference on Trade and Development (UNCTAD) excludes the mere sale or lease of goods from technology transfer. 50
Equipment that embodies a technology new to a country must be accompanied by transfer of sufficient knowledge to successfully install, operate and maintain the equipment.
The survey conducted by the secretariat in 2011 asked respondents for their view on when an organization can state it ‘has’ a technology. 51 A significant majority of respondents, (68 per cent) indicated that it is when an organization uses and has knowledge of the technology. Simply using a technology (20 per cent) or having knowledge of a technology (10 per cent) is not sufficient. Thus, the views of most respondents are consistent with the the UNCTAD definition and the literature. 52
Whether technology transfer also requires that the recipient country be able to adapt the technology to local conditions, to produce similar equipment domestically, or to further develop the technology is debated in the literature. 53 Technology transfer induced by the CDM naturally will focus on meeting the technology needs of the projects. In most cases those needs can be met with imported equipment and/or knowledge. Creation of capacity in the recipient country to adapt, produce or further develop the technology is likely to be rare. 54
3
44 TERI, 2012, Section 4.3.
45 Johnstone, et al., 2010., and Sterk et al., 2009
46 The technologies may need to be adapted to developing countries’
conditions, and technologies may need to be developed to mitigate emissions from sources found predominantly in developing countries.
47 Cools, 2007; Popp, 2011, p. 136; and Das 2011.
48 IPCC, 2000, p. 3.
49 IPCC, 2000, p. 3.
50 UNCTAD, 1985, chapter 1, paragraph 1.2.
51 To assist respondents the survey defines the terms as follows:
technology – could include equipment, machinery, tools, techniques, crafts, systems or methods of organization; use – could include owning and/or operating equipment or processes that use the technology; and knowledge – could include shared or exclusive participation in patents, licences, training programmes, academic papers, etc. relating to the technology.
52 Foray, 2009; Lall, 1993; and Popp, 2011.
53 Das (2011) defines three types of technology transfer; III –technology
import, II – import with local adaptation or improvement, and I - host country development of a technology. The analysis of the PDDs for 1,000 registered projects found 259 with Type III, 6 with Type II and 0
with Type I technology transfer. However, as discussed in section 3.6
below, the PDDs understate the extent of technology transfer.
54 Virtually every country has the capacity to operate and maintain
United Nations
Framework Convention on Climate Change
28
Benefits of the Clean Development Mechanism 2012
Technology transfer via CDM projects
International transfer of technology is unlikely if the technology is already available in the recipient country. Thus, technology transfer via CDM projects is likely to occur less frequently for mature technologies already widely available in developing countries, such as hydroelectric generation and cement production. Technology development and transfer can happen relatively quickly, 55 so the frequency and type of technology transfer via CDM projects is likely to change over time.
3.2. TECHNOLOGY TRANSFER CLAIMS OF CDM
PROJECTS
CDM project participants are requested to “include a description of how environmentally safe and sound technology and know-how to be used is transferred to the host Party(ies)” in the PDD. 56 Claims of technology transfer made by project participants in the PDD are generally explicit enough to be used for technology transfer assessment. The claims made in the PDDs for 3,949 CDM projects registered and undergoing registration in 71 host countries up to June 2012 (comprising an additional 717 projects to those in UNFCCC 2011 57) were tabulated and analysed.
As in the previous study (UNFCCC, 2011), each PDD is searched using a number of keywords to ensure that all statements relating to technology transfer are identified. 58 The statements are tabulated under the following categories:
• The project is expected to use imported equipment;
• The project is expected to use imported knowledge;
• The project is expected to use imported equipment and knowledge;
• It is stated that the project will not involve technology transfer;
• There are no statements with respect to technology transfer;
• Other statements relating to technology transfer.
It can be inferred from the statements in the PDDs that project participants overwhelmingly interpret technology transfer by the CDM project to mean equipment new to a country accompanied by transfer of sufficient knowledge to successfully install, operate and maintain the equipment. 59
Technology transfer-related statements in the PDD reflect expectations at the time the project is being validated. The actual nature and frequency of technology transfer may differ, as discussed in Section 3.6 below.
3.3. TECHNOLOGY TRANSFER BY PROJECT TYPE
Project characteristics and the frequency of technology transfer – by number of projects and share of expected annual emission reductions – are shown in Figure 6 and
Table A-2 by project type. 60 Of the projects that make an explicit claim regarding technology transfer – either that they do or do not involve technology transfer – 39 per cent representing 59 per cent of the total estimated annual emission reductions claim technology transfer. These results are consistent with previous UNFCCC studies. 61
The PDDs of 18 per cent of the projects made no explicit statement concerning technology transfer. The percentages reported above exclude those projects. 62 As discussed in Section 3.6, most projects that make no statements relating to technology transfer actually involve technology transfer. Studies that express the number of projects that claim technology transfer as a percentage of all CDM projects reviewed implicitly assume that no statement relating to technology transfer means no technology transfer. Thus those studies understate the true rate of technology transfer. 63
55 Johnstone, et al., 2010.
56 UNFCCC, 2008, p. 8. TERI, 2012, p. 70 notes that the PDD format and
technology transfer reporting requirement have changed over time.
57 UNFCCC, 2011, p. 22.
58 Keywords included technology, transfer, import, foreign, abroad,
overseas, domestic, and indigenous.
59 A small number of projects claim transfer of technology within
the host country. These projects are assessed as not involving (international) technology transfer.
60 See Table A-1 for definitions of the project types.
61 UNFCCC, 2010, table IV-2, p. 19 shows corresponding figures of 40 per
cent and 59 per cent respectively for 4,984 projects in the pipeline (projects registered, undergoing registration and undergoing validation) as of 30 June 2010. UNFCCC, 2011, table VII-10, p. 43 shows corresponding figures of 42 per cent and 64 per cent respectively for 3,232 registered projects as of 30 June 2011.
62 This understates the frequency of technology transfer because 70 per
cent of these projects involve technology transfer.
United Nations
Framework Convention on Climate Change
Benef