Evaluation of Grain Yield and Aroma of Upland Rice
(Pare Wangi var.) as Response to Soil Moisture and Salinity
I.G.B. AdWItA ARSA
1,2*, ARIffIn
3, nURUl AInI
3and H.J.d. lAlEl
41Agriculture Faculty of Nusa Cendana University,
2Post Graduate Program of Agriculture Faculty of Brawijaya University, Malang, Indonesia. 3Agriculture Faculty of Brawijaya University, Jl. Veteran, Malang Jawa Timur, Indonesia. 4Agriculture Faculty of Nusa Cendana University, Jl. Adisucipto, Kupang, NTT, Indonesia.
http://dx.doi.org/10.12944/CARJ.4.1.03
(Received: December 31, 2015; Accepted: February 04, 2016) ABStRAct
This research aims to identify the effects of soil moisture and salinity on aroma quality and yield of Pare Wangi rice. Aroma quality was determined based on 2-Asetyl-1-pirolin (2AP) content. This study was conducted in Pare Wangi, Kori village, East Nusa Tenggara Province. Completely randomized design was used in the study, consisted of two-factor treatment: soil moisture and salinity level. The results showed that Pare Wangi produce higher grain yield (39.55 g/pot) at high soil moisture levels (125% FC). It was decrease to be 32.87 g/pot and 22.36 for soil moisture level 100% FC and 75% FC repectively. At high soil moisture ( 125% FC) and 2.5 g NaCl.kg-1 soil caused
an increase of 2AP rice content up to 1.84 ppb. Soil moisture at 75 % FC without NaCl was the best treatment for producing the highest 2AP content (3.19 ppb). 2AP content of rice was positively correlated to rice-aroma score.
Keywords: Aromatic Rice, Soil Moisture, Soil Salinity, Proline, 2-Asetyl-1-pirolin.
INTRODUCTION
East Nusa Tenggara province is one of rice producing region in Indonesia, which continues to increase rice production to meet the demand of rice in this area. For all this time, the shortage has been always resolved by bringing rice from outside the region. The development of upland rice is the most appropriate solutions to increase rice production in the province because of its potential of dry land availability is quite extensive. Because of that reason, upland rice varieties need to be selected for more easily adopted by local farmers, either due to consideration of adaptability, taste or economic value.
Aromatic upland rice is kind of rice plants which generally favored by farmers because of its good taste, strong scent and higher selling values
than non-aromatic ones. One of aromatic rice variety is well adaptable in dry land of East Nusa Tenggara, especially in several place at Southwest Sumba is Pare Wangi. The main development area of this rice variety still limited on its origin and not yet well develop on the other region, neither in Southwest Sumba nor East Nusa Tenggara in general.
Biosynthesis process to enhance the aroma and environmental factors that affect the strength of aroma had been identified. Biochemical causes of the increase in aromatic rice aroma compounds were identified as 2-acetyl-1 Pirolin or abbreviated as 2AP, a metabolite results of proline amino acid derivatives which volatile and contained in very low numbers1,2. In order to determine the indirect indicators of the nature of aroma, some researchers look for connection of aroma properties to other properties, such as physiological characteristics, husked-rice characteristics, or the nutritional content of rice3-5.
Soil water content differences were founded in determine the different levels of aromatic rice aroma, also salinity differrences6-8. Soil moisture reduction or salinity increase also reported improve the aroma strength of aromatic rice. Furthermore, nutrient factors (Zn, P, and N) as well as soil organic matter affect to the aroma strength of upland rice9,10,11. The aroma, not only been identified in rice, but also found in other plant parts, such as leaves of aromatic rice seedlings7. The formation process of 2AP compounds reported to have taken place since vegetative phase and continued in the generative phase, even in seed formation12.
Soil moisture and/or salinity, as well as drought stress should be applied appropriately to produce maximum expected quality aroma and yield losses could be pressed as low as possible. Growing environmental conditions without drought or excessive drought stress, are not profitable in development of aromatic rice, because the productivity of the plant is not in line with the quality of the aroma. At the time of high yield, the scent is reduced and vice versa2,10. The possible environmental conditions for this variety is growing environments with moderate levels of drought stress. Because of its dependence of rainfall cause the condition is often difficult to find. Therefore, technology development of aromatic upland rice varieties in the region of Pare Wangi origin becomes imperative.
Preliminary test results indicate that the groundwater levels is lower and salinity is higher in specific locations of Pare Wangi rice variety than the target (development) location. These results are
consistent with previous studies by Arsa et al.,13. The aroma of aromatic rice at its origin is stronger than other location is also noted in the study of Hien et al.14.
Designing technology for aromatic upland rice varieties Pare Wangi needs to be done through series of studies in controlled environments. The present study was, therefore, specifically designed to obtain appropriate condition of soil moisture and salinity levels for Pare Wangi variety to provide optimal rice aroma quality and grain yield.
MAtERIAlS And MEtHOdS
ariety
Upland rice variety, Pare Wangi, was a purified result from one of quite dominant local varieties developed in several place at Southwest Sumba because of its superior scent. The initial condition of this variety, still mixed with other genotypes that were still seen as a mixed population of some genotypes. Purification was done for three generations with negative mass selection, and eventually acquired more homogeneous population.
Experimental design
This study was carried out in a Green House with two-factor design, and using Completely Randomized Design. Soil experiment was taken at targeted extending location in Kori village, North Kodi Sub District, Southwest Sumba Regency, East Nusa Tenggara Province, Indonesia. The treatments were consisted of two factors and replicated three times. The first factor was salinity (S), which comprised of 5 dosage levels, i.e.: without NaCl (s0), 1 g NaCl. kg-1 soil (s1), 2 g.kg-1 soil (s2), 3 g.kg-1 soil (s3), and 4 g.kg-1 soil (s4). The second factor was soil moisture (W) with four levels of field capacity (FC), i.e.: 125% FC (w1), 100 % FC (w2), 75% FC (w3), and 50% FC (w4). In total, 20 treatment combinations were assigned, with 60 experimental units then sub-divided into 120 planting pots, one group of 60 pots for destructive and the rest for non-destructive observations.
included existing soil water content and soil texture, while the chemical properties included soil C-org, N, P, K, Na, Zn content and soil electric conductivity (EC). Agronomical characters observed in this study included number of seedlings per pot, plant height, leaf area, flowering dates, number of panicles per pot, number of grains per panicle, percentage of unfilled grains, 100-grain weight, and grain yield per pot. Observed physiological characters included N, P, K, Na and Zn contents, chlorophyll content and proline content of leaf. The quality of rice aroma was determined based on 2AP content of rice and rice-aroma scores obtained from organoleptic assay. leaf tissue Analysis
Leaf tissue during flowering stage was used for leaf tissue analysis. Two upper leaves (second and third leaves) of each plant in destructive pots were taken and combined for all replications, resulted in 20 composite leaves samples for all treatments. Determination of N, P, K, Na and Zn content of leaf tissue was performed by using Atomic Absorption Spectrophotometer (Perkin Elmer 3110) following the standard methods of AOAC15.
chlorophyll measurements
Chlorophyll content was measured as follows: 2.0 g of leaf samples were crushed with a mortar then was added with 10 mL acetone (80%). The filtrate then poured into an Erlenmeyer glass through a funnel attached with filter paper. 1 mL filtered filtrate was taken and diluted using ddH2O into a total volume of 10 mL. Filtrate absorbance then measured by spectrophotometer. Total chlorophyll content was calculated with the standard formula according to Arnon, which total chlorophyll content equals to sum of chlorophyll-a and chlorophyll-b. Chlorophyll-a (mg.L-1) was calculated as 12.70 x OD663 – 2.69 x OD645, whereas chlorophyll-b (mg.L-1) was calculated as 22.9 x OD645 – 4.68 x OD663. The unit then converted into mg.g-1 fresh weight16.
level of free proline
Level of free proline (LFP) was determined following the procedure of Bates et al 17. Total of mashed 0.5 g of leaves sample with mortar was added with 10 ml sulfosalicylic acid 3%, then stirred.
Filtrate was obtained by filtering the homogenate with Whattman no.40 paper. Two mL of filtrate was taken and reacted with 2 mL of acidic ninhydrin and 2 mL of glacial acetic acid in a test tube. This process was conducted at 100°C for an hour until then terminated by soaking the test tube in cold water. Four mL of toluene was added into filtrate mixture and kept for 15-20 seconds, then stirred and settled at room temperature to enable the separation of toluene phase and water phase. The absorbance of toluene phase contained proline was measured at 520 nm using spectrophotometer (model 6405 UV/VIS, Jenway Ltd., Essex, England). The total of LFP was calculated by standard curve of proline.
Measurement of the 2AP content and the Aroma Score of Rice
The content of rice 2AP was measured using samples from every pot experiments (non-destructive) following method of Lalel et al., and Wongpornchai et al.18,19. The volatile compounds were extracted using Head Space Solid Phase Micro Extraction (HS-SPME) technique with the 100 polydimethylsiloxane SPME manual device (Supelco Co., Bellefonte, PA, USA). Separation and quantification of 2AP compound was achieved using GC-MS (Hewlett Packard 5890 series, USA) equipped with a DB5MS capillary column (50 m x 0.2 mm id., 0.33 µm film thickness; J & W Scientific, Folsom, CA, USA). 2AP total was calculated using external standard (calibration curve). Organoleptic test was conducted by ten panelists which have been well trained to assess the aroma score of rice following modified method of Lestari et al.20. Rice was cooked in test tube for 15 minute and kept warm at 40oC. Quality of rice aroma was scoring 0-4 (no aroma to very strong aroma).
Statistical Analysis
RESUlt And dIScUSSIOn
Soil physical and chemical properties
Soil used in this study was sandy loam textured type. Existing soil water content(SWC) was 16.0%. Field capacity soil water content (SWC) and permanent wilting point SWC were respectively 28.0% and 18.10%. Level of C-org, total-N, P, K, and Zn were respectively 3.97%, 0.13%, 69.02 ppm, 0.82 me.100 g-1, and 0.46 ppm . Soil Electrical Conductivity (EC) value was 0.10 mS and Na content was 2.48 me.100 g-1 soil (Table 1).
Sandy loam texture is the most suitable soil texture for rice plants growth because it was not bind much water, thus the available water and dissolved nutrients are easily absorbed by plant roots. Root system of Pare Wangi upland rice variety on sandy loam texture had better development than clayey loam texture which became determining factor for the increase of grain yield of the rice variety13. High existing soil moisture content showed that it was rain quite often before soil used. Furthermore, the data from soil chemical properties analysis indicate that the land used has a very high content of C-org and P total, low content of N and K, very low content of Zn, low total salinity indicated by the relatively low EC content, and relatively high levels of Na content. Agronomic characters
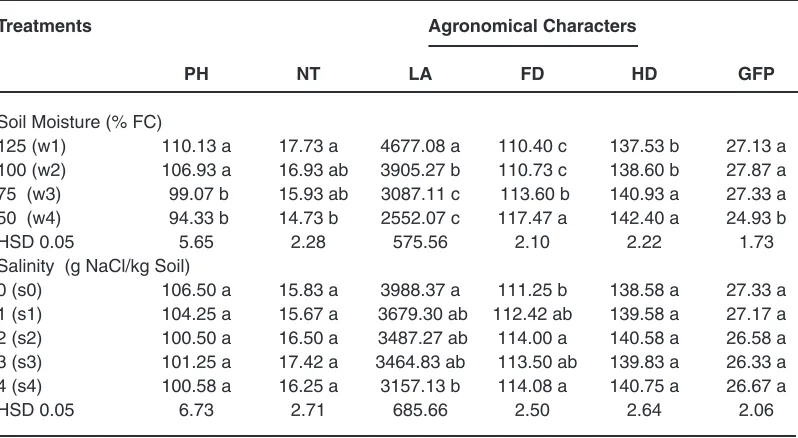
The performance of agronomic characters of inhibited crops on 50% and 75% FC soil moisture compared to 100% and 125% FC soil moisture (Table 2 and 3). A significant decrease of plant height was occurred at soil moisture level of 75% FC. The plant leaf area at 75% FC was also significantly lower than at 125% and 100% FC (Table 2). The flowering and harvesting date were significantly delayed at soil moisture levels of 75% and 50% FC, but the grain filling period was obviously shorter at 50% FC soil moisture level. These performance related to the status of water as an essential component of cell formation and metabolic processes of plants which would be required in a great amount for plants growth21. It is required in a large amount along vegetative and generative growth stages. Vegetative stages including plant height, number of seedlings and plants leaf area will be low when the plant cell experience water deficit resulting from drought
stress. Delay in plants vegetative growth stage ultimately caused delay in generative growth stage, including flowering stage and seed filling period. Photosynthetic product required for seed filling period also dramatically decreases due to drought stress (Table 2).
Leaf area reduction and grain filling period shortening as affected by further soil moisture caused a decrease in number of panicles, number of grains, and 100-grain weight and increased number of unfilled grain (Table 3). On the contrary, higher plant yield components at higher soil moisture level (125% FC) caused significantly higher grain yield. This indicated that Pare Wangi upland rice variety is adapted well to wetland.
Plant leaf area at salinity greater than 2 g NaCl.kg-1 soil was reduced compared to control. This salinity level also delayed the emergence of flowering stage (Table 2). Further increase of salinity level at 4 g NaCl.kg-1 soil caused low 100-grain weight and number of grains, while it had no significant effect on grain yield (Table 3). Increased salinity inhibits those characters due to indirect drought stress, in addition to other adverse effects of salinity, such as poisoning and ionic deficiencies in plants7.
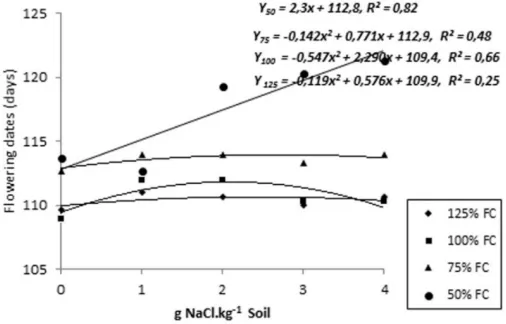
Interaction between soil moisture and soil salinity significantly affect flowering date and grain filling period. Flowering dates were getting longer in soil salinity increase at 50% FC soil moisture and showed quadratic responses at higher soil moisture levels (Figure 1). Grain filling period was getting shorter along with soil salinity increase at 50% FC soil moisture, however, it was stable and similar at higher soil moisture levels, i.e. 75%, 100%, and 125% FC (Figure 2). Soil salinity at lower soil humidity strongly slowed down both the flowering period and the grain filling period. This was likely be caused by decrease of cell water potential, and photosynthesis process inhibition which finally affected the flowering period. In the flowering stage, drought stress inhibits photosyntesis process and decreases carbohydrate formation, which then decreases assimilation product translocated to the seeds21,22. At highly severe drought stress, plant leaves yellowing on early stage, thus reducing plants leaf area23. At the end, filling capacity of seeds becomes lower, thus grain filling period became shorter (Figure 2).
Increase of soil salinity showed positive effect on number of tillers but this salinity increase delayed the flowering period at certain salinity level (Table 2). This was shown mainly as a quadratic response to the increase of soil salinity at soil humidity level of 75% 100%, dan 125% FC (Figure 1). NaCl positive effects in increasing tiller numbers were very possible because relatively low soil K levels founded in this study (Table 1).
chlorophyll, Proline content, and nutrient Absorptions of leaf tissue
The decline rate of chlorophyll content was affected by salinity increase. The rate of chlorophyll content was decline faster in 125% and 100% FC than 75% and 50% FC (Figure 3). This indicates a faster rate of chlorophyll molecules formation due to increase of salinity at higher soil moisture levels. This process was probably related to the higher nutrients solubility, such as N, at higher soil moisture levels (as well as faster transpiration process) and conversely, lower N solubility founded in lower soil moisture levels (as well as lower transpiration process) while N element is one of the main components of chlorophyll formation. The decrease of N uptake on leaves due to soil salinity increased on higher soil moisture levels were possibly the cause for the faster chlorophyll rate decline on higher soil moisture. This was confirmed by the results of positive correlation analysis between chlorophyll levels and leaf tissue N levels (Table 6).
Effect of interaction between salinity and soil moisture to leaf tissue proline content was significant at high salinity treatment (> 2.0 g NaCl. kg-1 soil), more profoundly at 50% FC soil moisture. Meanwhile, the increase of salinity level up to 1.0 g NaCl.kg-1 soil had no significant increase of proline content for soil moisture. At this salinity level, a decrease of proline content was also observed at soil moisture level of 50% FC (Figure 4). Significant differences of leaves proline content significantly showed at salinity level of 3.0 g NaCl.kg-1 soil. At this
salinity level, proline content at 50% FC soil moisture was significantly higher than other soil moisture levels. Proline content at 75% FC soil moisture tend to be higher than 100% and 125% FC. This is implied that salinity level at 3.0 g NaCl.kg-1 soil or higher will promote proline formation. This could be explained as a result of multiple effects between water deficit and salinity increase, which led to increased drought stress. This would induce plants to adjust its osmotic pressure through proline formation.
The present finding is consistent with theoretical explanation about mechanisms underlying the plant’s adaptation toward the effect of drought stress, i.e. through formation of non-functional compounds, including proline, in order to increase
the osmotic pressure of cell solution24. The present study demonstrated a negative correlation between leaf proline and leaf chlorophyll content (Table 6). In drought stress condition, amino acid is synthesised in aromatic rice not to form glutamic acid but 2AP compound25. Therefore, the inhibition of glutamic acid in drought stress condition affected the chlorophyll formation26.
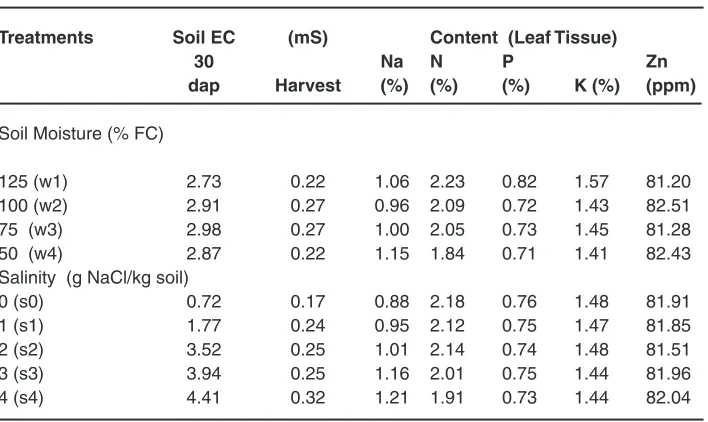
The effects of soil moisture decline and soil salinity increase to Na, N, P, K, and Zn contents of leaf tissue are presented at Table 4. The decline in soil moisture caused no differences in absorption of Na, but tended to reduce absorption of N at 50% FC soil moisture. Meanwhile, salinity increase significantly built up Na absorption but reduced N
fig. 2: the effect of salinity to grain filling period at various levels of soil moisture
absorption at the salinity level of 4.0 g NaCl.kg-1 soil. Absorptions of other elements appeared were not affected by either soil moisture decline or soil salinity increase. Hyperosmotic increase as affected by salinity increase was revealed by the increase of soil solution EC. The increase of hyper ionic was
table 1: chemical and physical properties of the soil used in the present study.
types of Results of
Analysis Soil Analysis
Existing soil water content (%) 16.0 Field capacity SWC (%) 28.0 Permanent wilting point SWC (%) 8.10
Soil texture Sandy loam
C-organic content (%) 3.97
N (%) 0.13
P (ppm) 69.02
K (me.100g-1) 0.82
Na (me.100g-1) 2.48
Zn (ppm) 0.46
EC (mS) 0.10
table 2: Agronomic characters of the plant under various levels of soil moisture and salinity
treatments Agronomical characters
PH nt lA fd Hd GfP
Soil Moisture (% FC)
125 (w1) 110.13 a 17.73 a 4677.08 a 110.40 c 137.53 b 27.13 a 100 (w2) 106.93 a 16.93 ab 3905.27 b 110.73 c 138.60 b 27.87 a 75 (w3) 99.07 b 15.93 ab 3087.11 c 113.60 b 140.93 a 27.33 a 50 (w4) 94.33 b 14.73 b 2552.07 c 117.47 a 142.40 a 24.93 b
HSD 0.05 5.65 2.28 575.56 2.10 2.22 1.73
Salinity (g NaCl/kg Soil)
0 (s0) 106.50 a 15.83 a 3988.37 a 111.25 b 138.58 a 27.33 a 1 (s1) 104.25 a 15.67 a 3679.30 ab 112.42 ab 139.58 a 27.17 a 2 (s2) 100.50 a 16.50 a 3487.27 ab 114.00 a 140.58 a 26.58 a 3 (s3) 101.25 a 17.42 a 3464.83 ab 113.50 ab 139.83 a 26.33 a 4 (s4) 100.58 a 16.25 a 3157.13 b 114.08 a 140.75 a 26.67 a
HSD 0.05 6.73 2.71 685.66 2.50 2.64 2.06
Numbers followed by the same letter(s) are not significantly different at Honestly Significant Difference (HSD) post hoc test (0.05). PH = Plant height at flowering stage (cm), NT = Maximum number of tillers, LA = Leaf area at Flowering stage (cm2), FD = Flowering date (dap), HD = Harvesting date (dap), GFP = Grain filling period (days).
indicated by Na absorption increase. Ion imbalance was revealed by the decrease of N nutrient. 2AP contents and Aroma Score
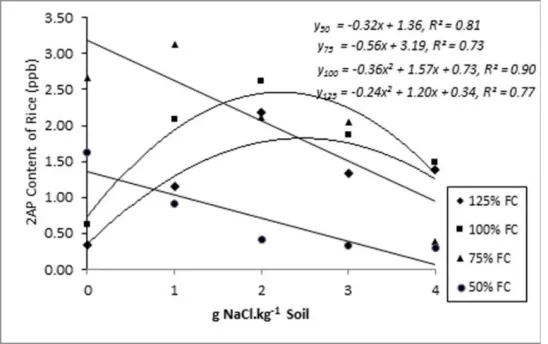
At the level of 125% and 100% FC soil moisture, soil salinity increase up to optimum dose resulted in an increase of 2AP content. However, at 75% and 50% FC soil moisture of, salinity increase caused reduction in 2AP content (Figure 5). Based on the regression equation, maximum 2AP content at 125% FC soil moisture and 2.50 g NaCl.kg-1of soil was 1.84 ppb. At the level of soil moisture 100% FC and 2.18 g NaCl.kg-1of soil, maximum 2AP content was 2.44 ppb. At the level of soil moisture 75% FC and 50% FC and without salinity treatment, maximum 2AP content was respectively 3.19 ppb and 1,36 ppb. Furthermore, the increase of 1.0 g NaCl.kg-1 soil at 75 % FC soil moisture provided 2AP content until 2.63 ppb. This content was higher than maximum 2AP content produced by plants in response to salinity treatment at 125% and 100% FC soil moisture.
dosages of NaCl increased maximum rice 2AP content. This illustrates interaction between soil humidity and NaCl dosages to trigger drought stress levels by increase rice 2AP content. Results of the present study was in line with results of previous studies on the effect of drought stress on increased content of 2AP in aromatic rice78.
Interaction effect of treatments applied in the present study was unable to improve the aroma of Pare Wangi upland rice variety. Organoleptic assay on rice samples revealed that treatment combination of soil moisture and salinity only provided medium aroma strength (score range was <2.50), and not yet provided ‘strong aroma’ based on the sensory method (Table 5), despite there was significant
positive correlation between rice 2AP content and aroma score (Table 6).
Research results presented in Figures 4 and 5 demonstrate a distinct response pattern between leaf tissue proline and rice 2AP contents to the elevation of salinity for each level of soil humidity. In general, it appears that increase of proline content was not always followed by an increase in 2AP content. At soil humidity levels of 75% FC and 50% FC, proline content did increase following increase level of salinity but the 2AP content did decrease following the increase level of salinity. Consequently, correlation between of 2AP and proline contents among treatments was insignificant (Table 6). However, there was a tendency of positive correlation
fig. 4: the effect of salinity to proline content at various levels of soil moisture
between proline content and 2AP content at higher soil salinity levels up to 2.0 g NaCl.kg-1 soil and at higher soil humidity levels (100% and 125% FC).
The observed positive correlation between Na content and proline content showed that the increase of proline was triggered by increase of
table 3.Yield components and yield under various levels of soil moisture and salinity
treatments yield components and yield
nP nG UG W100 GY
Soil Moisture (% FC)
125 (w1) 12.67 a 173.73 a 14.20 b 2.36 a 39.55 a
100 (w2) 12.40 a 154.40 a 16.07 b 2.35 a 32.87 b
75 (w3) 11.07 a 123.47 b 23.13 a 2.63 a 22.36 c
50 (w4) 8.87 b 102.27 b 27.56 a 2.15 b 12.52 d
HSD 0.05 1.68 26.24 4.48 0.16 4.37
Salinity (g NaCl/kg Soil)
0 (s0) 11.17 a 150.42 a 18.15 a 2.41 a 28.37 a
1 (s1) 11.08 a 147.42 ab 20.24 a 2.37ab 27.96 a
2 (s2) 11.42 a 139.58 ab 22.09 a 2.25 ab 27.14 a
3 (s3) 11.58 a 137.92 ab 20.52 a 2.27 ab 27.11 a
4 (s4) 11.00 a 117.00 b 20.19 a 2.23 b 23.54 a
HSD 0.05 1.99 31.26 5.34 0.19 5.21
Numbers followed by the same letter(s) are not significantly different at Honestly Significant Difference (HSD) post hoc test (0.05).NP = Number of panicles / pot, NG = N umber of grains (grains / panicle), UG = Unfilled grains (%), W100 = Weight of 100 grains (g), GY = Grain yield / pot (g)
table 4: the effect of soil moisture and salinity levels on soil Electrical conductivity and leaf tissue contents of na, n, P, K and Zn.
treatments Soil Ec (mS) content (leaf tissue)
30 na n P Zn
dap Harvest (%) (%) (%) K (%) (ppm)
Soil Moisture (% FC)
125 (w1) 2.73 0.22 1.06 2.23 0.82 1.57 81.20
100 (w2) 2.91 0.27 0.96 2.09 0.72 1.43 82.51
75 (w3) 2.98 0.27 1.00 2.05 0.73 1.45 81.28
50 (w4) 2.87 0.22 1.15 1.84 0.71 1.41 82.43
Salinity (g NaCl/kg soil)
0 (s0) 0.72 0.17 0.88 2.18 0.76 1.48 81.91
1 (s1) 1.77 0.24 0.95 2.12 0.75 1.47 81.85
2 (s2) 3.52 0.25 1.01 2.14 0.74 1.48 81.51
3 (s3) 3.94 0.25 1.16 2.01 0.75 1.44 81.96
table 5: the effect of combined treatment of soil moisture level and salinity on rice-aroma score.
Soil Moisture Salinity (g nacl.kg-1 soil)
0.0 1.0 2.0 3.0 4.0
125% FC 0.5 1.9 1.8 1.9 1.7
100% FC 0.5 2.0 2.1 1.8 1.9
75% FC 2.2 2.1 2.1 2.1 2.0
50% FC 1.9 1.9 1.9 1.8 1.8
Na content in leaf tissue. This fact was supported by negative correlation between Na content and 2AP content. A significant and negative correlation did occur between 2AP content and leaf tissue Na content (Table 6). This was caused by dominant effect of salinity at soil humidity level of 50% FC and 75% FC, and also higher (above optimum) salinity level at soil humidity level of 100% FC and 125% FC (Figure 4). Overall, negative correlation between rice 2AP content and leaf tissue Na content was also triggered by the existing high soil Na content (Table 1).
No correlation founded between yield components with aroma quality (Table 6). This showed that changes in both yield component characters and grain physical were response to drought stress which
was triggered by interaction between soil moisture and salinity but it was not correlated with 2AP content and aroma score. These results were not in accordance with previous studies2,8. They stated that the increase in 2AP content negatively correlated with crop yield components. The difference was likely related to differences level of stress given, because an increased of 2AP levels and a decrease in grain yield/pot while exposed to water deficit stress of 75% soil moisture or 2.0 g NaCl/kg soil salinity stress also founded in this study.
Positive correlation between yield component and grain yield/pot, respectively with N content and chlorophyll content, also had negative correlation with Na content in leaf tissue (Table 6). The importance of N nutrient proved that increased
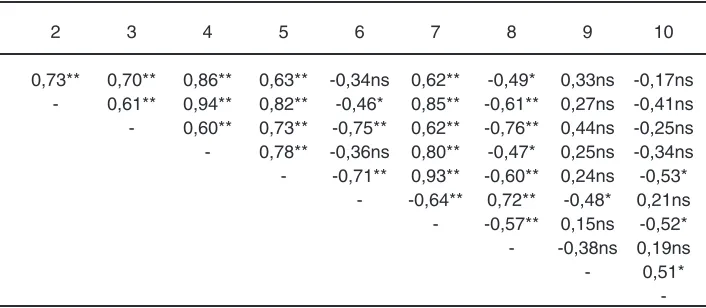
table 6: Results of simple correlation analysis between each plant character
r 2 3 4 5 6 7 8 9 10
1 0,73** 0,70** 0,86** 0,63** -0,34ns 0,62** -0,49* 0,33ns -0,17ns 2 - 0,61** 0,94** 0,82** -0,46* 0,85** -0,61** 0,27ns -0,41ns 3 - 0,60** 0,73** -0,75** 0,62** -0,76** 0,44ns -0,25ns 4 - 0,78** -0,36ns 0,80** -0,47* 0,25ns -0,34ns
5 - -0,71** 0,93** -0,60** 0,24ns -0,53*
6 - -0,64** 0,72** -0,48* 0,21ns
7 - -0,57** 0,15ns -0,52*
8 - -0,38ns 0,19ns
9 - 0,51*
yield component and grain yield and in turn the effect of Na content increase decreasing yield component and grain yield. Effect of N and Na nutrient was directly related with chlorophyll formation and photosyntesis process.
On aromatic rice, proline content often reported to have a close correlation with the level of 2AP7. But in this study the correlation between the proline content of leaves and levels of 2AP was not significant which means an increase in proline content was not always linear with an increase of 2AP levels.
Rice-aroma scores of organoleptic assay showed a positive correlation with 2AP content of rice which confirms that 2AP compound was one of the most determines the strength of aromatic rice aroma. Furthermore, negative correlation of aroma scores with yield components and grain yields was related to negative correlation between 2AP and leaf chlorophyll content (Table 6).
cOnclUSIOn
Soil moisture and salinity interaction have no significant effect with grain yield/pot, but they have significant effect with 2AP content of rice. Pare Wangi produced higher grain yield (39.55 g/ pot) at high soil moisture levels (125% FC). It was decrease to be 32.87 g/pot and 22.36 g/pot for soil moisture level 100% FC and 75% FC repectively. At high soil moisture (125% FC) and 2.5 g NaCl.kg-1 soil caused an increase of 2AP rice content up to 1.84 ppb. At the level of soil moisture 100% FC and 2.18 g NaCl.kg-1of soil, maximum 2AP content was 2.44 ppb. Soil moisture at 75 % FC without NaCl was the best treatment for producing the highest 2AP content of rice (3.19 ppb). 2AP content of rice was positively correlated to rice-aroma score, but it was not significantly correlated to other characters of plant.
REfEREncES
1. Buttery R.G., Ling L.C., Juliano B.O. Chem. Ind., 12,958–959 (1982).
2. Kibria K., Islam M.M., and Begum S.N. Bangladesh. J. Bot., 37(2), 141-147 (2008). 3. Bhonsle S.J., and Krishman S. J. of Agric.
Sci., 2(3) 99-107 (2010).
4. Zhang H., Tan G., Wang Z., Yang J., Zhang J. Plant. Growth. Regul., 58, 85-96 (2009). 5. Meena S.K., Vijayalakshmi D., and Ravindra
U. J. Dairy. Foods. Home. Sci., 28(2), 137-141 (2009).
6. Yoshihashi T., Nguyen T.T.H., and Kabaiki N. Jarq 38(2), 105-109 (2004).
7. Roychoudhury A., Basu S., Sarkar S.N., Sengupta D.N. Plant. Cell. Rep., 27, 1395– 1410 (2008).
8. Gay F., Maraval I., Roques S., Gunata Z., Boulanger R., Audebert A., and Mestres C. Field. Crops. Res., 117, 154-160 (2010). 9. Jin-xia H., Di X., Yang D.M., Hua T., Guo-xi L.,
Ke-you Z., Xiang-ru T.College of Agronomy, South China Agricultural University, (2009). 10. Yang S., Zou Y., Liang Y., Xia B., Liu S.,
Ibrahim M.D., et al. Field. Crops. Res., 125,
151-160 (2012).
11. Champagne E.T. Cereal. Chem., 85(4), 445-454 (2008).
12. Itani T., Tamaki M., Hayata Y., Fushimi T., and Hashizume K. Plant. Prod. Sci., 7(2), 178-183 (2004).
13. Arsa I.G.B., Lalel H.J.D., dan Adu Tae A.S.J. Research Report. Nusa Cendana University, Indonesia (2011).
14. Hien L.N., Yoshihashi T., Sarhadi W.A., and Hirata Y. Plant. Prod.Sci., 9(3), 294-297 (2006).
15. AOAC. Association of Official Analytical Chemists, Maryland (2000).
16. Arnon D.I. Plant. Physiol. 24, 1-15 (1949). 17. Bates L.S., Waldren R.P., and Teare I.D. Plant
and Soil., 39, 205-208 (1973).
18. Lalel H.J.D., Singh Z., and Tan S.C. Postharvest Biol. and Technol., 27, 323-336 (2003). 19. Wongpornchai S., Dumri K., Jongkaewwattana
S., and Siri B. Food Chem., 87, 407-414 (2004).
12(2), 84-93 (2011).
21. Chaves M.M., Flexas J., and Pinheiro C. Ann. Bot., 103, 551-560 (2009).
22. Jaleel C.A., Manivannan P., Wahid A., Farooq M., Al-Juburi H.J., Somasundaram R., and Panneerselvam R. Int. J. Agric.Biol., 11(1), 100-105 (2009).
23. Kuixian Ji., Y. Wang, W. Sun, Q. Lou, H. Mei, S.
Shen, and H. Chen. J. of Plant Phys. 169 :336-344 (2012).
24. Mohammadkhani N., and Heidari R. World Applied Sci. J. 3(3): 448-453, 2008.
25. Fitzgerald, T.L, D.L. Ean Waters, L.O. Brooks, and R.J. Henry. 2010. Env. and Exp. Bot. 68:292-300 (2010).