Monitoring selected forest bird species through aerial application of 1080 baits,
Waitutu, New Zealand
Terry C. Greene*, Peter J. Dilks, Ian M. Westbrooke and Moira A. Pryde
Science and Technical Unit, Department of Conservation, PO Box 11089, Sockburn, Christchurch 8443, New Zealand *Author for correspondence (Email: tgreene@doc.govt.nz)
Published online: 25 October 2012
Abstract: Robust and reliable information is required to measure impacts of aerial 1080 operations on non-target
bird species. We examined the impact on seven forest bird species of an aerial pest control operation using 1080
cereal baits to poison possums (Trichosurus vulpecula) within Waitutu Forest, Fiordland National Park. The
survival of South Island kaka (Nestor m. meridionalis) and ruru (Ninox novaeseelandiae) was monitored using
radio telemetry, and replicated bird counts within and external to the operational area were used to monitor
changes in numbers of grey warblers (Gerygone igata), kaka, kereru (Hemiphaga novaeseelandiae), riflemen
(Acanthisitta chloris), robins (Petroica australis) and tomtits (P. macrocephala). All radio-tagged kaka known
to be present within the operational area prior to the application of toxic baits (n = 15) were alive 6 months
later. None of the 11 radio-tagged ruru present during the operation died from 1080 poisoning. One ruru found dead (cached in a hole) following the application of toxic baits was tested for the presence of 1080, and none was found. It is likely that this bird was killed or scavenged by a predator. Transect counts of tomtits and grey warblers provided the largest sample sizes and most interpretable results. There was no evidence of any negative impact of 1080 for these species. Similarly, independent measures from point counts conducted annually since 2006 at two locations within the operational area also failed to highlight any declines in distribution or relative abundance attributable to the application of 1080 baits for six of the bird species monitored. We recommend (1) further pest control operations within the Waitutu area to prevent further deterioration in diversity and size of bird populations and (2) the continuation of monitoring programmes capable of assessing direction and rates of change in key demographic parameters for the bird populations living there.
Keywords: non-target species, pest control, population trends, sampling design, sodium fluoroacetate
Introduction
Compound 1080 (sodium fluoroacetate) has been used to
control brushtail possum (Trichosurus vulpecula) populations
in New Zealand since the late 1950s (Spurr 1991, 2000; Eason et al. 2011). The increased adoption of cereal baits, introduction of non-toxic ‘pre-feed’ and reduced bait application rates have resulted in an improvement in the level of possum control achieved (Warburton et al. 2009; Eason et al. 2011). Effective, sustained possum control will result in improved forest condition and an associated decrease in competition for food between possums and many bird species (Pekelharing & Batcheler 1990; Pekelharing et al. 1998; Coleman et al. 2007; Innes et al. 2010). The reduced predation from possums and other predators that are also susceptible to 1080 (e.g. rats
Rattus spp. and mustelids Mustela spp.) also benefit forest bird populations (Innes & Barker 1999; Spurr 2000). Aerial 1080, while effective at maintaining low possum densities, may have some risks to some non-target species (Spurr & Powlesland 1997; Innes & Barker 1999; Sweetapple & Nugent 2007; Eason et al. 2011). This uncertainty has contributed significantly to the ongoing debate about the impacts of aerially spread 1080 (Veltman & Westbrooke 2011).
The population impacts of 1080 poisoning on forest bird species are largely dependent on the resilience of individual species (Eason et al. 2011). For those relatively common bird
species that have high reproductive rates, e.g. robins (Petroica
australis) and tomtits (P. macrocephala), small losses due to 1080 poisoning can be quickly compensated for by increases
in reproductive rates (Powlesland et al. 1999, 2000). However, for more threatened species (particularly those vulnerable to
predators and having low reproductive rates, e.g. kiwi Apteryx
spp. and kākā Nestor meridionalis), significant mortality
associated with toxin use could exceed any advantage conferred by reduced predation pressure and thus have detrimental population-level effects (Eason et al. 2011).
Reliable information is clearly required to measure the impacts of aerial 1080 operations. These may include beneficial or detrimental changes in the survival or reproductive rate of non-target species in subsequent years. This is particularly important if less resilient species are likely to be present and operational specifications (e.g. bait composition, toxic loading, sowing rate) change to a significant extent (Eason et al. 2011; Veltman & Westbrooke 2011). The risk of toxin-related mortality is yet to be quantified at the population level for 11 native bird species that are known to have died
(including riflemen Acanthisitta chloris, which are thought to be
BACI type designs (Underwood 1994), increased sample sizes, and long-term population monitoring, in conjunction with appropriate application of intensive monitoring methodologies for data-poor bird species, would significantly improve our ability to make robust inferences.
A partially replicated before/after control/impact (BACI) design utilising counts on transects at a minimum of two sites within, and a matched site external to, the area to be treated with 1080 has been used successfully for studying 1080 impacts on tomtits in the central North Island (Westbrooke et al. 2003). This methodology was also used to compare two bait types (carrot and cereal) (Westbrooke & Powlesland 2005). Although there has been considerable work on the impact of 1080 operations on tomtits (Powlesland et al. 2000; Westbrooke et al. 2003; Westbrooke & Powlesland 2005), much of this has concentrated on tomtit populations from the central North Island with only one unpublished study recorded from outside this region (Veltman & Westbrooke 2011). In addition to the focus on tomtits, a BACI design of this sort may also be appropriate for other highly territorial species such as the
rifleman and grey warbler (Gerygone igata).
We report on the impacts of an aerial possum control operation using 1080 cereal baits in Waitutu Forest, Fiordland National Park. We studied impacts on seven selected forest bird species, using radio telemetry (South Island kākā
Nestor m. meridionalis (a large native parrot) and rūrū Ninox
170°0'0"E 180°0'0" 35°0'0"S
40°0'0"S
45°0'0"S
Operational Area (25 000ha) Lake
Poteriteri
Wai raur ahiri Riv er New Zealand
$
Waitutu
Wai tutu
Riv er
Foveaux Strait
Princess Mountains
Lake Hauroko
Slaughter Burn
Waitutu
Poteriteri
Crombie
Wairere
0 3 6Km
Poteriteri
Crombie/Wairere
Slaughter Burn/Waitutu
novaeseelandiae (a native owl) and transect and point counts
(kākā, kererū Hemiphaga novaeseelandiae, tomtits, riflemen,
robins, and grey warblers).
Methods
Study site
Waitutu Forest (45 000 ha) occupies an irregular lowland basin in the south-east corner of Fiordland National Park and is dominated by a series of 13 uplifted marine terraces. These terraces rise from the south coast to an elevation of 1040 m and include the strip of coastal Māori land between the Waitutu and Wairaurahiri rivers (Elliott & Ogle 1985; Ward 1988) (Fig. 1). Alluvial terraces are also present but are restricted to major river drainages and generally occur at right angles to the much older marine terraces. Steep, mountainous terrain to the north, west and east surrounds the lowland areas, with tidal platforms and sandy beaches, backed by 30-m-high actively eroding cliffs, forming the southern coastal boundary with Foveaux Strait (Elliott & Ogle 1985).
Although not floristically diverse, the vegetation of the Waitutu area contains the greatest expanse of lowland forest remaining in New Zealand and is considered ‘outstanding’ in terms of its value to wildlife (Elliott & Ogle 1985; Mark
Figure 1. Location of Waitutu Forest study area showing operational area and the layout of transects within the treatment (Poteriteri,
et al. 1988; Southey 2000). The vegetation of the area has been described as a mosaic of forest types determined by climate, soils, topography and drainage (Nicholls 1976; Elliott & Ogle 1985; Mark et al. 1988). In general the coastal terraces and lowland alluvial flats are dominated by
podocarps (predominantly rimu Dacrydium cupressinum but
with miro Prumnopitys ferruginea and tōtara Podocarpus
cunninghamii), southern rātā (Metrosideros umbellata) and
an increasing quantity of beech (Nothofagus spp.) appearing
on the flat or rolling country away from the coast. Forests covering steeper slopes and at higher altitude are dominated
by silver beech (Nothofagus menziesii) and mountain beech
(N. solandri var. cliffortioides). On wetter, swampy sites silver beech gives way to mountain beech and, in places,
kahikatea (Dacrycarpus dacrydioides), yellow-silver pine
(Lepidothamnus intermedius), Coprosma spp. scrub and
stands of mānuka (Leptospermum scoparium). Kāmahi
(Weinmannia racemosa) is a common sub-canopy species in most forest types. Other important subcanopy species
include southern rātā, horopito (Pseudowintera colorata),
broadleaf (Griselinia littoralis) and tree ferns (Cyathea spp.
and Dicksonia squarrosa). Ground cover throughout the area
is dominated by dense crown fern (Blechnum discolor). Plant
nomenclature in this study follows Allan Herbarium (2000).
Operational area
The area treated during the possum control operation covered c. 25 000 ha of Waitutu Forest bordered by the sea to the south, the Waitutu and Wairaurahiri rivers on the western and eastern boundaries and the Princess Mountains to the north. The two non-treatment blocks were on the immediate east and west sides of the treated area (Fig. 1). Non-toxic RS5 prefeed baits (Animal Control Products, Wanganui) were distributed over
the operational area (1 kg ha–1) on 8 and 9 September 2010.
Subsequently, poor weather meant that toxic baits (RS5 baits
containing 0.15% 1080) could not be distributed (2.0 kg ha–1)
until 4 and 5 October 2010.
Monitoring pests
Possum numbers in Waitutu were monitored prior to (between 2006 and 2009) and immediately following the 1080 operation in 2010 using a standardised trap-catch index protocol (NPCA 2011) on randomised lines (20–55 lines; C. Bishop, DOC, Invercargill pers. comm.). Fluctuations in the numbers of mustelids and rodents in Waitutu have been monitored quarterly since 2002, using standardised lines of tracking tunnels (PJD, unpubl. data). Tracking rates were determined immediately prior to and after the distribution of 1080 baits within the operational area, and at regular (quarterly) intervals thereafter.
Sampling design and survey methods for radio-tagged birds
Although radio-tagged birds are able to provide extremely robust information on the direct impact of toxins such as 1080 (Powlesland et al. 2003), this technique is limited to those species that are able to carry a transmitter for sufficient periods of time without compromising individual survival (Kenward 2001; Millspaugh & Marzluff 2001) and can be captured in sufficient numbers. By simply monitoring their status (alive or dead) prior to and following the operation, the fate of individuals can be determined, corpses recovered, and the cause of death quickly assessed. Monitoring efficiency is improved markedly by using transmitters with built-in mortality switches (a doubling of the transmitter pulse rate if there is
no movement for 24 h) and the use of aircraft (Greene 1998; Seddon & Maloney 2004).
Three bird species (South Island kākā, rūrū, and kererū) were identified as suitable candidates for monitoring using radio transmitters. Existing research within the operational area meant that 15 radio-tagged kākā were already available. Monitoring the fate of these individuals could therefore be achieved with little additional effort and would also add substantially to five previous studies (two using carrot baits and three using cereal baits) that have followed the fate of 83 radio-tagged kākā through aerial 1080 operations (Veltman & Westbrooke 2011).
To date, information on the impact of aerial 1080 operations on rūrū populations is minimal with only four small studies and only 16 radio-tagged individuals monitored. These studies revealed only one instance of mortality (Walker 1997) making further monitoring necessary. Using mist nets a
total of 34 rūrū were captured and radio-tagged (Holohil®
RI-2CM transmitters) at three sites (Long Point, Crombie Stream (middle) and Lake Poteriteri Flat) between December 2009 and May 2010. However, only 11 rūrū were known to be alive at the time of the poison operation, due to transmitter failure, predation, and 18 birds dying during a prolonged period of extremely cold weather 2 weeks prior to the operation.
Despite kererū being listed as one of the species for which improved mortality data are required (Veltman & Westbrooke 2011), plans to collect such data during the Waitutu operation were abandoned for ethical and operational reasons. Use of ‘backpack’-type harnesses (Karl & Clout 1987) for attaching transmitters to kererū has been restricted by the Department of Conservation following concerns over instances of harness entanglement and resultant deaths (R. Powlesland, DOC, Wellington, pers. comm.). The only viable alternative for attaching radio transmitters was tail mounts. Use of tail-mounted transmitters means that the maximum life for any transmitter is 12 months depending on the timing of tag attachment and tail feather moult. To prevent transmitter loss prior to the 1080 operation (approved to proceed from early July 2010) birds would have had to be captured (following moult) after April 2010. Kererū density within the operational area is not high (Elliott & Ogle 1985) and their probability of capture is low when feeding in tall canopy trees (Powlesland et al. 2003). We were not confident, therefore, that sufficient numbers of kererū could be caught in the short period prior to the operation.
Sample size and our ability to detect mortality
Our ability to predict the risk of killing birds with 1080 is a function of the size of the sample of radio-tagged birds (Veltman & Westbrooke 2011). Using an ‘exact’ approach we can estimate the likely upper confidence bounds based on a
Clopper-Pearson binomial model (1–α1/n, for confidence level
1-α, and sample size n) assuming no observed mortality or that
it is likely to be extremely rare (Veltman & Westbrooke 2011). Thus, providing that no mortality is observed and that sample size is sufficient (i.e. >10), substantial mortality as a result of possum control could be ruled out for both kākā and rūrū.
Monitoring of radio-tagged kākā and rūrū
be accounted for. Status checks were conducted in 2010 from the ground during field trips in January, February and May as well as on the two bird-counting trips (23–30 July and 14–20 October). Three aerial checks were made also prior to the discharge of 1080 baits, including one check from a helicopter on 3 October 2010, the day before the distribution of toxic baits commenced. Two subsequent flights were made using fixed-wing aircraft (Greene 1998; Seddon & Maloney 2004) to check for dead birds. Any transmitters that were detected in mortality mode were able to be quickly identified and their locations noted. Corpses could then be collected and sent to an independent laboratory for toxicological screening and a full pathological examination to determine cause of death.
Sampling design and survey methods for transect counts
A more complex sampling approach was required for smaller passerine species for which radio transmitters were neither practical nor appropriate. As the Waitutu area is relatively inaccessible, it was impractical to select study sites completely randomly. Choice of sites was determined by available infrastructure (e.g. huts, tracks and marked grids), access (air and river), and the availability and proximity of similar habitats (lowland river flats and terraces) within and adjacent to the operational area. Although there is no obvious bias in selecting sites in this manner, it does limit our ability to generalise beyond the sites selected for monitoring. This means we are comparing specific sites prior to and following 1080 delivery rather than making statements about the impact of 1080 on the Waitutu area as a whole. Five sites were selected for transect counts of small passerines (Fig. 1). Three of these sites were within the operational area – coastal Waitutu, Lake Poteriteri and Crombie Stream – and two in the non-treatment area – Slaughter Burn and Wairere.
Sampling design
To maximise sampling efficiency, area coverage, and encounter rate of small, highly territorial passerines, line transects were distributed systematically with a random start point in all five areas. To improve estimate precision, emphasis was placed on maximising the number of different transects visited rather than repeating visits to a smaller number of transects (Westbrooke et al. 2003). Transect lines were oriented north– south or east–west from established tracks and pre-existing bird survey lines (Lake Poteriteri and coastal Waitutu), or used geographic features such as rivers. Individual transects were 300 m long with intervals of 150 m between each. Lines of transects were spaced 300 m apart. Using this design 46–56 spatially separated transects were available at each of the five study sites (Fig. 1).
Each transect was traversed at least once during each of the pre- and post-1080 monitoring periods. Counts were only conducted in good weather (mild temperatures and minimal wind and rain) and avoided sites overwhelmed with environmental noise (e.g. river noise). Only experienced observers capable of identifying target species (by sight and call) were used. Transects were negotiated during the morning period of peak conspicuousness (between 0830 and 1400 hours) at a slow walk (15–20 min per transect) and all tomtits, grey warblers, riflemen and robins seen or heard were counted.
Results from previously published work using a similar survey approach (Westbrooke et al. 2003; Westbrooke & Powlesland 2005), as well as data derived from existing annual five-minute bird counts in two of the study areas (Lake
Poteriteri and coastal Waitutu), suggested that good numbers of tomtits and grey warblers were likely to be present and able to be detected. For riflemen and robins, however, the numbers encountered were much lower given their much more patchy distribution (TCG, unpubl. data). Existing data suggested that only one or two riflemen and less than one robin per transect (on average) would be counted at the Lake Poteriteri site and less than one rifleman and robin counted at Waitutu. More than a third of transects at Waitutu had no records of riflemen and more than 90% of transects had no records of robins in any of the preceding four years of annual bird counts.
To reduce count variance as much as possible every effort was made to use the same observers for both pre- and post-1080 count periods. Timing of counts and conditions were also matched as far as possible both within and between count periods by covering transects in the same order, at a similar time of day, and by the same observer in comparable weather conditions.
Two, week-long, bird counting sessions were conducted in 2010 in each of the five study areas. The initial count session (23–30 July) was conducted 7 weeks prior to the delivery of non-toxic baits (8–9 September) with the second series of counts (14–20 October) performed 10 days after the application of toxic baits (4–5 October). The 10-day interval between distribution of baits and the second series of counts was largely dictated by the challenges of organising and transporting field teams into isolated areas following a significant weather-related delay. Despite this delay, detection of significant 1080-associated mortality in the bird populations being monitored was unlikely to have been missed.
Analysis of transect count data
Estimates (and their associated confidence intervals; CI) of the changes in the number of birds detected at each site were calculated using the first complete set of counts from all transects before and after the application of toxic baits. Calculation of point estimates with associated CI for the change at each site allows simple visual assessment of any population decreases following the delivery of baits. Because we were primarily interested in population decreases resulting from 1080 impacts, a one-sided analytic approach was selected, using 90% CI (a 90% CI provides the equivalent of a one-sided test of significance at the 5% level) (Westbrooke & Powlesland 2005).
As two of the treatment sites (Crombie and coastal Waitutu) had an adjacent non-treatment site (Wairere and Slaughter Burn respectively), formal assessment of each pair using an unreplicated BACI approach was possible (Underwood 1992, 1994). Each non-treatment site can be directly compared with the paired treatment site by analysing the difference in counts on transects within each site. Point estimates and associated CI can then be calculated for the two case studies and the differences between the treatment and non-treatment sites examined. The inclusion or exclusion of zero difference from the CI provides the equivalent of a test of a null hypothesis of no effect, and the CI will clearly show what effect-sizes are inconsistent with the data gathered.
Annual five-minute bird counts
intervals. At the coastal Waitutu site, data were recorded from approximately 350 points and at Lake Poteriteri approximately 375 points (Fig. 1). Unbounded counts of all birds seen or heard (>90% of detections) within a 5-min period were noted using the five-minute bird count method outlined by Dawson and Bull (1975). Each point was visited only once during a count period. To reduce variation as much as possible the timing of counts was standardised (0830–1400 hours), only experienced observers were used, and the weather conditions under which counts were conducted were made as similar as possible (minimal rain and wind) across all count periods. Multiple counts of individual birds at adjacent points were unlikely as the majority of detections of tomtits, grey warblers and riflemen were within 75 m (birds were recorded as being within or beyond 75 m of the observers) and robins were localised and relatively rare.
Analysis of five-minute bird count data
Count data for kākā, kererū, robins, tomtits, riflemen and grey warblers were summarised by calculating the percentage of count points at the coastal Waitutu and Lake Poteriteri sites at which a given species was encountered. Simple indices of abundance were estimated for these species by calculating the mean number of birds counted at each sample point for each site and computing appropriate 95% CI. Data were also modelled using linear mixed-effect models (Bates et al. 2012) in an attempt to deal with potential temporal correlation of counts between survey periods and factors influencing detection probability such as weather, site covariates, and observer variability (Fox 2008; Nichols et al. 2009; Zuur et al. 2009). Simple linear regression models were then fitted to the count data to give some impression of the overall population trends for these species since 2006.
Results
Pest populations
During this operation possums were reduced by more than 99.5% (Residual Trap-Catch Index of 0.06%). Tracking rates
for rodents (Rattus spp.) and stoats (Mustela erminea) were
reduced to 0% tracking at all four sites within the operational area. At three of these sites (Waitutu, part of Slaughter Burn, and Crombie) tracking rates were still this low 12 months later. However, at the Poteriteri site stoats reappeared briefly in May 2011 (9% tracking) before falling back to a tracking rate of 0%. Similarly, mice were tracked at 1.5% in May and 3% in August 2011. No rats were detected during the 12 months following the 1080 operation (PJD, unpubl. data).
Monitoring radio-tagged kākā and rūrū
All 15 radio-tagged kākā present within the operational area prior to 4 October 2010 were still alive 6 months after the application of toxic baits. The pooled result for kākā in table 2 of Veltman and Westbrooke (2011) can be updated to a sample size of 98 birds from six surveys, and a 95% upper confidence bound for mortality due to 1080 of 3.0% (compared with 3.7% previously). However, 18 of the 31 radio-tagged rūrū known to be alive at the beginning of August were discovered to be on mortality mode during a status check the day before the distribution of toxic baits on 4 October 2010. Ground checks of these birds commencing the next day found that all of these birds had died around 10–14 days earlier. An additional two
rūrū transmitters had failed (intermittent or no detectable signal) leaving only 11 radio-tagged birds known to be alive when 1080 baits were distributed. One of these birds died within 3 days of toxic bait application. This bird was found intact, with no readily observable signs of predation (e.g. bite marks or other wounds), but cached underground on 8 October and autopsied (Massey School of Veterinary Science) and tested for 1080 residues (CENTOX). No traces of 1080 were found.
Transect counts for forest passerines
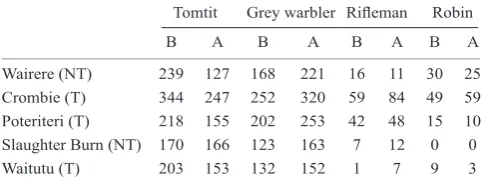
A summary of the raw numbers of tomtits, grey warblers, riflemen and robins counted on the first visit to all transects within each count area before and after the distribution of toxic baits is provided in Table 1. Substantial numbers of tomtits and grey warblers and smaller numbers of riflemen and robins were observed after the operation within both treated and untreated sites. Further detailed analysis provided estimates of the percentage change (and associated confidence intervals) in counts of tomtits, grey warblers, robins and riflemen relative to the pre-operational mean counts for each of the five areas sampled (Fig. 2a, b). Counts of tomtits and grey warblers provide the most interpretable results by virtue of being the most common birds encountered. For riflemen and robins the counts were sparse with too few counted at some sites (particularly robins) to analyse further.
Significant decreases in tomtit counts were observed at four of the five sites (Waitutu, Poteriteri, Crombie and Wairere) with the most marked decline occurring at one of the non-treatment sites (Wairere) (Fig. 2b). However, at the other non-treatment site (Slaughter Burn) little decline in numbers was observed. Comparison of the percentage change in tomtit counts between the two treatment and non-treatment pairs (Fig. 2a) showed
a significant decline (using a one-sided test and P = 0.05 as
the criteria) for one of the pairs (Waitutu–Slaughter Burn) but a significant increase for the other (Crombie–Wairere). In contrast, there was a general pattern of increase in grey warbler counts at all five of the sites and little, if any, evidence of differences between the paired treatment sites. Declines in tomtits and increases in grey warbler numbers following the application of toxic baits were of similar magnitude at both treated and untreated sites. Likewise, counts of riflemen and robins were similar in both treated and untreated sites. There is, therefore, no evidence from these counts for population-level 1080 impacts on any of these species.
Five-minute bird counts
The percentage of sample points at which kākā, kererū, robins, tomtits, riflemen and grey warblers were encountered at the
Table 1. Total birds counted on first visit to all transects
within each study area (NT = non-treatment area and T = area treated with 1080) before (B) and after (A) the application of toxic 1080 baits.
● ● ● ● ● ● ● Tomtit mean Wairere (NT) Crombie (T) Poteriteri (T) Slaughter Burn (NT) Waitutu (T) Crombie(T) Wairere (NT) Waitutu (T) Slaughter Burn (NT)
−40 −20 0 20
● ● ● ● ● ● ● Grey warbler mean Wairere (NT) Crombie (T) Poteriteri (T) Slaughter Burn (NT) Waitutu (T) Crombie(T) Wairere (NT) Waitutu (T) Slaughter Burn (NT)
−40 −20 0 20 40 60
● ● ● ● ● Rifleman mean Wairere (NT) Crombie (T) Poteriteri (T) Slaughter Burn (NT) Waitutu (T) Crombie(T) Wairere (NT) Waitutu (T) Slaughter Burn (NT)
−50 0 50 100 150 200 250
● ● ● ● Robin mean Wairere (NT) Crombie (T) Poteriteri (T) Slaughter Burn (NT) Waitutu (T) Crombie(T) Wairere (NT) Waitutu (T) Slaughter Burn (NT)
−50 0 50 100
Figure 2. Percentage change in transect counts (with bootstrap 90% confidence intervals) from pre-operation means (a) comparing paired
treatment and non-treatment areas and (b) within individual sites for tomtits, grey warblers, riflemen and robins.
0 5 10 15 20 (a) Kereru
Poteriteri Waitutu Poteriteri Waitutu
Year
% of sur
ve
y points in which each species w
as detected
Poteriteri Waitutu Poteriteri Waitutu
Year
% of sur
ve
y points in which each species w
as detected 0 5 10 15 20 (b) Robin
Poteriteri Waitutu Poteriteri Waitutu
Year
% of sur
ve
y points in which each species w
as detected
Poteriteri Waitutu Poteriteri Waitutu
Year
% of sur
ve
y points in which each species w
as detected 0 10 20 30 40 50 60 (b) Kaka
Poteriteri Waitutu Poteriteri Waitutu
Year
% of sur
ve
y points in which each species w
as detected
Poteriteri Waitutu Poteriteri Waitutu
Year
% of sur
ve
y points in which each species w
as detected 0 10 20 30 40 50 60 (d) Rifleman Poteriteri Waitutu Poteriteri Waitutu
Year
% of sur
ve
y points in which each species w
as detected
Poteriteri Waitutu Poteriteri Waitutu
Year
% of sur
ve
y points in which each species w
as detected
2006 2008 2010 0 20 40 60 80 100 (e) Tomtit
Poteriteri Waitutu Poteriteri Waitutu
Year
% of sur
ve
y points in which each species w
as detected
2006 2008 2010
Poteriteri Waitutu Poteriteri Waitutu
Year
% of sur
ve
y points in which each species w
as detected
2006 2008 2010 0 20 40 60 80 100
(f) Grey warbler Poteriteri Waitutu Poteriteri Waitutu
Year
% of sur
ve
y points in which each species w
as detected
2006 2008 2010 Poteriteri Waitutu Poteriteri Waitutu
Year
% of sur
ve
y points in which each species w
as detected
Figure 3. Annual variations in the
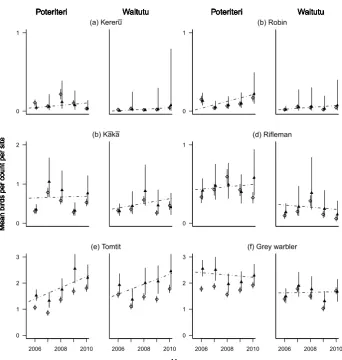
Figure 4. Annual variations in relative abundance (mean number of birds per count ± 95% CI) of kererū, robins, kākā, riflemen, tomtits and grey warblers, derived from raw five-minute bird counts (open diamonds) and generalised linear mixed models (triangles) for November surveys at Poteriteri and Waitutu between 2006 and 2010. Dashed line represents linear trend fitted to the generalised linear mixed models. Application of 1080 baits occurred on 4 and 5 October 2010. Note that the vertical scales change between species.
coastal Waitutu and Lake Poteriteri sites showed considerable inter-annual variation for most species (Fig. 3) and, for some (e.g. kererū, robins and riflemen), considerable differences between the two sites were also noticeable. However, no evidence for declines in distribution attributable to 1080 was apparent. Small declines in distribution between 2009 and 2010 (around 5%) were only detected for riflemen and kererū (at Lake Poteriteri only) and these declines had already commenced following the 2008 counts.
Trends in the indices of relative abundance derived from five-minute bird counts for the same six bird species are very similar to those obtained for encounter rates from Waitutu and Poteriteri (Fig. 4). Neither the indices based on simple means nor those analysed using more complex linear mixed-effect models show any evidence for population declines following the application of 1080 baits. General population trends (based on mixed models) between 2006 and 2010 for these species are generally flat (albeit at very low levels for kākā, kererū, robins and riflemen) or increasing (tomtits). Despite the apparent longer-term decline in grey warblers, an increase in their numbers was recorded from 2009 to 2010 at both Lake Poteriteri and coastal Waitutu.
Dead birds
A dead unbanded rūrū was found during the transect counts 10–14 days after distribution of 1080 baits on the Waitutu grid. This bird was collected then frozen and sent for residue
(a) Kereru
0 1
Poteriteri Waitutu Poteriteri Waitutu
Year
Mean birds per count per site
Poteriteri Waitutu Poteriteri Waitutu
Year
Mean birds per count per site
(b) Robin
0 1
Poteriteri Waitutu Poteriteri Waitutu
Year
Mean birds per count per site
Poteriteri Waitutu Poteriteri Waitutu
Year
Mean birds per count per site
(b) Kaka
0 1 2
Poteriteri Waitutu Poteriteri Waitutu
Year
Mean birds per count per site
Poteriteri Waitutu Poteriteri Waitutu
Year
Mean birds per count per site
(d) Rifleman
0 1
Poteriteri Waitutu Poteriteri Waitutu
Year
Mean birds per count per site
Poteriteri Waitutu Poteriteri Waitutu
Year
Mean birds per count per site
(e) Tomtit
2006 2008 2010 0
1 2 3
Poteriteri Waitutu Poteriteri Waitutu
Year
Mean birds per count per site
2006 2008 2010
Poteriteri Waitutu Poteriteri Waitutu
Year
Mean birds per count per site
(f) Grey warbler
2006 2008 2010 0
1 2 3
Poteriteri Waitutu Poteriteri Waitutu
Year
Mean birds per count per site
2006 2008 2010 Poteriteri Waitutu Poteriteri Waitutu
Year
Mean birds per count per site
testing. Unfortunately the corpse was too decomposed with little available tissue suitable for analysis. A freshly dead
tūī (Prosthemadera novaeseelandiae) found just outside the
treated area near Waitutu Hut was also tested but no 1080 residues were found.
Discussion
Radio-tagged kākā and rūrū
season (TCG & PJD, unpubl. data; Wilson et al. 1998; Dilks et al. 2003; Moorhouse et al. 2003). Thus, the significant reductions in pest numbers observed following the Waitutu 1080 operation are likely to have had a substantial positive impact on populations of kākā and other forest birds within the operational area (Innes et al. 2010).
A total of 27 rūrū have now been monitored through five aerial 1080 possum control operations and only one death attributed to the toxin recorded (Veltman & Westbrooke 2011; this study). Although no radio-tagged rūrū were known to have been poisoned by 1080 in the Waitutu operation, our available sample was significantly reduced by the deaths of at least 18 birds c. 2 weeks before the delivery of toxic baits. The timing of these deaths and the state of decomposition of the recovered corpses strongly suggested the severe weather experienced in Southland between 17 and 24 September 2010 was the cause. The weather for this period was notable for unusually heavy snow, hail and rain, with strong cold southerly winds over a prolonged period. Presumably the availability of prey (invertebrates, birds and rodents) and the ability of rūrū to hunt in such conditions were severely restricted and resulted in the deaths, through starvation and/or hypothermia. There is also evidence to suggest that those birds inhabiting more exposed areas (i.e. coastal Waitutu and Lake Poteriteri) were disproportionately affected (TCG & PJD, unpubl. data). Natural events such as these, however unanticipated and infrequent, do occur and presumably have similar effects even if our ability to document them and assess their magnitude is problematic (Lawton 1997). For example, marked declines of small forest passerines inhabiting forest remnants on the Southland Plain have been recorded previously (Wood 1998),
as have significant declines in mōhua (Mohoua ochrocephala)
numbers in the Eglinton Valley after a particularly severe winter-weather event in July 1996 (Dilks 1999).
The absence of 1080 within the tissues of the single radio-tagged rūrū recovered after the distribution of toxic baits suggests other factors were responsible for this death. Although the corpse appeared to have been cached by a predator, the intact nature of the carcass and the lack of readily observable signs of predation (e.g. bite marks or other wounds) suggest that starvation and/or hypothermia were again likely causes of death and that this was followed by subsequent scavenging of the intact corpse by a predator such as a stoat.
Bird counts of forest passerines
Although the number of grey warblers and tomtits detected (species for which we had sufficient data) did change following the application of toxic baits, the scale and direction of these changes (i.e. decreases for tomtits and increases for grey warblers) was similar for all five sites irrespective of their treatment or non-treatment status. This strongly suggests that factors other than the distribution of 1080 baits were responsible for the observed changes between the two count periods.
Although the two paired treatment and non-treatment blocks (i.e. coastal Waitutu –Slaughter Burn and Crombie Stream – Wairere) were separated only by the Waitutu and Wairaurahiri rivers, it is unlikely site proximity could have blurred detection of any 1080 impact. Tomtits, grey warblers, riflemen and robins are all small, highly territorial insectivores and are unlikely to have moved or dispersed between adjacent sites immediately prior to or during the commencement of breeding activity in the period between pre- and post-1080 counts.
The transect count method we have applied relies on the assumption that the derived index for tomtits and grey warblers (and probably riflemen and robins) is capable of providing consistent estimates of the number of birds present over the time frame being compared (an assumption common to all indices of abundance). Despite our attempts to standardise count conditions and minimise variation as much as possible, the unavoidably long interval (>2.5 months) between the two sets of counts (caused by weather-related operational delays in bait distribution) meant differences in detectability were inevitable. Seasonal variability in calling rates related to the onset of breeding activity and subsequent changes in detectability of both tomtits and grey warblers were particularly noticeable (tomtits becoming less vocal and grey warblers more so) between the pre- and post-poison counts. It is also highly likely that the same weather event that impacted rūrū survival had an effect on the survival of small forest-dwelling passerines and further compromised our ability to detect and assess small changes in population size resulting from the distribution of 1080 baits. Despite this, there was no evidence for 1080-induced mortality in the transect counts of tomtits, grey warblers, riflemen and robins throughout the operational area. Results from the annual five-minute bird counts conducted at two sites within the operational area since 2006 showing little difference or increases in species’ relative abundances between 2009 and 2010 further reinforce this view.
In conclusion, this study did not detect any evidence for 1080-related mortality at either an individual or population level for the bird species monitored. Significant numbers of radio-tagged kākā have now been monitored through several 1080 operations and no evidence for toxin-related mortality has occurred. It is also clear that the substantial reduction in numbers of possums, stoats and rodents following the application of 1080 coinciding with a subsequent kākā breeding season greatly improved adult survival, nesting success, and fledgling survival. The risk to rūrū posed by aerial 1080 operations is less clear as it is based on limited sample sizes, and we therefore recommend further monitoring of radio-tagged rūrū, particularly in areas where the rodent numbers are high and are likely to form a significant part of their diet.
Given the relatively long interval between the two sets of transect counts for passerines, the inconclusive and somewhat contradictory nature of these results was not particularly surprising. Such counts, no matter how well designed, will always be sensitive to significant operational delays caused by the weather. However, despite observed changes in behaviour and detectability, it was clear that the bird species monitored in this way were still common following the distribution of baits, with no evidence of impact from 1080. Indeed, the increased numbers of birds counted in the November five-minute bird counts suggest that aerial 1080 may have resulted in improvements to the survival, nesting success, and/or recruitment of forest passerines.
Acknowledgements
We thank Mitch Bartlett, Phred Dobbins, Ray Molloy, Rose Collen, Lynette Hartley, Pete Gaze, Helen Clarke, Iris Jacobs, Paul Jacques, Jo Whitehead and Jack van Hal for assistance in the field and putting their lives on hold for the duration of the operation. We are also indebted to Colin Bishop and other Southland Conservancy DOC staff for getting the job done and their continued interest and support of this project. Special thanks to the trustees of the Waitutu Incorporation for allowing us access to their land and to the teams at Wairaurahiri Jet and Alpine Choppers for getting us there and back safe and sound. Aerial radio-tracking was carried out with the assistance of Fiordland Helicopters and Stewart Island Flights. We also thank Brenda Greene, John Innes, Eric Spurr and Jo Hoare for helpful comments on earlier drafts.
References
Allan Herbarium 2000. Ngā Tipu o Aotearoa – New Zealand Plants. – Landcare Research database, New Zealand. http://nzflora.landcareresearch.co.nz (accessed September 2012).
Armstrong DP, Perrott JK, Castro I 2001. Estimating impacts of poison operations using mark-recapture analysis: hihi (Notiomystis cincta) on Mokoia Island. New Zealand Journal of Ecology 25(2): 49–54.
Bates D, Maechler M, Bolker B 2012. lme4: Linear mixed-effects models using S4 classes. R package version 0.999999-0. http://CRAN.R-project.org/package=lme4 (accessed 2011).
Coleman JD, Fraser KW, Nugent G 2007. Costs and benefits of pre-feeding for possum control. New Zealand Journal of Zoology 34: 185–193.
Dawson DG, Bull PC 1975. Counting birds in New Zealand forests. Notornis 22: 101–109.
Dilks P 1999. Recovery of a Mohua (Mohoua ochrocephala)
population following predator control in the Eglinton Valley, Fiordland, New Zealand. Notornis 46: 323–332.
Dilks P, Willans M, Pryde M, FraserI 2003. Large scale stoat
control to protect mohua (Mohoua ochrocephala) and kaka
(Nestor meridionalis) in the Eglinton Valley, Fiordland, New Zealand. New Zealand Journal of Ecology 27: 1–9. Eason C, Miller A, Ogilvie S, Fairweather A 2011. An updated
review of the toxicology and ecotoxicology of sodium fluoroacetate (1080) in relation to its use as a pest control tool in New Zealand. New Zealand Journal of Ecology 35: 1–20.
Elliott GP, Ogle CC 1985. Wildlife and wildlife habitat values of Waitutu Forest, western Southland. Fauna Survey Unit Report 39. Wellington, New Zealand Wildlife Service. 108 p.
Fox J 2008. Applied regression analysis and generalized linear models. 2nd edn. Los Angeles, CA, Sage. 665 p. Greene TC 1998. The effects of compound 1080 on populations
of specific non-target species, Waihaha Ecological Area, Pureora Forest Park, winter 1994. Science for Conservation 69. Wellington, Department of Conservation. 54 p. Innes J, Barker G 1999. Ecological consequences of toxin
use for mammalian pest control in New Zealand – an overview. New Zealand Journal of Ecology 23: 111–127. Innes J, Kelly D, Overton JMcC, Gillies C 2010. Predation
and other factors currently limiting New Zealand forest
birds. New Zealand Journal of Ecology 34: 86–114. Karl BJ, Clout MN 1987. An improved radio transmitter
harness with a weak link to prevent snagging. Journal of Field Ornithology 58: 73–77.
Kenward RE 2001. A manual for wildlife radio tagging. Rev. edn. London, Academic Press. 311 p.
Lawton JH 1997. The science and non-science of conservation. New Zealand Journal of Ecology 21: 117–120.
Mark AF, Grealish G, Ward CM, Wilson JB 1988. Ecological studies of a marine terrace sequence in the Waitutu Ecological District of southern New Zealand. Part 1: The vegetation and soil patterns. Journal of the Royal Society of New Zealand 18: 29–58.
Millspaugh JJ, Marzluff JM eds 2001. Radio tracking and animal populations. San Diego, CA, Academic Press. 474 p.
Miskelly CM, Dowding JE, Elliott GP, Hitchmough RA, Powlesland RG, Robertson HA, Sagar PM, Scofield RP, Taylor GA 2008. Conservation status of New Zealand birds, 2008. Notornis 55: 117–135.
Moorhouse R, Greene T, Dilks P, Powlesland R, Moran L, Taylor G, Jones A, Knegtmans J, Wills D, Pryde M, Fraser I, August A, August C 2003. Control of introduced
mammalian predators improves kaka Nestor meridionalis
breeding success: reversing the decline of a threatened New Zealand parrot. Biological Conservation 110: 33–44. Nicholls JL 1976. Forest types of Waitutu State Forest and
adjoining areas. New Zealand Journal of Forestry 21: 215–228.
Nichols JD, Thomas L, Conn PB 2009. Inferences about landbird abundance from count data: recent advances and future directions. In: Thomson DL, Cooch EG, Conroy MJ eds Modeling demographic processes in marked populations. Environmental and Ecological Statistics 3. New York, Springer. Pp. 201–235.
NPCA 2011. Code A1: Possum population monitoring using the trap-catch method. Wellington, National Pest Control Agencies. 38 p. www.npca.org.nz
Pekelharing CJ, Batcheler CL 1990. The effects of control of
brushtail possums (Trichosurus vulpecula) on condition
of a southern rata/kamahi (Metrosideros umbellata/
Weinmannia racemosa) forest canopy in Westland, New Zealand. New Zealand Journal of Ecology 13: 73–82. Pekelharing CJ, Parkes JP, Barker RJ 1998. Possum
(Trichosurus vulpecula) densities and impacts on fuchsia (Fuchsia excorticata) in South Westland, New Zealand. New Zealand Journal of Ecology 22: 197–203.
Powlesland R, Knegtmans J, Marshall I 1998. Evaluating the impacts of 1080 poison control operations on North Island robins, North Island tomtits and moreporks at Pureora – preliminary results. Science for Conservation 74. Wellington, Department of Conservation. 23 p. Powlesland RG, Knegtmans JW, Marshall ISJ 1999. Costs and
benefits of aerial 1080 possum control operations using
carrot baits to North Island robins (Petroica australis
longipes), Pureora Forest Park. New Zealand Journal of Ecology 23: 149–159.
Powlesland RG, Knegtmans JW, Styche A 2000. Mortality
of North Island tomtits (Petroica macropcephala toitoi)
caused by aerial 1080 possum control operations, 1997-98, Pureora Forest Park. New Zealand Journal of Ecology 24: 161–168.
and nesting success, Whirinaki Forest Park. New Zealand Journal of Ecology 27: 125–137.
Seddon PJ, Maloney RF 2004. Tracking wildlife radio-tag signals by light fixed-wing aircraft. Department of Conservation Technical Series 30. Wellington, Department of Conservation. 23 p.
Southey I 2000. The threatened birds of Southern Fiordland and Waitutu: A review of their status and future management options. Unpublished report, available from the Department of Conservation, Southland Conservancy, Invercargill. 42 p.
Spurr EB 1991. Effects of brushtail possum control operations on non-target bird populations. Acta XX Congressus Internationalis Ornithologici 4: 2534–2545.
Spurr EB 2000. Impacts of possum control on non-target species. In: Montague TL ed. The brushtail possum: biology, impact and management of an introduced marsupial. Lincoln, Manaaki Whenua Press. Pp. 175–186. Spurr EB, Powlesland RG 1997. Impacts of aerial application
of 1080 on non-target native fauna: Review and priorities for research. Science for Conservation 62. Wellington, Department of Conservation. 31 p.
Sweetapple PJ, Nugent G 2007. Ship rat demography and diet following possum control in a mixed podocarp–hardwood forest. New Zealand Journal of Ecology 31: 186–201. Underwood AJ 1992. Beyond BACI: the detection of
environmental impacts on populations in the real, but variable, world. Journal of Experimental Marine Biology and Ecology 161: 145–178.
Underwood AJ 1994. On Beyond BACI: sampling designs that might reliably detect environmental disturbances. Ecological Applications 4: 3–15.
Veltman CJ, Westbrooke IM 2011. Forest bird mortality and baiting practices in New Zealand aerial 1080 operations from 1986 to 2009. New Zealand Journal of Ecology 35: 21–29.
Walker K 1997. Effect of aerial distribution of 1080 for possum control on weka, great spotted kiwi, morepork and fernbird. Ecological Management 5: 29–37.
Warburton B, Clayton R, Nugent G, Graham G, Forrester G 2009. Effect of prefeeding on foraging patterns of brushtail
possums (Trichosurus vulpecula) about prefeed transects.
Wildlife Research 36: 659–665.
Ward CM 1988. Marine terraces of the Waitutu district and their relation to the late Cenozoic tectonics of the southern Fiordland region, New Zealand. Journal of the Royal Society of New Zealand 18: 1–28.
Westbrooke IM, Powlesland RG 2005. Comparison of impact
between carrot and cereal 1080 baits on tomtits (Petroica
macrocephala). New Zealand Journal of Ecology 29: 143–147.
Westbrooke IM, Etheridge ND, Powlesland RG 2003. Comparing methods for assessing mortality impacts of
an aerial 1080 pest control operation on tomtits (Petroica
macrocephala toitoi) in Tongariro Forest. New Zealand Journal of Ecology 27: 115–123.
Wilson PR, Karl BJ, Toft RJ, Beggs JR, Taylor RH 1998. The role of introduced predators and competitors in the
decline of Kaka (Nestor meridionalis) populations in
New Zealand. Biological Conservation 83: 175–185. Wood J 1998. The effects of an abnormally cold winter spell
on Southland birds. Notornis 45: 126–128.
Zuur AF, Ieno EN, Walker NJ, Saveliev AA, Smith GM 2009. Mixed effects models and extensions in ecology with R. 1st edn. New York, Springer. 574 p.
Editorial Board member: Joanne Hoare