H el b r e n , E m m a , H a lli g a n , S t e v e , P h illip s , P e t er, Bo o n e , D a r r e n ,
F a n s h a w e , T h o m a s R., Taylor, S t u a r t A., M a n n i n g , D avi d J., G al e ,
Ala s t air, Alt m a n , Do u gl a s G. a n d M all e t t , S u s a n ( 2 0 1 4 ) Tow a r d s
a fr a m e w o r k fo r a n a ly si s of e y e-t r a c ki n g s t u d i e s in t h e t h r e e
d i m e n si o n al e n vi r o n m e n t : a s t u d y of vis u al s e a r c h b y
e x p e r i e n c e d r e a d e r s of e n d ol u mi n al CT c olo n o g r a p hy. B ri tis h
Jo u r n al of R a d i olo gy, 8 7 ( 1 0 3 7 ).
Do w n l o a d e d fr o m : h t t p ://i n si g h t . c u m b r i a . a c . u k /i d/ e p ri n t/ 1 6 7 0 /
U s a g e o f a n y i t e m s f r o m t h e U n i v e r s i t y o f C u m b r i a’ s i n s t i t u t i o n a l r e p o s i t o r y ‘I n s i g h t ’ m u s t c o n f o r m t o t h e f o l l o w i n g f a i r u s a g e g u i d e l i n e s .
Any it e m a n d it s a s s o ci a t e d m e t a d a t a h el d i n t h e U niv e r si ty of C u m b r i a ’s in s ti t u ti o n al r e p o si t o r y I n si g h t ( u nl e s s s t a t e d o t h e r wi s e o n t h e m e t a d a t a r e c o r d ) m a y b e c o pi e d , di s pl ay e d o r p e rf o r m e d , a n d s t o r e d i n li n e wi t h t h e JIS C f ai r d e a li n g g ui d eli n e s ( av ail a bl e
h e r e) fo r e d u c a t i o n al a n d n o t-fo r-p r ofi t a c tiviti e s
p r o v i d e d t h a t
• t h e a u t h o r s , ti tl e a n d full bi blio g r a p h i c d e t ail s of t h e it e m a r e ci t e d cl e a rly w h e n a n y p a r t
of t h e w o r k is r ef e r r e d t o v e r b a lly o r i n t h e w ri t t e n fo r m
• a h y p e rli n k/ U RL t o t h e o ri gi n al I n si g h t r e c o r d of t h a t it e m is i n cl u d e d i n a n y ci t a ti o n s of t h e w o r k
• t h e c o n t e n t is n o t c h a n g e d i n a n y w a y
• all fil e s r e q ui r e d fo r u s a g e of t h e it e m a r e k e p t t o g e t h e r wi t h t h e m a i n it e m fil e.
Yo u m a y n o t
• s ell a n y p a r t of a n it e m
• r e f e r t o a n y p a r t of a n it e m wi t h o u t ci t a ti o n
• a m e n d a n y it e m o r c o n t e x t u ali s e it i n a w a y t h a t will i m p u g n t h e c r e a t o r ’s r e p u t a t i o n
• r e m ov e o r a l t e r t h e c o py ri g h t s t a t e m e n t o n a n it e m .
T h e full p oli cy c a n b e fo u n d h e r e.
Alt e r n a t iv ely c o n t a c t t h e U niv e r si t y of C u m b ri a R e p o si t o ry E di t o r b y e m a ili n g
Received:
26 September 2013
Revised:
16 January 2014
Accepted:
17 February 2014
doi: 10.1259/bjr.20130614
Cite this article as:
Helbren E, Halligan S, Phillips P, Boone D, Fanshawe TR, Taylor SA, et al. Towards a framework for analysis of eye-tracking studies in the three dimensional environment: a study of visual search by experienced readers of endoluminal CT colonography. Br J Radiol 2014;87:20130614.
FULL PAPER
Towards a framework for analysis of eye-tracking studies in
the three dimensional environment: a study of visual search
by experienced readers of endoluminal CT colonography
1E HELBREN,MRCS, FRCR,1S HALLIGAN,FRCP, FRCR,2P PHILLIPS,PhD,1D BOONE,MRCS, FRCR,3T R FANSHAWE,PhD, 1S A TAYLOR,MRCP, FRCR,4D MANNING,DSc,5A GALE,PhD,6D G ALTMAN,DScand3S MALLETT,DPhil
1Centre for Medical Imaging, University College London, London, UK 2Health and Medical Sciences Group, University of Cumbria, Lancaster, UK
3Nuffield Department of Primary Care Health Sciences, University of Oxford, Oxford, UK 4School of Medicine, Lancaster University, Lancaster, UK
5Applied Vision Research Centre, Loughborough University, Loughborough, UK 6Centre for Statistics in Medicine, University of Oxford, Oxford, UK
Address correspondence to:Professor Steve Halligan
E-mail:[email protected]
Objective:Eye tracking in three dimensions is novel, but established descriptors derived from two-dimensional (2D) studies are not transferable. We aimed to develop metrics suitable for statistical comparison of eye-tracking data obtained from readers of three-dimensional (3D) “virtual”medical imaging, using CT colonography (CTC) as a typical example.
Methods:Ten experienced radiologists were eye tracked while observing eight 3D endoluminal CTC videos. Sub-sequently, we developed metrics that described their visual search patterns based on concepts derived from 2D gaze studies. Statistical methods were developed to allow analysis of the metrics.
Results:Eye tracking was possible for all readers. Visual dwell on the moving region of interest (ROI) was defined as pursuit of the moving object across multiple frames. Using this concept of pursuit, five categories of metrics
were defined that allowed characterization of reader gaze behaviour. These were time to first pursuit, identi-fication and assessment time, pursuit duration, ROI size and pursuit frequency. Additional subcategories allowed us to further characterize visual search between readers in the test population.
Conclusion:We propose metrics for the characterization of visual search of 3D moving medical images. These metrics can be used to compare readers’visual search patterns and provide a reproducible framework for the analysis of gaze tracking in the 3D environment.
Advances in knowledge:This article describes a novel set of metrics that can be used to describe gaze behaviour when eye tracking readers during interpretation of 3D medical images. These metrics build on those established for 2D eye tracking and are applicable to increasingly common 3D medical image displays.
Eye tracking is widely used in both medical and com-mercial settings to assess patterns of visual search. In radiological settings, eye tracking has been used to inves-tigate visual search patterns associated with medical image interpretation. The majority of such work has focused on two-dimensional (2D) medical image displays, such as plain radiographicfilm, mammography and stacked 2D CT series.1–3 Metrics such as “time to first hit” and “dwell time”are well-established measurements used to compare the performance of different observers.2,4–6However, it is now increasingly common for radiologists to interpret three-dimensional (3D) medical images, considerably com-plicating the perceptive task. Multiplanar imaging, 3D
demand patterns of visual search that are more complex than those associated with the interpretation of 2D dis-plays. In particular, the 3D image is often moving and so gaze strategies are more akin to looking at a“video”than at a static image.
examinations, we aimed to develop a range of measurements intended to allow investigation of visual search, recognition and decision making in the 3D environment. Our intention was to propose a comprehensive framework of metrics suitable for application in the 3D paradigm that builds on previous initial work.7
METHODS AND MATERIALS
Institutional review board approval was granted to use anony-mized CTC data for eye tracking collected during two prior studies,8,9 and to obtain eye-tracking data from volunteer readers. All readers gave informed written consent, and all data generated were anonymized.
Video preparation
Eight endoluminalfly-though videos, each of 20 s duration, were recorded from 3D CTC fly-through examinations viewed on a Viatronix® V3D colon imaging workstation (Viatronix Inc., Stony Brook, NY). Patient cases were selected from a bank of CTC studies used for previous research related to interpretation of CTC by both experienced and novice readers.8,9 Studies in-cluded those from symptomatic and asymptomatic patients accrued from four US and three European centres. All studies had both prone and supine acquisitions following full bowel purgation and colonic insufflation. A reference truth as to the location and size of polyps on each patient case had been established previously by three radiologists experienced in CTC interpretation, in consensus and with the aid of the original radiological reports and of endoscopic correlation.
Cases were selected to obtain a subset of videos that were neither
“too easy”nor“too difficult”to interpret. Consulting data from the previous reader studies, 20 cases were obtained in which a false-negative or -positive diagnosis of a polyp had been made previously by approximately 50% of experienced readers. Cases were then reviewed by a radiologist (DB) with experience of .500 endoscopically validated cases and excluded if the target polyp could not be demonstrated on either endoluminal pro-jection or if it was within 5 s navigation of the rectal ampulla or caecal pole during endoluminal fly through. Where the polyp was visible in both prone and supine acquisitions, the least conspicuous view was selected. Five videos with true-positive polyps (with diameters of 6, 8, 11, 12 and 25 mm) were selected. Three videos with prior false-positive polyps (with diameters of 5, 7 and 10 mm) were also selected to provide true- and false-positive lesions in a 2:1 ratio.
Readers
We collected eye-tracking data from ten experienced readers who were the teaching faculty at a CTC“hands-on”workshop (ESGAR Amsterdam workshop, April 2010). “Experienced readers”were defined as radiologists who had previously inter-preted.300 CTC studies independently. All readers were un-aware of the prevalence of abnormality prior to viewing, and no feedback was given regarding their diagnostic performance.
Eye tracking
An infrared eye tracker (Tobii X50®; Tobii Technology, Danderyd, Sweden) was positioned beneath the viewing screen, and Studio™
capture software (Tobii Technology) was hosted on a laptop. Eye-tracking accuracy was 0.5° and 20 screen pixels at approx-imately 60 cm viewing distance. The video area was 5123512 pixels. Eye tracking was overseen by an image perception sci-entist (PP) with 8 years of experience.
Videos were viewed during the workshop, in a quiet area of a reporting room that was specifically designated for this study. Following afive-point calibration exercise, a “warm-up” video was used to assess the ability of the eye tracker to obtain suffi -cient data and to familiarize readers with the procedure. Readers wore glasses/contact lenses as per normal. Each reader held a computer mouse prior to commencing each video. The fol-lowing instructions were then displayed onscreen: “You are about to be shown some short video clips offly-throughs. Some will have pathology and some will not. Please click the mouse when you see a lesion which you consider highly likely to rep-resent a real polyp or cancer”. Readers were told to click once for each lesion.
The eight videos were then presented to readers in a randomized order. Readers took approximately 10 min to complete the set-up described above and to view all videos. Eye-tracking data and number/timing of mouse clicks were recorded for all ten readers viewing all eight videos. Readers were not required to target any polyp with the mouse; they simply clicked to indicate their belief that pathology might be present on the 3Dfly through.
Data preparation and display
Following data collection, a circular region of interest (ROI) was applied around the polyp on each individual video frame where the polyp (true- and false-positive) was visible. This was then related to the readers’ gaze for each individual frame by calcu-lating the distance from the gaze point to the closest ROI boundary point for each point of gaze data acquired during the time the polyp was onscreen. Gaze points recorded within 50 pixels beyond the outer rim of the ROI were considered to havefixed upon the polyp to ensure that all gaze directed at the polyp was captured. This represented a 1.25° visual acceptance radius,7 where the ROI boundary fell within very high visual acuity.10For each reader, the distance from the gaze point to the ROI boundary was plotted against time, for the duration that any polyp was onscreen, and included the identification time (mouse click), if any. A representative graph is displayed inFigure 1.
Statistical analysis
Eye pursuits were defined when within 50 pixels from the polyp ROI boundary and lasting for at least 100 ms. Missing data were imputed using multiple imputation methods11 adapted for longitudinal data. A pursuit distance.50 pixels was character-ized as a pursuit termination, provided that (to allow for mea-surement error) either the average pursuit distance of four to six near-contemporaneous gaze points was.50 pixels or the ob-served pursuit distance was more than two standard deviations of measurement error greater than the average pursuit distance within that pursuit. Gaze metrics were defined as in Figure 1 (time tofirst pursuit corresponding to A to B; overall assessment time A to E); pursuit time being total time within a 50-pixel distance from the ROI boundary. For each metric, data sets with
BJR E Helbrenet al
either.50% missing data or at least 1 block of 50 consecutive missing observations were examined to identify the values that would be unreliable and should be excluded from the analysis.
For metrics that measured time to an event,e.g. time to first pursuit, the event was censored if the event did not occur and was truncated at the time point when the event was no longer possible. For eye pursuits, the censor time was defined as oc-curring when the ROI was no longer visible (i.e.when the polyp left the screen), and at 500 ms after this for events involving time of ROI identification. Data were analysed using STATA® 12 (StataCorp, College Station, TX). Median and interquartile ranges (IQRs) were calculated to summarize percentage assessment pursuit time across readers and cases.
RESULTS
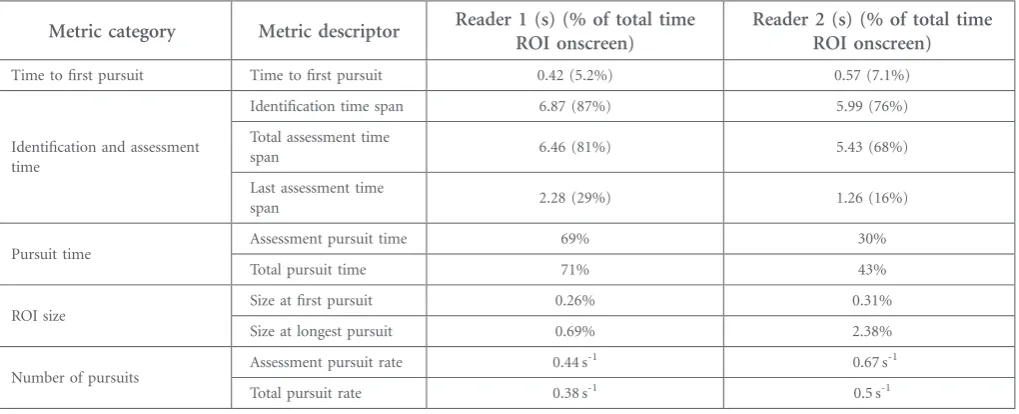
For clarity, metrics are defined by referring to one reader’s eye tracking of a visible ROI in a single video (Figure 1). Addi-tionally,Table 1details two readers viewing the same video with corresponding gaze graphs inFigure 2; this demonstrates how search varies between readers and how the metrics reflect this.
Pursuit
We defined “pursuit” as a consecutive contiguous gaze point related to the ROI (i.e.within a boundary distance of 50 pixels) and lasting for 100 ms or longer.
Time to first pursuit
Since“time tofirst fixation” is a commonly used outcome for 2D, we defined “time to first pursuit”as the time elapsing be-tween the first onscreen appearance of the ROI and com-mencement of first pursuit, if any (Figure 1). Both readers pursued the polyp soon after it became visible (at 0.42 and 0.57 s), both within 10% of the total onscreen time.
Identification and assessment time
To distinguish different components of identification and de-cision time, we defined the following three features and extracted them from the gaze data, in seconds and milliseconds (Table 1,Figure 1):
•
Identification time span: time elapsing betweenfirst onscreen appearance of the ROI and the time of polyp identification (if any) by the reader (represented by the mouse click); time A to D onFigure 1.•
Total assessment time span: time fromfirstfixation on the ROI (if any) to identification by the reader; time B to D on Figure 1.•
Last assessment time span: time from commencement of the ROIfixation immediately preceding identification to the time of identification; time C to D onFigure 1.A reaction time of 500 ms was included to capture mouse clicks occurring very soon after the polyp left the screen.
Pursuit time
We identified two different components of pursuit time. We expressed both as a percentage of the total onscreen time during the periods described:
•
Assessment pursuit time: the aggregated time for individual pursuits (if any) occurring prior to polyp identification; the summed length of the horizontal bars onFigure 1prior to the mouse click.•
Total pursuit time: the aggregated time for individual pursuits (if any) occurring for the total onscreen time of the ROI (i.e.including pursuits occurring after identification); the summed length of the horizontal bars onFigure 1.Region of interest size
We expressed the size of the ROI as a percentage of visible video area at crucial points during reader gaze as follows:
•
size atfirst pursuit: B onFigure 1•
size at longest pursuit: C onFigure 1.Readers pursued polyps at relatively small sizes, as a percentage screen area; 0.26% and 0.31% at thefirst pursuit and 0.69% and 2.38% at the longest pursuit. In our example video, the largest polyp size is 8.54%, indicating that both the first and longest pursuits were at relatively small polyp sizes. The polyp size when readers clicked was much larger, at 2.90% and 7.10%.
Pursuit frequency
We identified two different components of pursuit frequency expressed as the rate of pursuits per second. This facilitated comparison across videos where onscreen ROI time will vary. Figure 1. The graph shows the distance in pixels (y-axis)
•
Assessment pursuit rate: the rate of individual pursuits (if any) occurring prior to the point of polyp identification; the number of individual horizontal bars per second onFigure 1 prior to the mouse click.•
total pursuit rate: the rate of individual pursuits (if any) occurring for the total onscreen time of the ROI (i.e.including pursuits occurring after identification); the number of individual horizontal bars per second onFigure 1.Analysis of metrics across readers
The total time the ROI was visible varied from 2.47 to 8.87 s, with a median of 5.73 s (IQR, 3.05–7.93 s). Some metrics were highly dependent on the time the polyp was onscreen. Accord-ingly, some metrics were expressed as a percentage of total onscreen time. To illustrate the power of these metrics to
summarize visual search patterns across readers and cases, we present results that assess pursuit time across all ten readers and eight videos: the median assessment pursuit time was 43% (IQR, 23–53%).
DISCUSSION
When viewing an image, features of interest are brought into the centre of field of view via “foveal fixation”, providing the sharpest visual detail in the region of conscious attention. Multiplefixations (“spatial clustering”) imply a feature of par-ticular interest. It is relatively straightforward to record the lo-cation and duration of foveal fixations for 2D medical images.5,12 By contrast, when images are moving, we fix and follow objects using rotational eye movements to stabilize the fovea on the target. Because both the image and the location of Table 1. Metrics applicable to eye tracking of three dimensional moving studies
Metric category Metric descriptor Reader 1 (s) (% of total time ROI onscreen)
Reader 2 (s) (% of total time ROI onscreen)
Time tofirst pursuit Time tofirst pursuit 0.42 (5.2%) 0.57 (7.1%)
Identification and assessment time
Identification time span 6.87 (87%) 5.99 (76%)
Total assessment time
span 6.46 (81%) 5.43 (68%)
Last assessment time
span 2.28 (29%) 1.26 (16%)
Pursuit time Assessment pursuit time 69% 30%
Total pursuit time 71% 43%
ROI size
Size atfirst pursuit 0.26% 0.31%
Size at longest pursuit 0.69% 2.38%
Number of pursuits
Assessment pursuit rate 0.44 s-1 0.67 s-1
Total pursuit rate 0.38 s-1 0.5 s-1
ROI, region of interest.
Metric values are presented for two readers reading the same video, corresponding to the gaze graphs inFigure 2.
Figure 2. Gaze graphs for two readers demonstrating the differing visual search characteristics that can be seen when viewing the same video. Metric values for the same readers are summarized inTable 1.
BJR E Helbrenet al
anyfixed feature change frame by frame, and the nature of eye movements involved is different, the simplex, y co-ordinates and“heat maps”(forfixation duration) used to represent visual search in 2D images can no longer be applied. Using CTC as an example of the 3D medical imaging paradigm, we sought to develop a comprehensive range of metrics intended to facilitate investigation of visual search, recognition and decision making in the 3D environment, building on recent preliminary descriptions by our group.7By relating gaze to an ROI in terms of proximity and time, we derived a set of metrics applicable to a wide range of 3D imaging paradigms, basing these on parameters already established for 2D studies. We considered the unique qualities of the 3D environment, e.g. feature variation between individual frames (expressed via metrics describing the ROI size), and the time-dependent nature of the viewing task. Time pressure is irrelevant for static images, and the location and nature of background features are also constant. Care was taken so that our metrics were potentially applicable to readers of all experience and would extend to studies using different software and eye-tracking systems.
In 2D gaze tracking, a“hit”occurs when readers gaze at lesions directly for a specified minimum time period. Spatial clustering offixation points over a static ROI is known as“dwell time”and their individual summation as “cumulative dwell”. In 3D gaze tracking, readers’ eyes must follow the ROI across the screen. Assessment is then reflected by time spent“pursuing”the ROI, which we propose as the 3D surrogate of 2D dwell time. We defined pursuit as when readers’uninterrupted gaze was within a moving ROI boundary for 100 ms or more. In 2D, the number offixation clusters associated with an ROI has been shown to correlate with identification of true-positive lesions.4 We were able to identify the number of individual pursuits in 3D and measure their individual and summated duration, with the ex-pectation that this could examine any relationship between re-peat pursuits and lesion identification in future studies. It is possible that the time-limited nature of lesion identification in 3D will enhance the importance of such metrics.
Many 2D eye-tracking studies allow readers to control the total time an image is displayed and viewed. In our study, readers could not control display time, since polyps appeared on the screen and disappeared subsequently at pre-determined points. Infly-through 3D, the observer does not change case once a le-sion has been detected nor can he/she eliminate a lele-sion from view once it has been characterized. It is therefore desirable to separate pursuit frequency and times into those that occur before and after lesion identification. We achieved this using a mouse click. Pursuits prior to any click are probably related to lesion recognition and decision. Not all viewers will identify an abnormality as such, so we believe a metric that reflects total pursuit time when they occur, while the ROI is on-screen, is important. Alternatives to a click, such as verbal response, are possible.
Time to identify an onscreen lesion was considered to reflect both “viewing time”, as for 2D studies, as well as providing insight regarding visual search. Unlike 2D, where viewing time essentially terminates interrogation, noting “decision
time”in 3D allows the observer to indicate that a lesion has been identified and to then continue searching for further abnormalities present in the remaining video. If no abnor-mality is apparent elsewhere, the observer may return to pursue an abnormality already identified. The mouse click allowed us to separate pursuits relating to search and de-tection. A marker of lesion identification distinct from pur-suit was also necessary, because it is possible that experienced readers may perceive abnormalities via peripheral vision, without formal pursuit. This is particularly important where moving images are concerned.
Whereas lesions remain unchanged in size and location in 2D, 3D necessitates a complex ROI that changes in size and po-sition frame by frame. We therefore hypothesized that the ROI size (in pixels) at time offirst pursuit, and immediately prior to identification, will aid understanding of 3D percep-tion. Experienced readers might pursue and identify smaller ROIs than would novices or, alternatively, they might ap-preciate that resolution is maximal when a potential abnor-mality reaches the image foreground (i.e. just prior to it leaving the screen). This might delay identification time to extract maximal visual information. We were mindful that our methods should be transferable; an ROI can be created for different and complex lesion morphologies.
Our study has limitations. We investigated endoluminal fly through in automatic mode. In clinical practice, readers can adjust navigation speed and also stop to inspect potential abnormalities. A circular ROI was convenient; we adjusted the diameter to represent change in the polyp size over time of approach. However, irregular polyps and those seen in the profile are more difficult to characterize in this way. Boundary accuracy could be improved via more representative descriptions but this will increase complexity. The 50-pixel threshold was constant for all polyps, which may have entailed distant polyps being defined as “seen” too early. Possible perceptual errors would then be classified as recog-nition errors. A threshold based on afixed proportion of the ROI would have the opposite effect. Future thresholds should account for all polyp sizes. We investigated only experienced readers, since our aim was simply to derive a set of metrics applicable to 3D gaze tracking; ultimately, we believe that these metrics will facilitate comparisons between experienced and inexperienced readers that might reveal factors associated with correct lesion detection that can be used to inform training schedules. For example, we have found that time to
used to increase polyp sensitivity for CTC. We present only one metric summarized across all readers and cases. Future work will use multilevel analyses accounting for clustering of data within readers and cases, hence allowing use of time-to-event survival analysis and count data.
In summary, we propose a comprehensive range of metrics applicable to studies of eye tracking in the 3D paradigm, where potential lesions are both moving and changing in size. We believe these metrics provide a reproducible framework to in-vestigate 3D visual search and are potentially applicable to a wide range of research studies performed in this new, exciting environment. These metrics should facilitate identification of factors related to expertise in interpretation of 3D medical images.
ACKNOWLEDGMENTS
The authors are grateful to all of the participants.
CONFLICTS OF INTERESTS
The views expressed are those of the authors and not necessarily those of the NHS, the NIHR or the Department of Health.
FUNDING
This study was funded by the UK National Institute for Health Research (NIHR) under its Programme Grants for Applied Research funding scheme (RP-PG-0407-10338). A proportion of this work was undertaken at University College London and University College London Hospital, which receives a pro-portion of funding from the NIHR Biomedical Research Centre funding scheme.
REFERENCES
1. Manning DJ, Ethell S, Donovan T, Crawford T. How do radiologists do it? the influence of experience and training on searching for chest nodules.Radiography2006;12: 134–42. 2. Kundel HL, Nodine CF, Conant EF,
Weinstein SP. Holistic component of image perception in mammogram interpre-tation: gaze-tracking study.Radiology2007; 242: 396–402.doi: 10.1148/
radiol.2422051997
3. Ellis SM, Hu X, Dempere-Marco L, Yang GZ, Wells AU, Hansell DM. Thin-section CT of the lungs: eye-tracking analysis of the visual approach to reading tiled and stacked display formats.Eur J Radiol2006;59: 257–64.
4. Krupinski EA. Visual search of mammo-graphic images: influence of lesion subtlety.
Acad Radiol2005;12: 965–9.doi: 10.1016/j. acra.2005.03.071
5. Matsumoto H, Terao Y, Yugeta A, Fukuda H, Emoto M, Furubayashi T, et al. Where
do neurologists look when viewing brain CT images? an eye-tracking study involving stroke cases.PLoS One2011;6: e28928.doi: 10.1371/journal.
pone.0028928
6. Leong JJ, Nicolaou M, Emery RJ, Darzi AW, Yang GZ. Visual search behaviour in skeletal radiographs: a cross-specialty study.Clin Radiol2007;62: 1069–77.doi: 10.1016/j. crad.2007.05.008
7. Phillips P, Boone D, Mallett S, Taylor SA, Altman DG, Manning D, et al. Method for tracking eye gaze during interpretation of endoluminal 3D CT colonography: technical description and proposed metrics for analy-sis.Radiology2013;267: 924–31.doi: 10.1148/radiol.12120062
8. Halligan S, Mallett S, Altman DG, McQuillan J, Proud M, Beddoe G, et al. Incremental benefit of computer-aided detection when used as a second and concurrent reader of CT colonographic data: multiobserver study.
Radiology2011;258: 469–76.doi: 10.1148/ radiol.10100354
9. Halligan S, Altman DG, Mallett S, Taylor SA, Burling D, Roddie M, et al. Computed tomographic colonography: assessment of radiologist performance with and without computer-aided detection.Gastroenterology
2006;131: 1690–9.doi: 10.1053/j. gastro.2006.09.051
10. Chakraborty D, Yoon HJ, Mello-Thoms C. Spatial localization accuracy of radiologists in free-response studies: inferring perceptual FROC curves from mark-rating data.Acad Radiol2007;14: 4–18.doi: 10.1016/j. acra.2006.10.015
11. White IR, Royston P, Wood AM. Multiple imputation using chained equations: issues and guidance for practice.Stat Med2011;30: 377–99.doi: 10.1002/sim.4067
12. Krupinski EA. Visual scanning patterns of radiologists searching mammograms.Acad Radiol1996;3: 137–44.
BJR E Helbrenet al