I
I
n
n
t
t
e
e
r
r
n
n
a
a
t
t
i
i
o
o
n
n
a
a
l
l
J
J
o
o
u
u
r
r
n
n
a
a
l
l
o
o
f
f
B
B
i
i
o
o
l
l
o
o
g
g
i
i
c
c
a
a
l
l
S
S
c
c
i
i
e
e
n
n
c
c
e
e
s
s
2012; 8(6):838-858. doi: 10.7150/ijbs.4403 Research Paper
Quantitative Genomics of 30 Complex Phenotypes in Wagyu x Angus F
1
Progeny
Lifan Zhang
1,2, Jennifer J. Michal
1, James V. O'Fallon
1, Zengxiang Pan
1,3, Charles T. Gaskins
1, Jerry J.
Reeves
1, Jan R. Busboom
1, Xiang Zhou
1, Bo Ding
1, Michael V. Dodson
1and Zhihua Jiang
1,1. Department of Animal Sciences, Washington State University, Pullman, WA 99164-6351, USA 2. College of Animal Sciences, Zhejiang University, Hangzhou 310029, China
3. College of Animal Sciences and Technology, Nanjing Agricultural University, Nanjing 210095, China
Corresponding author: Zhihua Jiang, Tel: +509 335 8761; Fax: +509 335 4246; E-mail: [email protected]
© Ivyspring International Publisher. This is an open-access article distributed under the terms of the Creative Commons License (http://creativecommons.org/ licenses/by-nc-nd/3.0/). Reproduction is permitted for personal, noncommercial use, provided that the article is in whole, unmodified, and properly cited.
Received: 2012.03.26; Accepted: 2012.06.04; Published: 2012.06.12
Abstract
In the present study, a total of 91 genes involved in various pathways were investigated for their associations with six carcass traits and twenty-four fatty acid composition phenotypes in a Wagyu×Angus reference population, including 43 Wagyu bulls and their potential 791 F1
progeny. Of the 182 SNPs evaluated, 102 SNPs that were in Hardy-Weinberg equilibrium with minor allele frequencies (MAF>0.15) were selected for parentage assignment and association studies with these quantitative traits. The parentage assignment revealed that 40 of 43 Wagyu sires produced over 96.71% of the calves in the population. Linkage disequilibrium analysis identified 75 of 102 SNPs derived from 54 genes as tagged SNPs. After Bonferroni correction, single-marker analysis revealed a total of 113 significant associations between 44 genes and 29 phenotypes (adjusted P<0.05). Multiple-marker analysis confirmed single-gene associations for 10 traits, but revealed two-gene networks for 9 traits and three-gene networks for 8 traits. Particularly, we observed that TNF (tumor necrosis factor) gene is significantly associated with both beef marbling score (P=0.0016) and palmitic acid (C16:0) (P=0.0043), RCAN1 (regulator of calcineurin 1) with rib-eye area (P=0.0103), ASB3 (ankyrin repeat and SOCS box-containing 3) with backfat (P=0.0392), ABCA1 (ATP-binding cassette A1) with both palmitic acid (C16:0) (P=0.0025) and oleic acid (C18:1n9) (P=0.0114), SLC27A1(solute carrier family 27 A1) with oleic acid (C18:1n9) (P=0.0155), CRH (corticotropin releasing hormone) with both linolenic acid (OMEGA-3) (P=0.0200) and OMEGA 6:3 RATIO (P=0.0054), SLC27A2 (solute carrier family 27 A2) with both linoleic acid (OMEGA-6) (P=0.0121) and FAT (P=0.0333), GNG3 (guanine nucleotide binding protein gamma 3 with desaturase 9 (P=0.0115), and EFEMP1 (EGF containing fibulin-like extracellular matrix protein 1), PLTP (phospholipid transfer protein) and DSEL (dermatan sulfate epimerase-like) with conjugated linoleic acid (P=0.0042-0.0044), re-spectively, in the Wagyu x Angus F1 population. In addition, we observed an interesting
phenomenon that crossbreeding of different breeds might change gene actions to dominant and overdominant modes, thus explaining the origin of heterosis. The present study con-firmed that these important families or pathway-based genes are useful targets for improving meat quality traits and healthful beef products in cattle.
Key words: SNPs, muscle growth, fat deposition, fatty acid composition, genetic networks, beef cattle
Introduction
The beef industry is a major component of the
U.S. agricultural economy and is worth an estimated $175 billion. Approximately 800,000 ranchers and cattlemen conduct business in all 50 states and
con-Ivyspring
tribute economically to nearly every county in the nation (http://www.beefusa.org). For many years, beef was the number one source of protein in Ameri-can diets. However, the eating habits of AmeriAmeri-can consumers have changed considerably over the last three to four decades [1]. Per capita consumption of beef has fallen from an all-time high of 42.77 Kg in 1976 (American Meat Institute, 2009) to 27.08 Kg in 2010 [2]. As a result, in order to increase consumption and profitability, commercial cow-calf producers must address and find ways to optimize a number of economically important beef quality traits, such as insufficient marbling, low quality grades, inadequate meat tenderness, low curability, inadequate muscling, and excess fat cover [3]. Implementation of technolo-gies and systems that tackle these challenges is essen-tial to reduce costs and enhance productivity of beef production. One of the oldest and most fundamental principles to enable these outcomes is crossbreeding.
Indeed, crossbreeding beef cattle has routinely been a powerful method to improve and/or optimize a number of economically important traits, such as reproduction, growth, maternal ability, and end product quality; which has resulted in reduced costs of production in order to remain competitive in the industry. For example, based on the least square mean estimates from crossbreeding studies published in the literature from 1976 to 1996, Williams and colleagues [4] reported that direct breed effects range from -0.5 ± 0.14 kg (British Dairy) to 10.1 ± 0.46 kg (Continental Beef) for birth weight, from -7.0 ± 0.67 kg (British Dairy) to 29.3 ± 0.74 kg (Simmental) for weaning weight, from -17.9 ± 1.64 kg (Brahman) to 21.6 ± 1.95 kg (Charolais) for postweaning body weight gain, from -6.5 ± 1.29 kg (Brahman) to 55.8 ± 1.47 kg (Con-tinental Beef) for carcass weight, from -8.1 ± 0.48 cm2
(Shorthorn) to 21.0 ± 0.48 cm2 (Continental Beef) for
ribeye area and from -1.1 ± 0.02 cm (Continental Beef) to 0 ± 0.00 cm (Angus) for fat thickness, respectively. These results indicate that crossbreeding takes ad-vantage of heterosis and breed complementarities to maximize the productivity and profitability of beef enterprises as compared to purebreeding.
Wagyu beef cattle include the Japanese Black, Japanese Brown, Japanese Poll, and Japanese Short-horn [5]. In general, Wagyu cattle produce highly marbled beef with high amounts of monounsaturated fatty acids (MUFA) plus a large ribeye area compared with other beef breeds. For example, carcasses of Wagyu sired calves had greater marbling scores (Slightly abundant 771 vs. Modest 594, P = 0.0001), greater intramuscular fat content (12.0% vs. 10.5%, P < 0.02) and greater ribeye area (80.5 cm2 vs. 76.6 cm2, P =
0.08) at the 12th rib than those of Angus [6].
Investi-gation of fatty acid compositions among 34 sire groups of Wagyu revealed that the mean percentages of MUFA in intramuscular fat ranged from 47.71 to 54.77% [7], while MUFA was only 38.53% in Aberdeen Angus [8].
In our previous study, we reported genetic net-works associated with 19 complex phenotypes in a Wagyu x Limousin F2 reference population using a
total of 138 genetic polymorphisms derived from 71 known functional genes [9]. These genes are involved in various pathways, such as nuclear encoded mito-chondrial genes, the long chain fatty acids uptake gene complex, the sauvagine/corticotropin-releasing
factor/urotensin Ι family and related families, the
lipogenesis/lipolysis enzymes, calpain/calpasatin or related genes and others. Subsequently, we discov-ered that the genes from the reverse cholesterol transport pathway as well as the heparin and heparin metabolism pathway are also useful targets for im-proving meat quality and fatty acid composition in beef cattle [10-11]. In the present study, we tested these previously reported SNPs plus many newly developed SNPs in a Wagyu x Angus F1 reference
population measured for six carcass traits and twen-ty-four fatty acid composition phenotypes and vealed single-gene associations for 10 traits, but re-vealed two-gene networks for 9 traits and three-gene networks for 8 traits. These results clearly showed that these important families or pathway-based genes are useful targets for improving meat quality traits and healthful beef products in cattle.
MATERIAL AND METHODS
Cattle and phenotypic information
A Wagyu×Angus F1 population was used in the
present study, including 43 Wagyu bulls as sires and their 791 potential progeny. Among them, 396 F1
(C18:1n7), oleic acid (C18:1n9), and their sum as monounsaturated acids (MUFA); C) four polyun-saturated fatty acids: conjugated linoleic acid (CLA, C18:2c9,t11)), linoleic acid (OMEGA-6), linolenic acid (OMEGA-3) and their sum as polyunsaturated fatty acids (PUFA); D) two trans-fatty acids: trans-vaccenic acid (C18:1n7t) and linolelaidic (C18:2n6t); and E) five traits related to enzyme activities or others: DELTA 9 desaturase (introduces a double bond at the C9 posi-tion of a saturated fatty acid), ELONGASE (lengthens a fatty chain by two carbons due to an acetate addi-tion), OMEGA 6:3 RATIO (the ratio of omega 6 fatty acid content to that of omega 3 fatty acid content; the lower this ratio, the better for human nutrition), TRANS (the trans fatty acid content; generally trans fatty acids are detrimental to human health, but nota-ble exceptions are trans vaccenic acid and CLA), and FAT (the Total amount of fat in a beef sample). Methods and procedures to measure these pheno-types were described previously [9, 12].
DNA isolation, SNP panel information and
genotyping
DNA from the 43 sires was isolated from blood with the GenElute Blood Genomic DNA kit (Sig-ma-Aldrich, St. Louis, MO) according to
manufactur-er’s instructions. Muscle and fat tissues were collected
from the 791 yearling progeny and DNA was isolated with the GenElute Mammalian Genomic DNA Mini-prep kit (Sigma-Aldrich, St. Louis, MO) as directed. A total of 182 mutations, mainly single nucleotide pol-ymorphisms (SNPs) derived from 91 functional genes were included in the present study (Supplementary Material: Table S1). Genotyping was performed using a Sequenom iPLEX assay service provided by the Genomics Center at the University of Minnesota.
Parentage assignment
Based on the genotyping data, we calculated both genotype and allele frequencies in sires and the F1 progeny, but only estimated the allele frequencies
in dams as FD(A)=2FP(A) – FS(A) (where FD(A), FP(A), and
FS(A) represent the frequencies for the same allele in
dams, progeny, and sires, respectively) (Supplemen-tary Material: Table S2). SNPs/mutations that were in Hardy-Weinberg equilibrium and had a minor allele frequency of >0.15 were then selected to form a marker panel for parentage assignments. Paternity was assigned after genotyping data from the offspring were analyzed with the Cervus computer program [13-15]. The Cervus software package uses a likeli-hood-based approach to compute a probability for a true sire even if genotypes of the dams were un-known. The accurate parentage assignment made it possible to pursue the marker-trait association study using a sire model as described below.
Statistical analyses and genetic evaluation
The HAPLOVIEW program [16] was used to determine the linkage disequilibrium (LD) relation-ships among 102 markers located on 23 bovine chro-mosomes (Supplementary Material: Table S2), which lead to selection of tag mutations for further analysis. Comparisons of gene allele and genotype frequencies in each tag SNP were carried out using the chi-squared
test of SAS Software for Windows v9.2 (SAS Institute Inc., Gary, NC). The phenotypes REA, BFT, BMS and all fatty acid traits were first tested to ensure that the data were normal random distributions. Association analyses were performed using the PROC MIXED procedure of SAS using the following models:
ijklmn m l k j i
ijklmn
group
sex
killdate
sires
HCW
genotype
y
…(1) ijklmn m l k j i
ijklmn
group
sex
killdate
sires
genotype
y
…(2)
where yijklm or yijklmn is the phenotypic measurement of
a quantitative trait for each animal, groupi is the effect
of the i-th cattle population (i=1,2), sexj is the effect of
the j-th sex category (j=1,2), killdatek is a random effect
of the k-th harvest date (j=1,2,…12), siresl is a random
effect of the l-th sire producing each animal
(l=1,2,…,40), HCW is a covariate, is the coefficient vector corresponding to the covariate HCW, genotypem
represents the effects of each genotype at the related SNP locus, and εijklmn is the residual term pertaining to
each animal. P value <0.05 was considered statistically significant after Bonferroni correction. Model (1) us-ing HCW as a covariate was initially tested on each
trait, but it was removed in Model (2) when it did not reach statistical significance (P>0.05). In fact, HCW
Finally, we also employed the quantitative trait modes (QTMs) with additive, dominant, and over-dominant effects to identify novel genetic networks or gene-gene combined effects related to these 30 traits. Only significant markers that had ≥15 animals in each genotype group were examined for the QTMs fol-lowed by linear regression model analysis for selec-tion of genetic networks. This procedure was de-scribed previously [9] with minor modifications. Briefly, we classified the single-trait significant asso-ciations into three QTMs (additive, dominant, and overdominant mode) based on the pairwise signifi-cance tests, and then we integrated these markers along with their QTMs into a linear regression analy-sis for a given phenotype using the SAS stepwise
re-gression procedure. Akaike’s information criterion
(AIC) [19] was used to compare different models, each representing a specific genetic network.
RESULTS
Gene and SNP basics
Originally, this set of 182 polymorphic markers was developed on 6 Wagyu x Limousin F1 bulls,
gen-otyped on a Wagyu x Limousin F2 population, and
used to determine their associations with 19 quantita-tive traits [9]. Supplementary Material: Table S1 lists all of these polymorphic markers with their gene symbol, description, chromosome number, genome location, mutation types and pathway/functional category. In brief, these markers were derived from 91 functional known genes, which can be classified into seven gene clusters, plus others. Among them, one gene was selected from BTAs (Bos taurus chromo-somes) 5, 8, 13, 20 and 21; two genes from BTAs 4, 9, 17, 24, 26 and 28; three genes from BTAs 3 and 15; four genes from BTAs 6, 7, 10 and 19; five genes from BTAs 2, 11, 14 and 16; seven genes from BTAs 23; eight genes from BTA 1 and 18; and nine genes from BTA 29. Fourteen of these markers were monomor-phic in the current population. Among the remaining 168 polymorphic markers, 136 passed the Har-dy-Weinberg equilibrium (HWE) test (P>0.05) while 32 failed the test (P<0.05).
Genotype and allele frequencies for these 168 polymorphic markers are listed in Supplementary Material: Table S2. Among 136 markers that passed the HWE test, 38 (27.94%) markers had a fixed allele in one of the parent populations (allele frequency ≥ 0.9). In contrast, among the 32 markers that failed the HWE test, 25 (78.13%) had a fixed allele in either parent (allele frequency ≥ 0.9), including 7 alleles that were fixed in sires and 18 in dams. Ninety of the 136 (66.18%) markers in HWE shared the same minor
al-lele, while the opposite allele was the minor allele in the sire and dam populations in 46 of 136 (33.82%) markers (Supplementary Material: Table S2). Among 32 markers in the parent populations that were not in HWE, the minor allele in 19 (59.38%) markers was the same allele, while the minor allele was the opposite allele in 13 (40.63%) markers (Supplementary Materi-al: Table S2). In addition, 34 of 136 markers were ex-cluded from additional analysis as their minor allele frequencies were 0.15 or less. Therefore, only 102 markers representing 54 known genes were involved in parentage assignment and linkage disequilibrium analysis (Supplementary Material: Table S2).
Parentage assignment in the population
In the present study, the dam’s genotypes were not available so the population genetic parameters were computed only from the sires and calves. All the SNP loci had a mean polymorphic information con-tent of 0.3432, and a mean expected heterozygosity of 0.4427. Based on the genotype frequencies for this SNP panel, the mean probability of identity (PI) is the probability that the genotypes at a single locus do not differ between two randomly-chosen individuals [20]. The non-exclusion PI for a combination of 102 SNP markers was 4.06×10-40 for our cattle population,
suggesting that the chances of a coincidental genotype match between two randomly-chosen animals were extremely low in the Wagyu x Angus F1 population.
The SNP marker panel was further employed to estimate the power in parentage assignment. For this purpose, both NE-2P and NE-1P were defined as the probability that a random candidate sire would not be
excluded from paternity when the dam’s genotype
was available or not, respectively. Across all loci, we obtained the combined exclusion probability based on NE-1P and NE-2P at every single locus [21]. The combined exclusion probability for the set of loci used in the parentage analysis was high: 0.9999 for the first parent and almost 1 for the second parent, which showed an acceptable high exclusion power for the SNPs marker set to identify genetic paternity in the present study. As a result, 40 of 43 herd sires pro-duced over 765 (96.71%) of the calves in our cattle population (Figure 1), which demonstrated this marker set was highly efficient in paternity assign-ment.
Single marker
–
single trait associations and
their QTMs
The HAPLOVIEW analysis revealed strong linkage disequilibrium relationships between/among markers in RCAN1 (r2=96-100%), ALDH4A1 (r2=96%),
(r2=97%-100%), ABCA1 (r2=100%), SLC27A2
(r2=100%), APOB (r2=97%), CAPN14 (r2=100%),
SLC27A4 (r2=92-99%), CRH (r2=100%), FABP4
(r2=100%), TFB2M (r2=97%), APOE (r2=90-100%),
CHD9 (r2=99%), FTO (r2=99%), LIPE (r2=84-98%), TNF
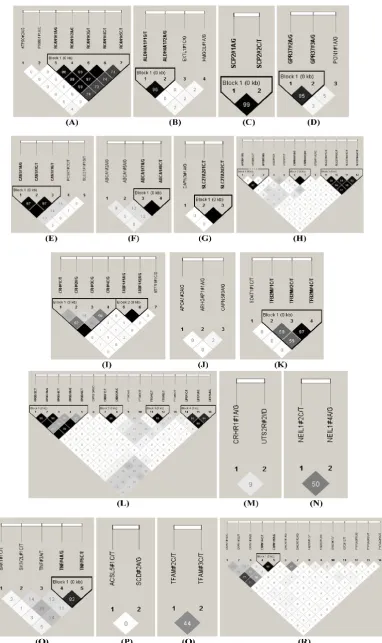
(r2=83%) and CAPN1 (r2=96%) (Figure 2). Therefore,
75 SNPs of 102 markers (73.53%) in 54 genes were selected as tagged SNPs for the association study with Bonferroni correction (Supplementary Material: Ta-ble S2). Carcass traits were recorded on samples col-lected in both years, while fatty acid profiling was performed only on samples collected in 2007. So after removing samples lacking information on sex and sires as assigned above, 651 animals were used for marker – carcass (6 traits) association analysis and 333 for marker - fatty acid composition (24 phenotypes) association analysis. A total of 142 significant associa-tions were initially discovered (Table 1). Five of them
were removed due to ≤ 15 animals in each genotype
group and 24 were excluded after the Bonferroni cor-rection. As such, only 113 single marker associations remained with 29 phenotypes, including 2 with BMS, 4 with REA, 1 with BFT, 7 with QG, 7 with YG, 5 with HCW, 7 with C14:0, 5 with C14:1n5, 1 with C15:0, 2 with C15:1n5, 3 with C16:0, 5 with C16:1n7, 3 with C17:0, 3 with C17:1n7, 4 with C18:1n7t, 5 with C18:1n7, 7 with C18:1n9, 1 with C18:2n6t, 5 with MUFA, 4 with PUFA, 4 with SFA, 5 with CLA, 3 with TRANS, 2 with OMEGA-3, 4 with OMEGA-6, 3 with OMEGA 6:3 RATIO, 3 with DELTA9 desaturase, 4 with ELONGASE, and 4 with Total FAT. No markers were discovered to significantly affect C18:0. These 113 single markers – single trait associations can be further classified into three groups according to three
quantitative trait modes (QTMs): 9 with additive, 73 with dominant and 31 with overdominant effects (Table 1). One marker can be associated with different phenotypes, but with different QTMs. For example,
TNF#3 A/T had an additive effect on BMS but an overdominant effect on YG.
Multiple markers
–
single trait regressions for
different genetic networks
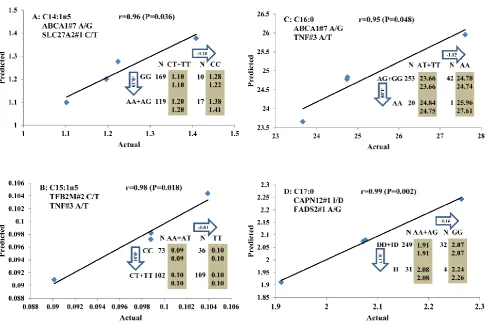
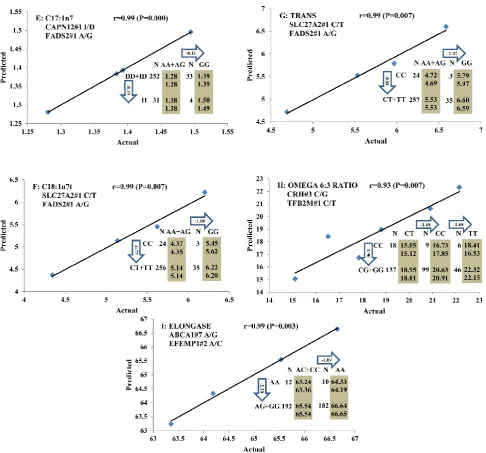
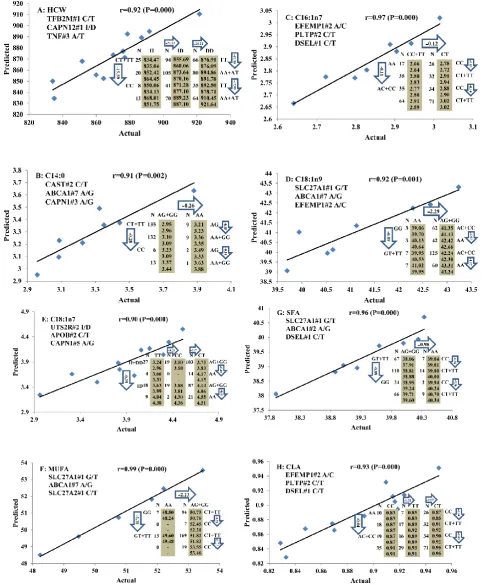
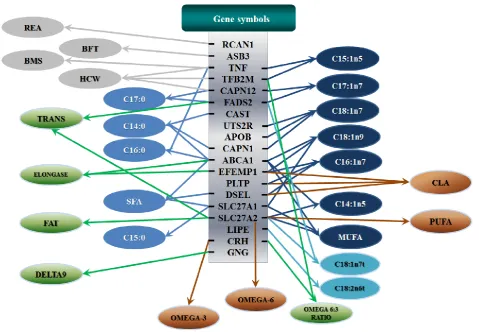
All significant single-marker associations related to each trait along with their QTMs were then in-volved in a linear regression model analysis to de-termine genetic networks. Single-trait associations with QG and adjusted YG were excluded because of the non-normal distributions in these two measure-ments. Based on the lowest AIC values and correla-tion coefficients (r) >0.8 between predicted and real genotype values, the regression analysis revealed the best single-gene associations for BMS, REA, BFT, C15:0, C18:2n6t, PUFA, OMEGA-3, OMEGA-6, DELTA9 desaturase, and Total Fat (Figure 3); the best two-gene networks for C14:1n5, C15:1n5, C16:0, C17:0, C17:1n7, C18:1n7t, TRANS, OMEGA 6:3 RATIO, and ELONGASE (Figure 4); and the best three-gene networks for HCW, C14:0, C16:1n7, C18:1n9, C18:1n7, SFA, MUFA, and CLA (Figure 5), respectively. In fact, all of these 52 associa-tions/networks were orchestrated by a total of 19 genes, including RCAN1, ASB3, TNF, TFB2M,
CAPN12, FADS2, CAST, UTS2R, APOB, CAPN1,
ABCA1, EFEMP1, PLTP, DSEL, SLC27A1, SLC27A2,
LIPE, CRH, and GNG3 (Figure 6). Among them, 12 genes had pleiotropic effects because each influenced multiple phenotypic traits.
Table 1. Association of significant SNP markers with 29 economically important traits in beef and marker QTMs*.
Trait Marker N1 Q N2 G LSM±SE P Trait Marker N1 Q N2 G LSM±SE P BMS TNF#3 A/T 645 A 91 AA 6.8787±0.2982a 0.0016 C18:1n9 PSMG1#1 A/C 319 O 59 AA 42.0533±0.4051ab 0.0408
275 AT 7.3723±0.2269a 179 AC 41.6613±0.2997a
279 TT 7.8107±0.2254b 81 CC 42.5384±0.3639b
BMS IGF2#1 C/T 627 O 179 CC 7.1579±0.2619a 0.0161 C18:1n9 SLC27A1#1
G/T 318 D 112 GG 41.3939±0.3434
a 0.0155
319 CT 7.7362±0.2351b 151 GT 42.3725±0.3033b
129 TT 7.5411±0.2744ab 55 TT 42.0665±0.4189ab
BMS ASB3#2 C/T 640 279 CC 7.1787±0.2339a 0.0026 C18:1n9 ABCA1#7 A/G 312 D 21 AA 40.3968±0.5986a 0.0114
359 CT 7.7674±0.2252b 113 AG 42.2364±0.3162b
2 TT 7.7976±1.4338ab 178 GG 42.0831±0.2829b
C18:1n9 SLC27A2#1
C/T 319 D 27 CC 43.1295±0.5434
a 0.0370
REA RCAN1#5 C/T 638 D 35 CC 12.1809±0.2148a 0.0103 153 CT 41.9958±0.3059ab
480 CT 12.7929±0.1056b 139 TT 41.7072±0.3223b
123 TT 12.7325±0.1335b C18:1n9 EFEMP1#2
A/C 319 D 114 AA 42.5363±0.3410
a 0.0178
REA CAPN12#1
I/D 631 O 67 II 12.4514±0.1690
a 0.0099 189 AC 41.6884±0.3029b
318 IT 12.8552±0.1136b 16 CC 41.6262±0.7182ab
246 DD 12.6783±0.1192ab C18:1n9 TFB2M#2 C/T 310 O 93 CC 41.4395±0.3801a 0.0365
REA LIPE#1 C/T 638 D 26 CC 12.1830±0.2351a 0.0177 164 CT 42.3131±0.3278b
390 CT 12.7352±0.1085b 53 TT 41.8789±0.4467ab
222 TT 12.8310±0.1180b C18:1n9 DSEL#1 C/T 320 D 112 CC 42.5322±0.3452a 0.0343
REA CRHR1#1 A/G 633 D 177 AA 12.7084±0.1286ab 0.0391 148 CT 41.7321±0.3142b
375 AG 12.8158±0.1145a 60 TT 41.6584±0.4147ab
81 GG 12.4796±0.1630b
REA MTFR1#1 C/G 646 146 CC 12.5158±0.1446a 0.0474 C18:1n7 APOB#2 C/T 323 O 40 CC 3.7696±0.2295ab 0.0019
344 CG 12.8117±0.1172a 225 CT 4.0884±0.1738a
156 GG 12.8551±0.1429a 58 TT 3.5692±0.2110b
C18:1n7 UTS2R#2 I/D 325 O 142 II 3.7433±0.1841a 0.0031
BFT ASB3#1 G/T 640 O 243 GG 0.7173±0.0198a 0.0392 156 ID 4.1578±0.1828b
314 GT 0.7582±0.0189b 27 DD 3.8438±0.2665ab
83 TT 0.7334±0.0260ab C18:1n7 TFAM#3 C/T 325 O 107 CC 3.7562±0.1917a 0.0134
BFT ALDH4A1#1
G/T 632 80 GG 0.7750±0.0263
a 0.0328 173 CT 4.1117±0.1819b
301 GT 0.7500±0.0192a 45 TT 3.7999±0.2295ab
251 TT 0.7162±0.0199a C18:1n7 CAPN1#1 C/G 323 D 128 CC 3.8201±0.1940a 0.0106
161 CG 3.9166±0.1847a
QG RCAN1#5 C/T 511 D 30 CC 13.0899±0.1661a 0.0000 34 GG 4.4702±0.2481b
385 CT 13.8295±0.0728b C18:1n7 CAPN1#5
A/G 325 D 50 AA 4.3967±0.2243
a 0.0021
96 TT 13.7488±0.1073b 169 AG 3.9420±0.1840b
QG ALDH4A1#1
G/T 508 D 58 GG 13.4378±0.1277
a 0.0115 106 GG 3.7302±0.1974b
238 GT 13.8031±0.0801b C18:1n7 CRH#3 C/G 323 34 CC 3.6775±0.2460a 0.0177
212 TT 13.8215±0.0837b 188 CG 4.1050±0.1834a
QG LRPAP1#1
C/T 514 D 81 CC 13.4919±0.1144
a 0.0113 101 GG 3.7931±0.1969a
222 CT 13.7745±0.0822b C18:1n7 SKIV2L#1 C/T 324 84 CC 3.8167±0.2103a 0.0381
211 TT 13.8506±0.0838b 157 CT 3.8763±0.1857a
QG CAST#2 C/T 518 D 39 CC 13.4334±0.1500a 0.0394 83 TT 4.2204±0.2047a
235 CT 13.8189±0.0828b
244 TT 13.7859±0.0826ab C18:2n6t LIPE#1 C/T 318 A 15 CC 0.3460±0.0221ab 0.0131
QG FTO#3 C/T 509 O 186 CC 13.6188±0.0869a 0.0021 191 CT 0.3714±0.0097a
259 CT 13.9097±0.0812b 112 TT 0.3946±0.0106b
64 TT 13.6592±0.1277ab C18:2n6t SCP2#1 A/G 318 14 AA 0.3443±0.0226a 0.0466
QG TNF#3 A/T 517 D 66 AA 13.4994±0.1190a 0.0290 139 AG 0.3899±0.0111a
217 AT 13.7684±0.0797ab 165 GG 0.3739±0.0106a
QG DHCR7#2
A/G 523 D 216 AA 13.8381±0.0808
a 0.0001 MUFA PSMG1#1 A/C 318 O 60 AA 51.3753±0.4676ab 0.0157
289 AG 13.7733±0.0743a 177 AC 50.8816±0.3788a
18 GG 12.9737±0.1990b 81 CC 51.9133±0.4335b
MUFA SLC27A1#1
G/T 317 D 109 GG 50.5009±0.3992
a 0.0027
YG HMGCL#1
A/G 641 D 16 AA 4.0484±0.2350
ab 0.0196 153 GT 51.7196±0.3588b
301 AG 3.8261±0.0876a 55 TT 51.5203±0.4676ab
324 GG 3.6885±0.0852b MUFA ABCA1#7 A/G 312 D 22 AA 49.6734±0.6498a 0.0077
YG APOB#2 C/T 634 D 84 CC 3.5764±0.1027a 0.0105 112 AG 51.6650±0.4002b
449 CT 3.7860±0.0859b 178 GG 51.3120±0.3709b
101 TT 3.8064±0.1161ab MUFA SLC27A2#1
C/T 318 D 27 CC 53.0719±0.5922
a 0.0006
YG ASB3#1 G/T 634 D 240 GG 3.6712±0.0903a 0.0325 151 CT 51.2234±0.3751b
313 GT 3.8266±0.0888b 140 TT 50.8665±0.3894b
81 TT 3.7972±0.1118ab MUFA DSEL#1 C/T 319 D 109 CC 51.9722±0.4281a 0.0073
YG CAPN5#3
A/G 622 D 328 AA 3.8131±0.0878
a 0.0088 150 CT 50.9171±0.3970b
248 AG 3.7282±0.0893ab 60 TT 51.0153±0.4871ab
46 GG 3.5111±0.1161b
YG FTO#8 C/T 633 O 301 CC 3.8695±0.0911a 0.0045 PUFA ABCA1#7 A/G 313 O 21 AA 2.2766±0.1008ab 0.0437
289 CT 3.6587±0.0882b 113 AG 2.2167±0.0640a
43 TT 3.7323±0.1290ab 179 GG 2.3371±0.0597b
YG TNF#3 A/T 638 O 91 AA 3.7494±0.1172ab 0.0010 PUFA SLC27A2#1
C/T 320 A 27 CC 2.1306±0.0912
a 0.0074
270 AT 3.8957±0.0961a 151 CT 2.2743±0.0598ab
277 TT 3.6626±0.0939b 142 TT 2.3712±0.0617b
YG TFAM#3 C/T 620 D 223 CC 3.7472±0.0912a 0.0211 PUFA CRHR1#1 A/G 320 O 92 AA 2.2585±0.0673ab 0.0138
314 CT 3.7378±0.0886a 185 AG 2.3356±0.0606a
84 TT 4.0105±0.1219b 43 GG 2.1458±0.0817b
YG LIPE#1 C/T 636 26 CC 4.1643±0.2051a 0.0373 PUFA SKIV2L#1 C/T 320 O 82 CC 2.1987±0.0658a 0.0326
387 CT 3.7795±0.0856a 155 CT 2.3415±0.0582b
223 TT 3.6978±0.0897a 83 TT 2.2875±0.0661ab
HCW SLC27A4#2
C/T 647 D 252 CC 878.59±13.6600
a 0.0305 SFA SLC27A1#1
G/T 319 D 113 GG 39.5921±0.2330
a 0.0031
315 CT 862.85±13.4855b 152 GT 38.7575±0.2001b
80 TT 864.63±15.2369ab 54 TT 38.6805±0.2996b
HCW TFB2M#1 C/T 641 D 238 CC 880.55±13.5547a 0.0219 SFA ABCA1#2 A/G 311 D 32 AA 39.8422±0.3693a 0.0409
301 CT 863.69±13.2943b 159 AG 39.0961±0.2092ab
101 TT 864.28±14.6212ab 120 GG 38.8307±0.2247b
HCW TFB2M#2 C/T 621 A 174 CC 858.94±13.6556a 0.0238 SFA ABCA1#7 A/G 313 D 22 AA 40.0681±0.4352a 0.0225
303 CT 870.08±13.1404ab 114 AG 39.1215±0.2295ab
144 TT 881.75±13.8614b 177 GG 38.8523±0.2070b
HCW CAPN12#1
I/D 632 A 67 II 851.09±14.4969
a 0.0319 SFA DSEL#1 C/T 321 D 113 CC 38.5723±0.2402a 0.0106
318 ID 867.39±11.8914ab 147 CT 39.2817±0.2116b
247 DD 877.37±12.1458b 61 TT 39.3180±0.2928ab
HCW TNF#3 A/T 645 D 91 AA 877.20±14.7955ab 0.0087 SFA TFAM#2 C/T 321 48 CC 39.3908±0.3172a 0.0471
275 AT 877.88±13.1753a 167 CT 38.7811±0.2107a
279 TT 858.85±13.1555b 106 TT 39.2679±0.2393a
HCW APOE#4 C/T 641 35 CC 884.74±18.1782a 0.0438
394 CT 872.78±13.2659a CLA CAST#2 C/T 318 D 24 CC 0.9573±0.0205a 0.0446
212 TT 859.50±13.7205a 132 CT 0.9047±0.0104b
162 TT 0.9060±0.0100ab
C14:0 CAST#2 C/T 315 D 23 CC 3.3057±0.0975a 0.0328 CLA TFB1M#1 G/T 323 O 29 GG 0.9139±0.0193ab 0.0218
132 CT 3.0755±0.0656b 132 GT 0.8907±0.0101a
160 TT 3.1194±0.0650ab 162 TT 0.9229±0.0097b
C14:0 ABCA1#7 A/G 313 D 21 AA 3.3618±0.1024a 0.0048 CLA EFEMP1#2
A/C 324 D 114 AA 0.8851±0.0113
114 AG 3.1401±0.0666ab 194 AC 0.9221±0.0096b
178 GG 3.0657±0.0631b 16 CC 0.9246±0.0260ab
C14:0 CAPN14#2
A/G 317 D 116 AA 3.2001±0.0648
a 0.0166 CLA PLTP#2 C/T 315 O 82 CC 0.8858±0.0135a 0.0042
171 AG 3.0594±0.0620b 164 CT 0.9282±0.0108b
30 GG 3.0849±0.0894ab 69 TT 0.9009±0.0145ab
C14:0 EFEMP1#2
A/C 320 A 112 AA 3.0373±0.0672
a 0.0283 CLA DSEL#1 C/T 325 D 114 CC 0.8836±0.0109a 0.0044
192 AC 3.1516±0.0622b 150 CT 0.9226±0.0096b
16 CC 3.2244±0.1173ab 61 TT 0.9216±0.0139b
C14:0 CRHR1#1 A/G 321 D 92 AA 3.1463±0.0693a 0.0177 CLA ABCA1#7 A/G 317 22 AA 0.9436±0.0218a 0.0222
185 AG 3.1372±0.0623a 115 AG 0.9226±0.0111a
44 GG 2.9411±0.0864b 180 GG 0.8959±0.0098a
C14:0 TNF#3 A/T 320 D 45 AA 3.2604±0.0859a 0.0100 CLA ASB3#1 G/T 324 128 GG 0.8916±0.0105a 0.0459
131 AT 3.0575±0.0670b 154 GT 0.9196±0.0097a
144 TT 3.1329±0.0671ab 42 TT 0.9213±0.0163a
C14:0 CAPN1#3
A/G 321 O 29 AA 3.1482±0.0943
ab 0.0070
159 AG 3.0336±0.0665a TRANS ABCA1#7 A/G 313 O 21 AA 6.0375±0.3813ab 0.0251
133 GG 3.2002±0.0677b 114 AG 5.3747±0.2552a
C14:0 APOB#2 C/T 319 40 CC 3.0372±0.0834a 0.0362 178 GG 5.8040±0.2434b
221 CT 3.0915±0.0614a TRANS SLC27A2#1
C/T 319 D 27 CC 4.9060±0.3362
a 0.0040
58 TT 3.2444±0.0791a 151 CT 5.6774±0.2302b
141 TT 5.9110±0.2376b
C14:1n5 ALDH4A1#1
G/T 313 D 47 GG 1.0792±0.1100
a 0.0387 TRANS FADS2#1 A/G 320 D 115 AA 5.4532±0.2449a 0.0008
149 GT 1.2297±0.1012b 167 AG 5.6051±0.2289a
117 TT 1.2131±0.1023ab 38 GG 6.4917±0.3106b
C14:1n5 PCSK1#2 C/T 322 O 75 CC 1.1089±0.1014a 0.0450 TRANS SLC27A1#1
G/T 318 112 GG 5.8670±0.2590
a 0.0492
194 CT 1.2299±0.0963b 151 GT 5.4910±0.2416a
53 TT 1.1715±0.1050ab 55 TT 5.9031±0.2904a
C14:1n5 ABCA1#7 A/G 316 D 22 AA 1.2685±0.1214ab 0.0066 TRANS APOA1#2
A/G 311 3 AA 7.2593±0.8453
a 0.0308
115 AG 1.2682±0.1001a 94 AG 5.4303±0.2611a
179 GG 1.1374±0.0980b 214 GG 5.7376±0.2382a
C14:1n5 SLC27A2#1
C/T 323 D 27 CC 1.3524±0.1145
a 0.0153
153 CT 1.1987±0.0960ab OMEGA
-3 CRH#3 C/G 315 O 30 CC 0.1316±0.0090
a 0.0200
143 TT 1.1385±0.0971b 185 CG 0.1115±0.0061b
C14:1n5 ACSL5#1 C/T 323 O 123 CC 1.1735±0.0990ab 0.0413 100 GG 0.1207±0.0067ab
149 CT 1.2390±0.0982a OMEGA
-3 IGF2#1 C/T 310 O 82 CC 0.1268±0.0072
a 0.0347
51 TT 1.1005±0.1065b 173 CT 0.1121±0.0062b
C14:1n5 SCD1#2 A/G 314 14 AA 1.0891±0.1357a 0.0463 55 TT 0.1191±0.0077ab
134 AG 1.1478±0.1001a OMEGA
-3 TFB2M#1 C/T 317 157 CC 0.1115±0.0066
a 0.0179
166 GG 1.2442±0.0994a 108 CT 0.1227±0.0061a
52 TT 0.1072±0.0079a
C15:0 SLC27A1#1
G/T 321 D 112 GG 0.7055±0.0198
a 0.0195
154 GT 0.6708±0.0188b OMEGA
-6 ABCA1#7 A/G 315 O 21 AA 2.1607±0.1009
ab 0.0466
55 TT 0.6718±0.0216ab 114 AG 2.1045±0.0648a
180 GG 2.2222±0.0607b
C15:1n5 TFB2M#1 C/T 321 D 110 CC 0.0939±0.0026a 0.0109 OMEGA
-6 SLC27A2#1 C/T 322 A 27 CC 2.0325±0.0916
a 0.0121
158 CT 0.1014±0.0023b 152 CT 2.1577±0.0610ab
53 TT 0.1032±0.0035b 143 TT 2.2533±0.0627b
-6
130 AT 0.0953±0.0023a 185 AG 2.2158±0.0616a
145 TT 0.1029±0.0023b 44 GG 2.0416±0.0816b
OMEGA
-6 SKIV2L#1 C/T 322 D 83 CC 2.0891±0.0667
a 0.0436
C16:0 ABCA1#7 A/G 317 D 22 AA 25.0129±0.4259a 0.0025 156 CT 2.2233±0.0596b
115 AG 24.1660±0.2849ab 83 TT 2.1710±0.0672ab
180 GG 23.7658±0.2708b OMEGA
-6 RCAN1#6 C/T 321 14 CC 1.9818±0.1195
a 0.0257
C16:0 PLTP#2 C/T 315 O 82 CC 23.8683±0.3162ab 0.0055 249 CT 2.2078±0.0567a
164 CT 24.2921±0.2838a 58 TT 2.0942±0.0729a
69 TT 23.5817±0.3302b
C16:0 TNF#3 A/T 324 D 45 AA 24.7247±0.3603a 0.0043 OMEGA
-6:3 CRH#3 C/G 315 D 33 CC 16.6578±1.5585
a 0.0054
132 AT 23.7729±0.2772b 182 CG 21.0695±1.0786b
147 TT 24.0488±0.2768ab 100 GG 20.2472±1.1780b
C16:0 LRPAP1#1
C/T 321 45 CC 23.9383±0.3487
a 0.0450 OMEGA
-6:3 TFB2M#1 C/T 317 O 109 CC 21.0956±1.1514
ab 0.0015
152 CT 24.2678±0.2752a 156 CT 19.0225±1.0867a
124 TT 23.7613±0.2793a 52 TT 22.8876±1.3706b
OMEGA
-6:3 PNPLA2#1 C/G 315 D 83 CC 20.0462±1.1625
ab 0.0272
C16:1n7 ABCA1#7 A/G 317 A 22 AA 3.0133±0.0670a 0.0162 163 CG 19.6211±1.0328a
115 AG 2.9232±0.0338ab 67 GG 22.3840±1.2291b
180 GG 2.8456±0.0299b OMEGA
-6:3 CRH#2 A/G 316 13 AA 20.6608±2.1540
ab 0.0336
C16:1n7 ASB3#1 G/T 324 D 128 GG 2.8265±0.0322a 0.0266 100 AG 21.8716±1.1010a
154 GT 2.9231±0.0293b 203 GG 19.6002±0.9859b
42 TT 2.9165±0.0498ab OMEGA
-6:3 IGF2#1 C/T 309 85 CC 19.1924±1.1687
a 0.0411
C16:1n7 EFEMP1#2
A/C 324 D 114 AA 2.8193±0.0340
a 0.0121 169 CT 21.2254±1.0191a
194 AC 2.9221±0.0287b 55 TT 19.0672±1.2844a
16 CC 2.9301±0.0804ab
C16:1n7 PLTP#2 C/T 315 O 82 CC 2.8119±0.0406a 0.0012 DELTA9 SLC27A2#1
C/T 320 D 26 CC 83.2946±0.7098
a 0.0189
164 CT 2.9526±0.0322b 152 CT 81.9178±0.4681ab
69 TT 2.8539±0.0440ab 142 TT 81.4771±0.4825b
C16:1n7 DSEL#1 C/T 325 D 114 CC 2.8138±0.0336a 0.0112 DELTA9 TFB2M#1 C/T 321 D 110 CC 82.5440±0.5159a 0.0255
150 CT 2.9224±0.0294b 159 CT 81.5615±0.4769b
61 TT 2.9243±0.0428ab 52 TT 81.4223±0.6053ab
C16:1n7 TFB1M#1 G/T 323 29 GG 2.9296±0.0596a 0.0337 DELTA9 GNG3#2 G/T 313 A 24 GG 80.7177±0.7156a 0.0115
132 GT 2.8319±0.0307a 140 GT 81.4788±0.4522ab
162 TT 2.9197±0.0298a 149 TT 82.3947±0.4532b
DELTA9 SLC27A1#1
G/T 319 113 GG 81.2776±0.4968
a 0.0482
C17:0 ABCA1#7 A/G 312 D 22 AA 1.7990±0.0850a 0.0326 152 GT 82.0319±0.4607a
114 AG 1.9288±0.0637ab 54 TT 82.5316±0.5732a
176 GG 1.9730±0.0616b DELTA9 APOE#5 A/G 313 29 AA 82.4964±0.6825a 0.0316
C17:0 CAPN12#1
I/D 316 D 35 II 2.1017±0.0766
a 0.0049 181 AG 81.4557±0.4722a
166 ID 1.9263±0.0599b 103 GG 82.3526±0.5136a
115 DD 1.9058±0.0626b
C17:0 FADS2#1 A/G 320 D 114 AA 1.9479±0.0631ab 0.0253 ELONG
ASE ABCA1#7 A/G 317 D 22 AA 63.7281±0.6657
a 0.0020
169 AG 1.9128±0.0602a 115 AG 65.3718±0.4377b
37 GG 2.0617±0.0749b 180 GG 65.8435±0.4146b
C17:0 SCD#2 A/G 310 14 AA 2.1306±0.0976a 0.0389 ELONG
ASE EFEMP1#2 A/C 324 D 114 AA 66.0452±0.4422
a 0.0210
132 AG 1.9519±0.0623ab 194 AC 65.2039±0.4098b
164 GG 1.9152±0.0614b 16 CC 65.2053±0.7816ab
ASE
C17:1n7 FABP4#1 A/G 317 O 60 AA 1.3475±0.0470a 0.0415 164 CT 65.0435±0.4422a
174 AG 1.2727±0.0416b 69 TT 66.1899±0.5160b
83 GG 1.3054±0.0445ab ELONG
ASE TNF#3 A/T 324 D 45 AA 64.5268±0.5653
a 0.0192
C17:1n7 CAPN12#1
I/D 320 D 35 II 1.3838±0.0527
a 0.0209 132 AT 65.8124±0.4316b
168 ID 1.2905±0.0416b 147 TT 65.4346±0.4309ab
117 DD 1.2681±0.0433b ELONG
ASE TFB1M#1 G/T 323 29 GG 65.2667±0.6134
a 0.0440
C17:1n7 FADS2#1 A/G 324 D 115 AA 1.2992±0.0433ab 0.0206 132 GT 65.9508±0.4165a
171 AG 1.2735±0.0414a 162 TT 65.1806±0.4165a
38 GG 1.3759±0.0511b ELONG
ASE DSEL#1 C/T 325 114 CC 66.0345±0.4416
a 0.0420
C17:1n7 SCD#2 A/G 314 14 AA 1.4237±0.0666a 0.0168 150 CT 65.2389±0.4138a
135 AG 1.3095±0.0432ab 61 TT 65.1955±0.4981a
165 GG 1.2677±0.0427b
FAT PCSK1#2 C/T 319 D 75 CC 81.0719±2.4719ab 0.0325
C18:1n7t ABCA1#2 A/G 310 D 30 AA 4.6378±0.3285a 0.0250 191 CT 80.3735±2.4141a
162 AG 5.1515±0.2346ab 53 TT 82.8640±2.5188b
118 GG 5.4210±0.2413b FAT SLC27A2#1
C/T 320 D 26 CC 78.1833±2.6485
a 0.0333
C18:1n7t ABCA1#7 A/G 312 O 20 AA 5.4669±0.3725ab 0.0398 153 CT 80.8826±2.4034ab
114 AG 4.9779±0.2441a 141 TT 81.6011±2.4143b
178 GG 5.3914±0.2327b FAT CAPN1#2 C/T 312 D 141 CC 80.2166±2.4515a 0.0117
C18:1n7t SLC27A2#1
C/T 318 D 27 CC 4.5148±0.3209
a 0.0054 145 CT 81.4189±2.4505ab
151 CT 5.2744±0.2178b 26 TT 83.9212±2.6843b
140 TT 5.4578±0.2256b FAT PNPLA2#3
C/T 317 D 64 CC 82.8295±2.5200
a 0.0128
C18:1n7t FADS2#1 A/G 319 D 114 AA 5.0141±0.2305a 0.0003 160 CT 80.6430±2.4508b
167 AG 5.1991±0.2142a 93 TT 79.9845±2.4870b
38 GG 6.0840±0.2936b FAT TNF#5 C/T 319 197 CC 81.0481±2.4115a 0.0265
C18:1n7t APOA1#2
A/G 310 3 AA 6.8097±0.8099
a 0.0246 120 CT 80.9194±2.4464a
94 AG 5.0101±0.2476a 2 TT 69.2402±4.9516b
213 GG 5.3177±0.2255a FAT CAPN1#1 C/G 319 127 CC 81.9978±2.4602a 0.0459
158 CG 80.4552±2.4445a
34 GG 79.6255±2.6184a
*The different lowercase letters between different genotypes within the same marker indicate that the difference reached the significance level of P<0.05, while the same letters between genotypes show no significant difference (P>0.05). A, D and O represent additive, dominant and overdominant effects in the QTMs analysis respectively. The markers that do not show any significance among different genotypes after Bonferroni correction are underlined. The significant markers that have ≤ 15 animals in each genotype group are italicized.
Figure 2. Linkage disequilibrium analysis for markers in 49 genes. Pairwise linkage disequilibrium relationships for these SNPs are based on r2
Figure 3. Single marker-trait associations confirmed by linear regression analysis. A: TNF on BMS; B: RCAN1 on REA; C: ASB3 on BFT; D: SLC27A1 on C15:0; E: LIPE on C18:2N6T; F: SLC27A2 on PUFA; G: CRH on OMEGA-3; H: SLC27A2 on OMEGA-6; I: GNG3 on DELTA9; J: SLC27A2 on Fat. The chart titles indicate the marker and the significant P-value of the linear regression analysis.
Figure 6. Phenotypic classifications and their associated gene networks. A total of 52 associations were orchestrated for gene networks with 19 genes. Four carcass traits, five saturated fatty acids, seven monounsaturated fatty acids, four polyunsaturated fatty acids, two trans-fatty acids and five traits related to enzyme activities or others are shown as Dark gray, Blue, Dark blue, Orange, Aqua and Green colors, respectively.
DISCUSSION
Candidate gene approaches have been widely used to discover and localize causative genes for quantitative traits or complex phenotypes. There are three ways to choose candidate genes to map quanti-tative trait loci (QTL) [9]. The physiological approach is based on the genes with known biological functions and actions involved in the development or physiol-ogy of the trait of interest. The positional cloning ap-proach considers genes that are located in the neigh-borhood of previously identified QTL regions. The third method is the comparative approach, which takes loci where polymorphisms are known to have a phenotypic effect in one species and explores them as candidates for similar variation in other species. In fact, we used all of these approaches to select candi-date genes (Supplementary Material: Table S1) for identification of genetic markers responsible for vari-ation in quantitative traits using a Wagyu×Angus F1
reference population (the present study) and a Wagyu x Limousin F2 reference population [9 -11]. The
Wagyu×Angus F1 reference population included 43
Wagyu bulls, an unknown number of Angus dams and their potential 791 F1 progeny, while the Wagyu x
Limousin F2 reference population consisted of 6 F1
bulls, 113 F1 dams and 246 F2 progeny. With the
re-gression analysis, our present study determined the best single-gene associations for 10 traits (Figure 3); the best two-gene networks for 9 traits (Figure 4); and the best three-gene networks for 8 traits (Figure 5), respectively. These associations/networks were or-chestrated by a total of 19 genes, including ABCA1,
APOB, ASB3, CAPN1, CAPN12, CAST, CRH, DSEL,
EFEMP1, FADS2, GNG3, LIPE, PLTP, RCAN1,
SLC27A1, SLC27A2, TFB2M, TNF and UTS2R. In the Wagyu x Limousin F2 reference population,
regres-sion analysis revealed 24 genes that control significant associations/networks for 19 economically important traits, including APOA1, APOE, BAK1, CAPN1,
CAPN12, CAPN14, CRHR1, CRHR2, CRP, FABP3,
HS6ST1, MTFR1, PON1, PNPLA2, RAB2A, RCAN1,
SCD1, SLC2A2, SLC27A2, TFAM, TFB1M, UCN3,
UTS2R and UQCRC1 [9 - 11].
both reference populations and they are CAPN1,
CAPN12, RCAN1, SLC27A2 and UTS2R. This result was not unexpected. First, although Wagyu cattle were used as a sire breed to develop both reference populations, dam breeds were quite different between them: Angus for the F1 population and Limousin for
the F2 population. Angus cattle were developed from
cattle native to the counties of Aberdeenshire and Angus in Scotland, while Limousin cattle are a breed of highly muscled beef cattle originating from the
Limousin and Marche regions of France
(http://www.ansi.okstate.edu/breeds/cattle/). Se-cond, F1 progeny are usually less variable from one
another compared to the F2 offspring. Third, the
number of traits was quite different between both reference populations. In the Wagyu×Angus F1
ref-erence population, we measured six carcass pheno-types and twenty-four fatty acid composition traits including six saturated fatty acids, seven monoun-saturated fatty acids, four polyunmonoun-saturated fatty acids, two trans-fatty acids and five traits related to enzyme activities/others. In the Wagyu x Limousin F2
refer-ence population, we focused on a total of 19 pheno-typic measurements, which can be classified into three categories: five carcass measurements, six eating quality traits and eight fatty acid composition meas-urements [9]. Lastly, trait ontology is also different. For example, beef marbling score was measured based on the Japanese standard in the F1 population
(present study), while based on the US standard in the F2 population [9].
Crossbreeding of two divergent breeds is as-sumed to produce a relatively large amount of heter-ozygous animals due to the fixation of opposite alleles in both breeds. However, F1 progeny produced in the
present study using Wagyu sires and Angus dams did not show such a trend. Among 168 polymorphic markers that were successfully scored, none of them produced all heterozygotes in the F1 population. Only
63 SNPs (37.5%, 63/168) had a likely fixed allele in one of the parent populations (allele frequency ≥ 0.9), including 38 that passed and 25 that failed the Har-dy-Weinberg equilibrium test (Supplementary Mate-rial: Table S2). In fact, 109 of the 168 (64.88%) markers shared the same minor allele, while the opposite al-leles were the minor alal-leles between the sire and dam populations only in 59 of 168 (35.12%) markers (Sup-plementary Material: Table S2). Although 44 of 75 (58.67%) tagged markers showed significant differ-ences in both genotype frequencies and allele fre-quencies between the sire and F1 offspring
popula-tions, the HET estimates showed no differences in most of markers (52 of 75, 69.33%) between them (Supplementary Material: Table S2). In a Wagyu x
Limousin F2 reference population, Jiang and
col-leagues (2009) [9] observed 1/3 each of additive, dominant and overdominant QTMs for single marker
– single trait associations. However, among 113 single markers – single trait associations identified in the present study, only 9 (7.96%, 9/113) were observed with additive, while 73 (64.60%, 73/113) and 31 (27.43%, 31/113) showed the dominant and over-dominant effects, respectively (Table 1) in the Wagyu x Angus F1 population. In a specific locus, these
re-sults provide initial evidence that heterosis produced by crossbreeding of different breeds might result from the changes of gene action modes rather than from the increased number of heterozygous animals.
Carcass traits are important to determine pro-duction efficiency and beef yield. In the present study, we found that TNF, a nuclear-encoded mitochondrial gene, significantly affected BMS. TNF is a cytokine that plays critical roles in the regulation of a wide spectrum of biological processes including cell pro-liferation, differentiation, apoptosis, lipid metabolism, and coagulation [22]. Polymorphisms in TNF are as-sociated with obesity, immune-inflammatory, and cardiovascular diseases [23-24]. In mice, TNF in-creased triacylglycerol and diacylglycerol accumula-tion in skeletal muscle by suppressing AMPK activity via transcriptional up-regulation of protein phospha-tase 2C and fatty-acid oxidation [25]. Our results fur-ther confirmed the roles of TNF in intramuscular fat metabolism.
Obtaining higher values in REA and lower val-ues in BFT represent two major breeding objectives in the beef industry. Our study indicated that RCAN1
and ASB3 can significantly impact REA and BFT, re-spectively. RCAN1 is a key regulator of calcineu-rin-nuclear factor of activated T-cells signaling path-way, which has essential roles in growth and differ-entiation in skeletal muscle [26-27]. In the present study, RCAN1 showed a dominant effect on REA, which is the most important trait of muscle growth in beef cattle. The finding consists well with its role in muscle growth. ASB3 is a member of the ankyrin re-peat and SOCS box-containing (ASB) family, and it can mediate ubiquitination and degradation of tumor necrosis factor receptor II [28]. Until now, little is known about ASB3. In the present study, we found this gene has an overdominant effect on BFT.
Three genes, including TFB2M, CAPN12, and
the templating DNA base [29]. CAPN12 is a member of the calpain (CAPN) large subunit gene family [30]. In the present study, TFB2M, CAPN12, and TNF genes showed dominant effects on HCW. Two genes, TNF
and FTO, also affected both YG and QG in the sin-gle-marker association analysis, implying that these genes play important roles in fat deposition, although we could not establish the genetic networks for these two traits.
To date, many research groups have linked ge-netic markers in CAPN1, CAPN3, and calpastatin (CAST) to beef tenderness [31-33]. Interestingly, we discovered here that both of CAPN1 and CAST genes are involved in gene networks for myristic acid (C14:0), which is positively correlated with tender-ness, suggesting that CAPN1 and CAST genes may affect the tenderness by regulating myristic acid. In general, both CAPN1 and CAST belong to the cal-pain-calpastatin enzyme complexes, which affected the eating quality of meat by regulating the rate of protein degradation [34]. As two well-known genes that are associated with beef tenderness, markers from these two genes have been available as genetic markers for commercial application [35]. But there is a little known about the relationship of these two genes and fatty acid composition phenotypes. This is not surprising because tenderness is usually measured by Warner-Bratzler shear force and temperature, not by fatty acid composition traits. Our results might pro-vide a novel method for genetic improvement of ten-derness in beef cattle.
It is well-known that a diet high in saturated fats tends to increase blood cholesterol levels while diets high in unsaturated fats tend to lower blood choles-terol levels, which in turn have favorable effects on cardiovascular diseases. Unfortunately, since biohy-drogenation occurs in the rumen, beef contains more saturated fatty acids than meat of monogastric ani-mals [36]. About 80% of the fatty acids in beef are composed of only three fatty acids: two are saturated (palmitic (C16:0) and stearic (C18:0)) and one is un-saturated (oleic acid (C18:1)), while the remaining 20% of fatty acids are distributed among 30 different fatty acids [37]. Palmitic acid (C16:0) and stearic (C18:0) account for about 27% and 18% of the fatty acids in beef, respectively. Two genes, TNF and
ABCA1, were involved in the network for palmitic acid (C16:0), while no gene was associated with stea-ric (C18:0). ABCA1 plays a key role in reverse choles-terol transport and stimulates cholescholes-terol and phos-pholipid efflux to apo A-І, which is one of the first
stages in reverse cholesterol transport [38]. Several SNPs in ABCA1 are associated with high-density lip-oprotein cholesterol (HDL-C) levels in human [39-40],
which is a major risk factor for coronary artery disease or obesity. TNF also has important roles in obesity or obesity-linked insulin resistance [41]. Bradley et al (2008) [42] discovered murine adipocytes treated for both 24h and 48h with palmitic acid exhibited a 50-70% increase TNF production, suggested palmitic acid acts directly on adipocytes to modulate cytokine production. Subsequently, it was further confirmed that palmitate induces TNF expression in skeletal muscle cells and mouse monocyte lineage [43-44]. Our results also verified these genes are highly associated with major saturated fatty acids.
Oleic acid (C18:1n9), primarily responsible for soft fat, is a major monounsaturated fatty acid, which accounts for about 33% of the fatty acid in beef, and is considered to have the least negative effect on serum cholesterol concentration [45]. Our results showed
ABCA1, EFEMP1, and SLC27A1 genes are involved in the genetic network for oleic acid composition. In fact, unsaturated fatty acids, including oleic acid, can reg-ulate the expression of key genes involved in HDL metabolism [46]. Specifically, oleic acid can phos-phorylate and destabilize ABCA1, a major gene in HDL metabolism, through a pholipase D2 pathway and a protein kinase C delta pathway [47-48]. Re-cently, oleic acid was also found to repress expression of ABCA1 in RAW macrophages by modulating his-tone acetylation state and LXR-independent post-translational inhibition [49]. Our results confirm the significant relationship of both ABCA1 and oleic acid. Interestingly, since ABCA1 was involved in both sat-urated (palmitic acid) and unsatsat-urated fatty acid traits (oleic acid), we note the same genotype/QTM in the same marker might have different effects on these two types of fatty acid traits, i.e., for ABCA1#7 marker, AA genotype animals had higher palmitic acid and lower oleic acid levels than that of AG+GG animals. EFEMP1 is a member of the fibulin family of extra-cellular glycoproteins which are characterized by a fibulin-type C-terminal domain preceded by tandem calcium-binding epidermal growth factor (EGF)-like modules [50-51]. SNPs of EFEMP1 affect birth length and growth rate in children [52-53]. Little is presently known about the relation of EFEMP1 and fatty acid composition; however, our results show EFEMP1
significantly affected oleic acid concentration in beef. SLC27A1 is a plasma membrane protein expressed in adipose tissue, heart, and skeletal muscle [54]. Previ-ous studies have demonstrated that depletion of SLC27A1 led to a redistribution of postprandial fatty acid uptake and triglyceride deposition in adipose tissue and muscle of mice [55-56]. In a Wag-yu×Limousin reference population, we reported
fat depth (SFD) and an overdominant effect on SFA [10]. The present study indicated a dominant effect of
ABCA1 and an overdominant effect of SLC27A1 in oleic acid (C18:1n9). The above results strongly sug-gest ABCA1 and SLC27A1 are involved in fatty acid and adipose tissue metabolism.
The major polyunsaturated fatty acids found in beef are linoleic acid (C18:2n6/OMEGA-6) (about 3.5%) and alpha-linolenic acid (C18:3n3/OMEGA-3) (about 1.5%). They are both essential fatty acids which cannot be produced in the human body and must be obtained from the diet. Ideally, intake of OMEGA-6 fatty acids should be no more than 10 times that of OMEGA-3 fatty acids [57]. But in fact, the ratio of OMEGA-6 to OMEGA-3 in Western diets is 15/1-16.7/1 or more [58]. In human, the levels of OMEGA-3 or OMEGA-6 polyunsaturated fatty acid in serum were significantly associated with genetic var-iants of NOS3 and FADS1 respectively [59-60], but our current study did not discover any significant associ-ation between FADS and OMEGA-6 in beef. Instead, we found SLC27A2 with an additive effect on OMEGA-6 and TFB2M with an overdominant effect on the OMEGA 6:3 RATIO, while CRH with an over-dominant effect on OMEGA-3 and a over-dominant effect on the OMEGA 6:3 RATIO in beef. SLC27A2 plays a key role in lipid biosynthesis and fatty acid degrada-tion. In the previous study, SLC27A2 was associated with SFD and KPH in beef cattle [9], and Wang et al
(2007) [61] reported that a polymorphism in porcine
SLC27A2 gene was associated with fat meat percent-age and backfat traits. Our results suggested that
SLC27A2 may play a new role in regulating polyun-saturated fatty acid synthesis. CRH plays an im-portant role as the major hypothalamic releasing fac-tor for pituitary adrenocorticotropin (ACTH) secre-tion [62], which regulates cortisol level. Cortisol has profound metabolic effects, such as inhibiting glucose uptake and stimulating fat breakdown. SNPs of CRH
in a Charolais-cross steer population were highly as-sociated with end-of-test rib-eye area [63]. Our pre-viously study demonstrated that CRH was signifi-cantly associated with marbling and subcutaneous fat depth (SFD) in a Wagyu×Limousin F2 population [64].
In the present study, we discovered a new role for
CRH in lipid metabolism, i.e., it is significantly asso-ciated with both OMEGA-3 and the OMEGA 6:3 RATIO. In brief, we provided novel evidence of
SLC27A2, TFB2M, and CRH genes in polyunsaturated fatty acid metabolism.
CLA positively affects human health by inhibit-ing carcinogenesis, reducinhibit-ing fat deposition, and re-ducing serum lipids [65]. Ruminant fats in meat are the primary dietary CLA sources for humans because
plants do not synthesize CLA [66]. Three genes,
EFEMP1, PLTP, and DSEL, were involved in the CLA network. PLTP is a lipid transfer protein that belongs to the lipopolysaccharide family. Previous reports revealed that plasma PLTP activity is elevated in type 2 diabetes mellitus, and obesity, with a decrease in PLTP being observed after weight loss [67-68]. Higher PLTP activity could contribute to elevated cardio-vascular risk in the presence of obesity and insulin resistance [69]. Recently, a genome-wide association study showed a SNP locus of PLTP is significantly associated with HDL-cholesterol level in human, which is a risk factor of coronary heart disease [70-71]. In the present study, our association result also im-plied that PLTP may affect lipid level by regulating CLA. This is a good clue for improving the level of CLA in beef production by using genomic markers if we consider PLTP as a good candidate for decreasing the risk of coronary heart disease. DSEL acts as a chondroitin-glucuronate C5 epimerase, converting D-glucuronic acid to L-iduronic acid, and catalyzing the formation of dermatan sulfate from chondroitin sulfate [72]. Our previous study found DSEL has an overdominant effect on R2 (calculated as (16:1/16:0) × 100%) [11]. Now a different role has been discovered for the relationship between DSEL and CLA. Inter-estingly, the same genetic network is also responsible for both CLA and palmitoleic acid (C16:1n7). Overall, we discovered three different effects, an overdomi-nant effect for PLTP and dominant effects for both
EFEMP1 and DSEL, which are involved in the same CLA network, suggesting the regulation of CLA may be more complex.
Beef fat is not only an excellent source of CLA, but it also contains large amounts of trans-vaccenic acid (trans-18:1n7t, TVA), which can be converted to CLA in the human body [73]. DELTA9 desaturase, the rate-limiting enzyme of MUFA, catalyzes the intro-duction of a double bond between carbons 9 and 10 of saturated fatty acids, such as palmitic (16:0) and stea-ric (18:0) acids, to yield palmitoleic (16:1n7) and oleic (18:1n9) acids, respectively, and also converts TVA to CLA [74-75]. We found that GNG3 is associated with DELTA9 desaturase. GNG3 is one of the gamma subunits in the G protein subunit gene family, which is involved as modulators or transducers of various transmembrane signaling systems. Mice with a defi-ciency of GNG3 are lean and show resistance to opi-oids and diet-induced obesity [76]. But until now, the role of GNG3 was unclear. Our current results indi-cate that the GNG3 gene plays an important role in the conversion process from saturated fatty acid to un-saturated fatty acid.
differ-ent gene networks were associated with important traits, i.e., BMS, REA, BFT, HCW, myristic acid (C14:0), palmitic acid (C16:0), oleic acid (C18:1n9), oleic acid (C18:1n9), OMEGA-3, OMEGA-6, OMEGA 6:3 RATIO, DELTA9, and CLA, in our Wagyu x An-gus F1 population. Our present work also provides a
novel view on origin of heterosis as a result of gene (allele) action changes during crossbreeding of dif-ferent breeds. Furthermore, the SNPs evaluated in the present study are strong candidates for mark-er-assisted selection in the genomic improvement of carcass, meat quality, and healthful products of beef cattle.
Supplementary Material
Table S1: Gene symbols, name, GenBank references,
GO/pathway and