Available online on 15.06.2019 at http://jddtonline.info
Journal of Drug Delivery and Therapeutics
Open Access to Pharmaceutical and Medical Research
© 2011-18, publisher and licensee JDDT, This is an Open Access article which permits unrestricted non-commercial use, provided the original work is properly cited
Open Access
Research Article
Method development, validation and comparative study of generic Vs.
branded generic formulations of amoxicillin trihydrate in capsule dosage
form
Gandhi
Santosh V. *, Mahajan Mohitosh R.
Department of Pharmaceutical Quality Assurance, All India Shri Shivaji Memorial Society’s College of Pharmacy, Kennedy Road, Near R.T.O., Pune, Maharashtra, India-411001
ABSTRACT
The present work relates to development and validation of simple, precise and sensitive UV spectrometric and high-performance thin layer chromatographic (HPTLC) method for the analysis of Amoxicillin Trihydrate in Capsule dosage form. Method were developed and applied for comparative study of generic vs branded generic formulations of Amoxicillin Trihydrate. Amoxicillin Trihydrate in methanol shows maximum absorbance at 229 nm and the data of linear regression analysis indicated a good linear relationship over the concentration range of 5-30 µg/ml with a correlation coefficient (R2) 0.998 by UV- Spectroscopy and the concentration range of 2000-12000 ng/band with a correlation coefficient (R2) 0.997 by HPTLC. The main objective was to compare and evaluate the price and quality of branded generic and generic formulations of Amoxicillin Trihydrate 250 mg Capsule. The evaluation parameters like content of active ingredients, content uniformity test, mass variation, disintegration test, and in vitro release studies were performed as described in Indian Pharmacopeia 2010.
Keywords: Branded Generic, Generic, Quantitative and Qualitative Determination, Ultraviolet Spectroscopy, HPTLC, Comparative Studies.
Article Info:Received 23 April 2019; Review Completed 25 May 2019; Accepted 29 May 2019; Available online 15 June 2019
Cite this article as:
GandhiSV, Mahajan MR, Method development, validation and comparative study of generic Vs. branded generic
formulations of amoxicillin trihydrate in capsule dosage form, Journal of Drug Delivery and Therapeutics. 2019; 9(3-s):186-192 http://dx.doi.org/10.22270/jddt.v9i3-s.2821
*Address for Correspondence:
Dr. Santosh V. Gandhi, Professor, AISSMS College of Pharmacy, Kennedy Road, Near R.T.O, Pune -411001, Maharashtra, India.
INTRODUCTION
Analytical chemistry spreads its application in many allied areas. Especially in the pharmaceutical industry; quality of the manufactured drugs in tablets, solutions, suspension or other dosage form must be carefully controlled. Slight variation in composition or in the purity of drug itself can affect therapeutic value. Therefore, there is constant need to develop newer and better methods for pharmaceutical analysis. The main objective of this study is to carry comparative study and evaluate the price and quality for certain drugs for their IPQC tests and dissolution studies in Branded Vs Generic solid dosage forms. As there is belief that due to its cheaper cost and non-popularity generic medicines are of poor quality. The marketing cost is also saved, government takes responsibility to decide the price of medicines and due to competition between manufacturers the cost of generic medicines is less compare to branded ones. In case of branded medicines, the time and its development cost need to be paid more for the original company that’s why the branded medicines are costlier than the generic medicines [1,2]. The generic and branded generic
formulation of the drug should have same strength, quality
and physicochemical properties [3]. We need to ensure that
both formulations are pharmaceutically and therapeutically same.
Amoxicillin is [[2S [2α,5α,6β, (S*)]]-6-[[Amino(4-hydroxyphenyl) acetyl] amino]-3, 3-dimethyl-7-oxo-4-thia-1-azabicyclo [3.2.0] heptane-2-carboxilic acid]. )1) is an oral semi-synthetic penicillin structurally related to ampicillin. Amoxicillin is β -lactam antibiotic that belong to the group of penicillin. It is semi-synthetic, broad spectrum, acid stable, orally absorbed antibiotics that inhibit bacterial cell, it is normally used for the treatment of common bacterial infection [4].
Various methods were observed during literature survey for the quantitative determination of Amoxicillin Trihydrate, which includes UV [5-9], HPLC [10,11], HPTLC [12-14].
As per the literature survey the data represents that there is no reported comparative study for the estimation of Amoxicillin Trihydrate in pharmaceutical Capsule dosage, hence based on these observations we have developed a comparative study on generic and branded generic formulations for the determination of Amoxicillin Trihydrate in bulk and Capsule dosage form in accordance with International Conference on Harmonization Guidelines[15].
MATERIALS AND METHODS
Reagents and chemicals
Amoxicillin Trihydrate Capsules I.P labeled to contain Amoxicillin Trihydrate 250 mg was purchased from local market. Methanol (AR grade), Methanol (HPTLC grade),
Acetic acid (AR grade), Ethyl acetate (AR grade), were used in study.
Preparation of standard stock solution:
Standard stock solution of drug Amoxicillin Trihydrate was prepared by dissolving 10 mg of drug in 10 ml of methanol to get concentration of 1000 µg/ml. From this standard solution 1 ml was taken in 10 ml volumetric flask and volume was made up with methanol to get solution of concentration 100 µg/ml. Further 1 ml of this solution was diluted to 10 ml with methanol to get resulting solution of concentration 10 µg/ml.
Selection of detection wavelength:
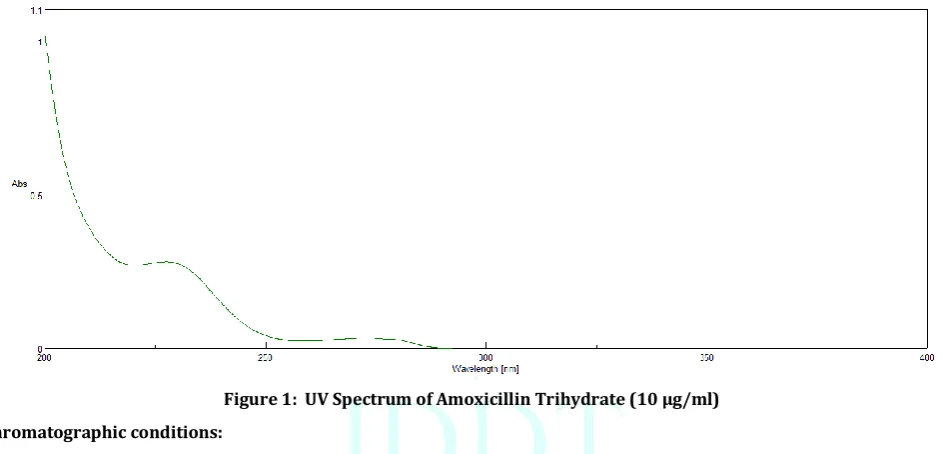
From the standard stock solution (1000 μg/ml) further dilutions were made using methanol and scanned over the range of 200-400 nm and the spectra were obtained. It was observed that the drug showed linear, stable and considerable absorbance at 229 nm. Representative UV spectrum was obtained shown in Figure 1.
Figure 1: UV Spectrum of Amoxicillin Trihydrate (10 µg/ml) Chromatographic conditions:
Chromatographic conditions were optimised by using CAMAG HPTLC system equipped with Camag Linomat V sample applicator, Hamilton syringe (100 µL), Camag TLC Scanner-3 with winCATS software version 1.4.2 and Camag twin- trough chamber (10×10 cm) were used for the present study. Chromatographic separation was established by using precoated Silica gel 60 F254 TLC plates (10×10 cm, layer thickness 0.2 mm, E. Merck, Germany) as stationary phase and Ethyl Acetate: Acetic
acid: Water (6: 2: 2, v/v/v) as mobile phase. Detection wavelength of 229 nm was employed during scanning and the band width 6 mm was fixed during spotting. Representative HPTLC chromatograph is given in Fig. 2.
Preparation of sample solution:
Contents from the twenty capsules of Amoxicillin trihydrate were removed. The quantity of capsule powder equivalent to 10 mg of Amoxicillin Trihydrate (label claim: 250 mg Amoxicillin Trihydrate per Capsule) was transferred to a 10 ml volumetric flask containing 5 ml of methanol. The mixture was subjected for ultra-sonication for the period of 10 min and the resulting sample stock solution was filtered with Whatman filter paper 41 and the volume was made up with the methanol. 1.0 ml of this solution was diluted to 10 ml with the methanol to prepare a final sample stock solution of 100 μg/ml.
RESULTS AND DISCUSSION
Validation of analytical method [15]
Linearity and Range:
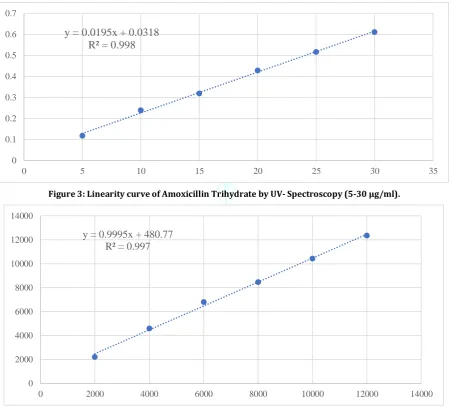
From standard stock solution (1000 μg/ml) of Amoxicillin Trihydrate, solution was prepared containing 100 μg/ml of Amoxicillin Trihydrate in methanol. Further 1ml was taken and diluted to 10ml with methanol in volumetric flask to get 100 μg/ml. This solution was further diluted with methanol to get range of solution containing different concentrations 5-30 μg/ml for the Ultraviolet spectroscopy. Absorbance was recorded. From standard stock solution (1000 μg/ml) of Amoxicillin Trihydrate spotting was done in the concentration range of 2000 – 12000 ng/band for the HPTLC. Area was recorded. The equation of calibration curve by UV- Spectroscopy and HPTLC was found to be y = 0.0195x + 0.0318 and y = 0.9995x + 480.77 respectively. The absorbance/area of drug was plotted against the corresponding concentrations to obtain the calibration curve as shown in Figure 3 and Figure 4 respectively.
Figure 3: Linearity curve of Amoxicillin Trihydrate by UV- Spectroscopy (5-30 µg/ml).
Figure 4: Linearity curve of Amoxicillin Trihydrate by HPTLC (200-1200 ng/band).
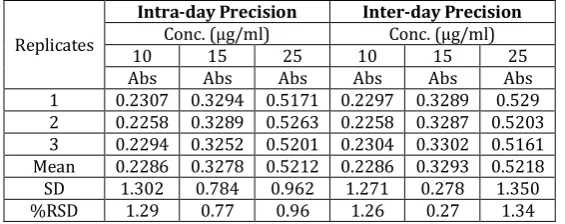
Precision:
The precision of the method was demonstrated by intra-day and inter-day variation studies. In the Intra-day studies, 3 replicates of 3 different concentrations were analyzed in a day and percentage RSD was calculated. For the inter-day
variation studies, 3 different concentrations were analyzed on 3 consecutive days and percentage RSD was calculated. The results obtained for intra-day and inter-day variations by UV-Spectroscopy and HPTLC are shown in Table 1 and Table 2 respectively.
y = 0.0195x + 0.0318
R² = 0.998
0 0.1 0.2 0.3 0.4 0.5 0.6 0.7
0 5 10 15 20 25 30 35
y = 0.9995x + 480.77
R² = 0.997
0 2000 4000 6000 8000 10000 12000 14000
Table 1: Intra-day and Inter-day variation studies data for Amoxicillin Trihydrateby UV-Spectroscopy.
Replicates
Intra-day Precision Inter-day Precision
Conc. (µg/ml) Conc. (µg/ml) 10 15 25 10 15 25 Abs Abs Abs Abs Abs Abs 1 0.2307 0.3294 0.5171 0.2297 0.3289 0.529 2 0.2258 0.3289 0.5263 0.2258 0.3287 0.5203 3 0.2294 0.3252 0.5201 0.2304 0.3302 0.5161 Mean 0.2286 0.3278 0.5212 0.2286 0.3293 0.5218 SD 1.302 0.784 0.962 1.271 0.278 1.350 %RSD 1.29 0.77 0.96 1.26 0.27 1.34
Table 2: Intra-day and Inter-day variation studies data for Amoxicillin Trihydrateby HPTLC.
Replicates
Intra-day Precision Inter-day Precision
Conc. (µg/ml) Conc. (µg/ml) 10 15 25 10 15 25 Area Area Area Area Area Area 1 4487.3 6407.6 10581.8 4424.4 6507.1 10381.9 2 4474.5 6481.7 10636.3 4527 6581.3 10436.4 3 4569.6 6504.3 10518.7 4425.3 6404.4 10418.5 Mean 4510.5 6464.5 10578.9 4458.9 6497.6 10412.3 SD 1.291 0.843 0.589 1.475 1.481 0.278 %RSD 1.28 0.85 0.58 1.48 1.48 0.28
Limit of detection (LOD) and limit of quantitation (LOQ):
From the linearity data the LOD and LOQ was calculated, using the formula LOD = 3.3 σ/S and LOQ = 10 σ/S, where σ = standard deviation of the y intercept of linearity equations and S = slope of the calibration curve of the analyte. The LOD and LOQ by UV-Spectroscopy were found to be 0.455 μg/ml and 1.378 μg/ml, respectively and The LOD and LOQ by HPTLC were found to be 36.24 μg/ml and 109.82 μg/ml, respectively.
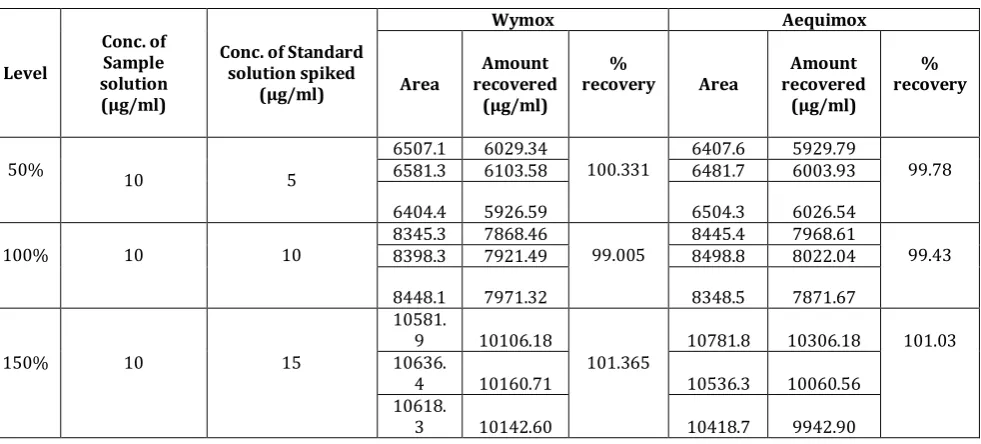
Accuracy:
To check accuracy of the method, recovery studies were carried by spiking the standard 250 mg Capsule sample solution, at three different levels around 50, 100 and 150%. Basic concentration of sample solution chosen was 10 µg/ml for UV and 4000 ng/band for HPTLC of Amoxicillin Trihydrate. % recovery was determined from linearity equation. The results obtained are shown in Table 3 and Table 4.
Table 3: Accuracy of Amoxicillin Trihydrate by UV-Spectroscopy.
Level
Conc. of Sample solution (µg/ml)
Conc. of Standard
solution spiked (µg/ml)
Wymox Aequimox
Absorbance recovered Amount (µg/ml)
%
recovery Absorbance recovered Amount (µg/ml)
% recovery
50% 10 5
0.3191 14.733
98.92
0.3209 14.826
100.536 0.322 14.882 0.3331 15.451
0.3224 14.903 0.3236 14.964
100% 10 10
0.4306 20.451
102.69
0.4331 20.579
102.803 0.4317 20.508 0.4362 20.738
0.4346 20.656 0.4289 20.364
150% 10 15
0.5293 25.513
100.47
0.5273 25.410
101.682 0.5187 24.969 0.5287 25.482
Table 4: Accuracy of Amoxicillin Trihydrate by HPTLC.
Level
Conc. of Sample solution (µg/ml)
Conc. of Standard solution spiked
(µg/ml)
Wymox Aequimox
Area recovered Amount (µg/ml)
%
recovery Area recovered Amount (µg/ml)
% recovery
50% 10 5 6507.1 6581.3 6029.34 6103.58 100.331 6407.6 6481.7 5929.79 6003.93 99.78
6404.4 5926.59 6504.3 6026.54
100% 10 10 8345.3 8398.3 7868.46 7921.49 99.005 8445.4 8498.8 7968.61 8022.04 99.43
8448.1 7971.32 8348.5 7871.67
150% 10 15
10581.
9 10106.18
101.365 10781.8 10306.18 101.03 10636.
4 10160.71 10536.3 10060.56 10618.
3 10142.60 10418.7 9942.90
Assay:
Amoxicillin Trihydrate Capsules I.P labeled to contain Amoxicillin Trihydrate 250 mg formulation analysis was carried out as mentioned under section preparation of sample solution and absorbance/area was recorded. Basic
concentration of sample chosen was 10 μg/ml for UV and 4000 ng/band for HPTLC from Capsule solution. Procedure was repeated for six times. Concentration and % recovery was determined from linear equation. The results obtained by UV-Spectroscopy and HPTLC are shown in Table 5 and Table 6 respectively.
Table 5: Assay of marketed formulation by UV-Spectroscopy.
Sr. No.
Wymox Aequimox
Absorbance Amount Recovered (µg/ml) Recovery % Absorbance Amount Recovered (µg/ml) Recovery %
1 0.2256 9.94 99.38 0.2298 10.154 101.538
2 0.2299 10.16 101.59 0.2306 10.195 101.949
3 0.2238 9.85 98.46 0.2292 10.123 101.231
4 0.2284 10.08 100.82 0.2214 9.723 97.231
5 0.2323 10.28 102.82 0.2244 9.877 98.769
6 0.2306 10.19 101.95 0.2249 9.903 99.026
Mean 0.228 10.084 100.838 0.227 9.996 99.957
SD 0.003 0.164 1.643 0.004 0.189 1.887
%RSD 1.402 1.629 1.629 1.623 1.888 1.888
Table 6: Assay of marketed formulation by HPTLC
Sr. No.
Wymox Aequimox
Area Amount Recovered (µg/ml) Recovery % Area Amount Recovered (µg/ml) Recovery %
1 4564.5 4085.77 102.14 4464.4 3985.62 99.64
2 4497 4018.24 100.46 4597 4118.29 102.96
3 4525.2 4046.45 101.16 4425.3 3946.50 98.66 4 4487.3 4008.53 100.21 4587.8 4109.08 102.73 5 4474.5 3995.73 99.89 4576.6 4097.88 102.45 6 4569.6 4090.88 102.27 4469.7 3990.93 99.77 Mean 4519.683 4040.934 101.023 4520.133 4041.384 101.035
SD 40.337 40.357 1.009 75.258 75.296 1.882
%RSD 0.892 0.999 0.999 1.665 1.863 1.863
In-vitro dissolution studies:[16]
The in-vitro dissolution study was carried out by using IP Type-2 dissolution apparatus at 100 rpm. For the dissolution study randomly 6 Capsules of both branded generic and generic formulations are selected. Media used was RO
Figure 5: Comparison of Dissolution Profile of Generic and Branded generic Capsul Appearance [17]
Capsules produced on a small or a large scale should be uniform in appearance. Visual or electronic inspection should be undertaken to detect any flaws in the integrity and appearance of the capsule. Evidence of physical instability is demonstrated by gross changes in appearance, including hardening or softening, cracking, swelling, mottling, printing mistake or discoloration of the shell. Defective capsules should be rejected.
Size and Shape [17]
Hard capsules are made in a range of sizes, the standard industrial ones in use today for human medicines range from size from 000 (the largest, 1.40 ml) to 5 (the smallest, 0.13 ml) are commercially available.
Unique Identification Markings [17]
Capsule surfaces may bear symbols or other unique identification markings for betteridentification.
Content of Active Ingredients [17]
For this test a sample of the contents is assayed as described in individual monographs and calculates the amount of active ingredient in each capsule. According to IP the range for the content of active ingredient stated in the monograph is based on the requirement that 20 capsules. In the circumstances where 20 capsules cannot be obtained, a
smaller number, which must not be less than 5, may be used, but to allow for sampling errors the tolerances are widened in accordance with the limits and proportionately smaller or larger allowances should be made.
Uniformity of Mass [17]
For this test weigh an intact capsule. Open the capsule without losing any part of the shell and remove the contents as completely as possible. Weigh the shell. The weight of the contents is the difference between the weighing. Repeat the procedure with a further 19 capsules. Determine the average mass. According to IP capsules not more than 2 of the individual masses deviate from the average mass by more than the percentage deviation as per the limits and none deviates by more than twice that percentage.
Disintegration Test [17]
The disintegration apparatus, described in I.P was used for the study. It contains 2 basket rack assembly. Each basket rack assembly consists of 6 glass tubes that are 3 inches long, open at the top and held against 10 mesh size at the bottom. Each Capsule was placed in each tube, and the basket rack was positioned in 1-L beaker of distilled water. The 37±2°C temperature was maintained throughout the study.
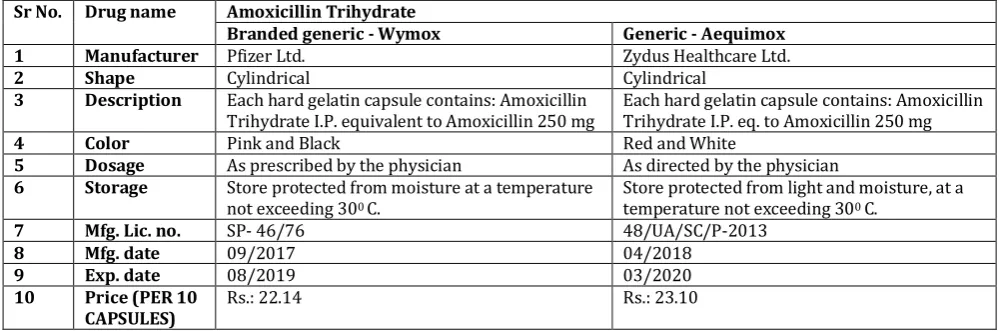
Table 7: Identification test: [17]
Sr No. Drug name Amoxicillin Trihydrate
Branded generic - Wymox Generic - Aequimox 1 Manufacturer Pfizer Ltd. Zydus Healthcare Ltd.
2 Shape Cylindrical Cylindrical
3 Description Each hard gelatin capsule contains: Amoxicillin
Trihydrate I.P. equivalent to Amoxicillin 250 mg Each hard gelatin capsule contains: Amoxicillin Trihydrate I.P. eq. to Amoxicillin 250 mg
4 Color Pink and Black Red and White
5 Dosage As prescribed by the physician As directed by the physician
6 Storage Store protected from moisture at a temperature not exceeding 300 C.
Store protected from light and moisture, at a temperature not exceeding 300 C.
7 Mfg. Lic. no. SP- 46/76 48/UA/SC/P-2013
8 Mfg. date 09/2017 04/2018
9 Exp. date 08/2019 03/2020
10 Price (PER 10
CAPSULES) Rs.: 22.14 Rs.: 23.10
0.00 20.00 40.00 60.00 80.00 100.00 120.00
5 10 20 30 45 60 75 INF (120
min)
%
RE
L
E
ASE
TIME (min)
DISSOLUTION
Table 8: Physiochemical evaluation: [17]
Sr
No. Drug name Amoxicillin Trihydrate Wymox Aequimox
1 Content of active ingredients
(Limits: between 90 and 110 %) UV:HPLC: 98.46-102.82 % 99.89-102.27% UV:HPLC: 98.23-102.97 % 98.66-102.96% 2 Uniformity of mass
(not more than 2 of the individual masses deviate from the average mass by more than the percentage deviation)
Test complies with I.P. Test complies with I.P.
3 Disintegration time
(Not more than 30 min) 18 min 15 min 4 Dissolution test
(Not less than 70 per cent of the stated
amount) % release Not less than 98.53 % % release Not less than 94.89 %
CONCLUSION
Based on such studies; their result and possible outcomes, opinion and doubt about the generic medicines need to be alter in order to help society and availability of medicines in reasonable prices. During the study it was observed that both variants of capsules were found to be in permissible range for all the quantitative and qualitative parameters as described in Indian Pharmacopoeia. And there was no any significant difference between both the branded generic and generic variant.
ACKNOWLEDGEMENT
Authors are thankful to the Principal and Management, AISSMS College of Pharmacy, Pune for providing required facilities for research work.
REFERENCES
1. https://www.huffingtonpost.in/entry/generic-prescriptions_n_6730194
2. https://www.scientificamerican.com/article/whats-the-difference-betw-2004-12-13/
3. https://www.webmd.com/healthy-aging/generic-drugs-answers-to-common-questions#1
4. Nabeel SO, Rana Sámi AL-Saffar, Spectrophotometric Determination of Amoxicillin in Pharmaceutical Preparations, International Journal of Enhanced Research in Science Technology & Engineering, 2015, 4(6), 167-173.
5. Rajan V., Simultaneous Spectrophotometric Estimationof Amoxicillin and Carbocisteine By Secondorder Derivative Spectroscopy Method in Combined Dosage Form, International journal chemical sciences, 2014, 12(4), 1587-1595.
6. Dr. Wadher S, Kalyankar T, Shivpuje S, Lamture S And Khandre S, Development and Validation of Stability Indicating UV Spectrophotometric Method for Simultaneous Estimation of Amoxicillin Trihydrate And Metronidazole In Bulk And In-House Tablet, World Journal Of Pharmaceutical And Medical Research, 2017,3(8), 312-318.
7. Wadher S J., Patwekar S L., Shivpuje S S., Khandre S S., Lamture S S., Manisha P. P, Stability Indicating Assay Methods for Simultaneous Estimation of Amoxicillin Trihydrate And Cloxacillin Sodium in Combined Capsule Dosage Form by UV
-Spectrophotometric Method, European Journal of Biomedical and Pharmaceutical Sciences, 2017, 4(10), 858-864.
8. Pawar* V. K., Garg G., Awasthi R., Nitin K and Kulkarni G. T., Development and Validation of a Simple UV Method for In
Vitro Determination of Amoxicillin Trihydrate in New
Gastroretentive Dosage Form, International Journal of Pure & Applied Chemistry ,2010, 5(4), 329-333.
9. Prakash K., Narayana R P., Shanta K K. And Lakshmi N M., Spectrophotometric Estimation of Amoxicillin Trihydrate In Bulk and Pharmaceutical Dosage Form, European Journal of Chemistry, 2008, 5(S2), 1114-1116.
10. Nalini K S, Madhusmita S, Veerachamy A, Srividya B and Chinmaya K S, Validation of Assay Indicating Method Development of Amoxicillin in Bulk and One of Its Marketed Dosage Form by RP-HPLC, Annals of Chromatography and Separation Techniques, 2016, 2(1), 1014.
11. Mei-chich hsu and Pei-wen hsu, High-Performance Liquid Chromatographic Method for Potency Determination of Amoxicillin in Commercial Preparations and for Stability Studies, Antimicrobial agents and chemotherapy, June 1992, 36(6) 1276-1279.
12. Valentina P1, Dobrina D T, Danka P O, Milen D, Stojan P, Peter A, Validation of TLC – Densitometric Method for Quality Control of Amoxicillin in Dosage Drug Products, World Journal of Pharmacy and Pharmaceutical Sciences, 2014, 3(5), 995-1008.
13. Kanchan C and Vishnu C, Development and Validation of Stability indicating HPTLC Method for Estimation of Carbocisteine and Amoxicillin as Bulk Drug and in Drug Formulation by Derivatization, International Journal of PharmTech Research, 2018, 11(2), 108-118.
14. Dhoka M.V., Gawande V.T., Joshi P.P, HPTLC Determination of Amoxicillin Trihydrate and Bromhexine Hydrochloride in Oral Solid Dosage Forms, Journal of pharmaceutical science and research, 2010, 2(8), 477-483.
15. ICH Q2 (R1): for validation of analytical procedures: text and methodology, 2005
16. Indian Pharmacopoeia 2010, Government of India Ministry of Health and Family welfare, Ghaziabad, New Delhi, Volume II: 813.

![Table 8: Physiochemical evaluation: [17]](https://thumb-us.123doks.com/thumbv2/123dok_us/1192965.1622169/7.595.49.543.71.214/table-physiochemical-evaluation.webp)
