Available online on 15.06.2019 at http://jddtonline.info
Journal of Drug Delivery and Therapeutics
Open Access to Pharmaceutical and Medical Research
© 2011-18, publisher and licensee JDDT, This is an Open Access article which permits unrestricted non-commercial use, provided the original work is properly cited
Open Access
Research Article
Development and Validation of Analytical Method for Simultaneous Estimation of
Formoterol Fumarate Dihydrate and Fluticasone Propionate from Bulk and Dry
Powder Inhaler Formulation
Prof. Godge Rahul K*, Miss. Satpute Soniya S., Prof. Sagar Magar M.
Department of Pharmaceutical Chemistry, Pravara Rural College of Pharmacy, Loni tal. Rahata dist. Ahemadnagar, India
ABSTRACT
A method was developed and validated for analysis of Formoterol Fumarate and Fluticasone Propionate in dry powder inhaler formulations. Separation was achieved on a HiQ Sil C18HS, 250×4.6 mm, 5 µm column using a mobile phase consisting of Acetonitrile: 0.01 M Ammonium Dihydrogen Phosphate solution (80:20 %v/v) at a flow rate of 1ml/min PDA detection at 215.0 nm. This method is validated according to ICH guidelines, which include linearity, precision, accuracy, specificity, robustness. The result obtained were within the acceptance criteria as per ICH guidelines.
Keywords: formoterol fumarate dihydrate, fluticasone propionate, buffer, HPLC.
Article Info:Received 25 April 2019; Review Completed 27 May 2019; Accepted 31 May 2019; Available online 15 June 2019
Cite this article as:
Godge RK, Satpute SS, Magar SM, Development and Validation of Analytical Method for Simultaneous Estimation of Formoterol Fumarate Dihydrate and Fluticasone Propionate from Bulk and Dry Powder Inhaler Formulation, Journal of
Drug Delivery and Therapeutics. 2019; 9(3-s):212-222 http://dx.doi.org/10.22270/jddt.v9i3-s.2827
*Address for Correspondence:
Prof. Rahul Godge K, Department of Pharmaceutical Chemistry, Pravara Rural College of Pharmacy, Loni tal. Rahata dist. Ahemadnagar, India
INTRODUCTION
Ultraviolet-Visible Absorption Spectroscopy:
This deals with the absorption of electromagnetic radiation in the wavelength region of 160 to 780 nm. UV absorption spectroscopy deals with absorption of light by a sample in the Ultra Violet (UV) region (190 - 380 nm), while Visible region absorption spectroscopy (colorimetric) deals with absorption of light by a sample in the Visible region (380 - 780nm). Absorption of UV – Visible light causes promotion of a valence electron from bonding to antibonding orbitals. There are 4 types of transitions observed in UV visible spectroscopy, *, *, n *, and n *. It is not always necessary that the excitation of the electron take place from bonding orbital to anti-bonding orbital when the compound is exposed to UV visible light. The relation between the excitation coefficient and transition probability is given as;
Emax = 0.87 1020 p a
Where,
Emax = excitation coefficient.
p = transition probability with values from 0 to 1. a = target area of the absorbing system (Chromophore).
High Performance Liquid Chromatography The Principle of Chromatographic Separation:
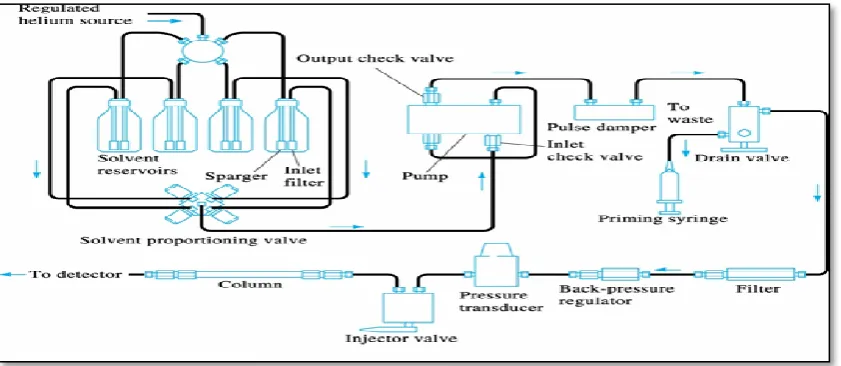
Instrumentation:
Figure 1: HPLC Instrumentation
MATERIAL AND METHODS
Formoterol fumarate dihydrate: Active pharmaceutical ingredient (API) was supplied by prerana enterprises (ahmednagar).
Fluticasone propionate: Active pharmaceutical ingredient (API) was supplied by prerana enterprises (ahmednagar) All chemicals used throughout the work were of analytical grade and the solvents were of HPLC grade purchased from Merck, Mumbai.
Reagents and chemicals
Sr. No. Name Specification Manufacturer/Supplier
1 Acetonitrile HPLC grade Merck
2 Methanol HPLC grade Merck
3 Orthophosphoric acid A.R Merck
4 Ammonium dihydrogen phosphate A.R Merck
5 Potassium dihydrogen phosphate A.R Merck
6 Sodium dihydrogen phosphate A.R Merck
7 Water HPLC grade Merck
Apparatus/Instruments Used: Apparatus/Instruments
Sr. No Name Model Manufacturer/Supplier
1 Weighing balance AUX 220 Shimadzu
2 Digital pH meter Eq610 EQUIP-TRONICS
3 Sonicator Fast Clean Ultrasonic Cleaner
4 HPLC 2075 JASCO
5 Column HiQ Sil C18HS, 250×4.6mm, 5 µm KYA TECH
Experimental
Development and Optimization of HPLC Method for Formoterol Fumarate Dihydrate and Fluticasone Propionate Method I - Simultaneous Equation Method
Selection of solvent: Methanol is selected as a solvent
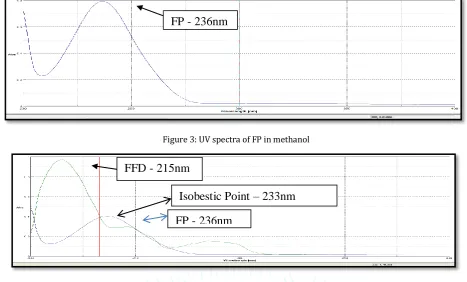
Selection of analytical wavelength:
Figure 3: UV spectra of FP in methanol
Figure 4: Overlain UV spectra of FFD & FP in methanol
Selection of linearity range:
Figure 5: Standard calibration curve for FFD at 215 nm
Figure 6: Standard calibration curve for FP at 236nm
Determination of absorptivity at analytical wavelengths:
Standard absorptivity values of FFD and FP
Drug λ1=215 λ2=236
Formoterol Fumarate Dihydrate ax1= 9.7137 ax2 = 2.961
Fluticasone Propionate ay1 = 1.5829 ay2 = 4.0373
y = 0.1236x - 0.0543
R² = 0.9965
0
0.5
1
1.5
2
2.5
3
0
5
10
15
20
25
A
b
so
rb
an
ce
Concentration (mcg/ml)
Absorb.
Linear (Absorb.)
y = 0.0438x + 0.0125
R² = 0.9911
0
0.2
0.4
0.6
0.8
1
0
5
10
15
20
25
A
b
so
rb
an
ce
Concentration (mcg/ml)
Absorbance
Linear (Absorbance)
Isobestic Point – 233nm
215nm
FP - 236nm
FFD - 215nm
Analysis of Marketed formulation:
Table 1: Analysis of marketed formulation
Sr.
no. components Capsule Label Claim (mcg) % of Amount found* S.D* %R.S.D. *
1 FFD 6 99.60 1.5857 1.5919
2 FP 100 101.18 1.2494 1.2348
* denotes average of three determinations.
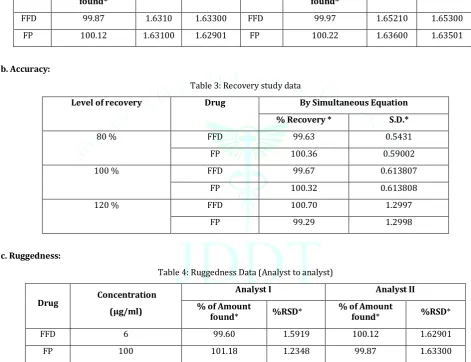
Validation of simultaneous equation method: a. Precision:
Table 2: Precision Study data
Intraday study Inter day study
Drug % of Amount
found* S.D.* % RSD* Drug % of Amount found* S.D.* % RSD*
FFD 99.87 1.6310 1.63300 FFD 99.97 1.65210 1.65300
FP 100.12 1.63100 1.62901 FP 100.22 1.63600 1.63501
b. Accuracy:
Table 3: Recovery study data
Level of recovery Drug By Simultaneous Equation
% Recovery * S.D.*
80 % FFD 99.63 0.5431
FP 100.36 0.59002
100 % FFD 99.67 0.613807
FP 100.32 0.613808
120 % FFD 100.70 1.2997
FP 99.29 1.2998
c. Ruggedness:
Table 4: Ruggedness Data (Analyst to analyst)
Drug Concentration (µg/ml)
Analyst I Analyst II
% of Amount
found* %RSD* % of Amount found* %RSD*
FFD 6 99.60 1.5919 100.12 1.62901
FP 100 101.18 1.2348 99.87 1.63300
d. Limit of detection (LOD) and Limit of quantitation (LOQ):
Method II - Q Analysis or Absorbance Ratio Method
Preparation of Standard Stock Solutions:
Selection of linearity range:
Linearity range was found to be 2-20 for both FFD & FP.
Parameter FFD FP
*L.O.D. (µg/ml) 1.5 2.10
Procedure for analysis:
Analysis of formulation:
Table 5: Analysis of marketed formulation
Sr. no. Capsule
components Label Claim (mcg) % of Amount found* S.D* %R.S.D.*
1 FFD 6 100.86 1.03890 1.03002
2 FP 100 98.32 0.2869 .0291801
Validation of absorbance ratio method:
1. Precision:
Table 6: Precision Study data
Intraday study Inter day study
Drug % of Amount
found* S.D.* % RSD* Drug % of Amount found* S.D. % RSD*
FFD 100.05 1.7937 1.7928 FFD 100.12 1.6937 1.6928
FP 99.94 1.79398 1.7947 FP 99.89 1.69398 1.6947
*Mean of six estimation
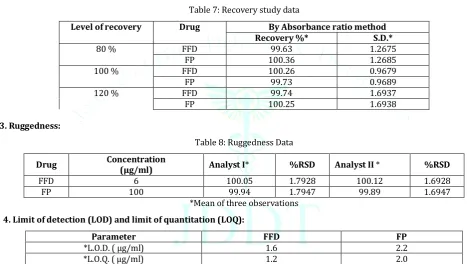
2. Accuracy:
Table 7: Recovery study data
Level of recovery Drug By Absorbance ratio method
Recovery %* S.D.*
80 % FFD 99.63 1.2675
FP 100.36 1.2685
100 % FFD 100.26 0.9679
FP 99.73 0.9689
120 % FFD 99.74 1.6937
FP 100.25 1.6938
3. Ruggedness:
Table 8: Ruggedness Data
Drug Concentration (µg/ml) Analyst I* %RSD Analyst II * %RSD
FFD 6 100.05 1.7928 100.12 1.6928
FP 100 99.94 1.7947 99.89 1.6947
*Mean of three observations
4. Limit of detection (LOD) and limit of quantitation (LOQ):
Parameter FFD FP
*L.O.D. ( µg/ml) 1.6 2.2
*L.O.Q. ( µg/ml) 1.2 2.0
Method –III First Order Derivative Method
Preparation of standard stock solutions:
Selection of analytical wavelength ranges:
Figure 7: Overlain derivative spectra of FFD and FP
Zero Crossing Point
of FFD at 268nm
Zero Crossing Point
Selection of linear concentration ranges:
Figure 8: Calibration curves for FP
Figure 9: Calibration curves for FFD Table 9: Parameters for calibration curves:
Parameters FFD FP
At 236 nm At 268 nm
Linearity range (μg/ml) 2-20 2-20
*Slope 0.00234 0.00078
*Intercept 0.000 0.000
*Regression coefficient (r2) 0.999 0.990
Determination of coefficient of absorptivities (dA/dλ) at analytical wavelength:
The standard Absorptivity values of drugs at the selected wavelengths are:
Table 10: Standard absorptivity values of FFD and FP
Drug λ1=236 λ2=268
Formoterol Fumarate Dihydrate ax1= 2.2264 X 10-2 ax2 = 9.50734X 10⁻⁵
Fluticasone Propionate ay1 = -3.5103 X 10⁻⁴ ay2 = -6.88466X 10⁻³
Analysis of marketed formulation:
Table 11: Results of analysis of marketed formulation
Sr.
no. components Capsule Label Claim (mcg) % amount found* S.D* %R.S.D.*
1 FFD 6 100.25 1.462 1.473
2 FP 100 98.40 1.356 1.383
* Average of six determinations
Method validation:
6.1C.6.1. Precision: 6.1C.6.1.1. Repeatability:
Studies were carried out as described in Method I. The standard deviation (S.D.), % relative standard deviation (%R.S.D.) and standard error (S.E.) were calculated.
y = 0.00078x - 0.000
R² = 0.990
0
0.02
0
5
10
15
20
25
A
mp
lit
u
d
e
Conc.
FP
y = 0.00234x + 0.000
R² = 0.999
0
0.05
0
5
10
15
20
25
A
m
p
lit
u
d
e
Conc.
6.1C.6.1.2. Intermediate precision (Intra-day and inter-day precision):
The Intra and inter-day precision was determined as mentioned in method I. The S.D., % R.S.D. and S.E. were calculated and are shown in Table No.12.
Table 12: Statistical evaluation for precision studies
Precision
Parameter FFD % Mean* FP FFD S.D.* FP FFD % R.S.D.* FP
Intra-day 100.28 99.41 0.6123 1.0303 0.61059 0.0555
Inter-day 99.92 99.95 0.1199 0.0991 0.1199 1.04695
*Average of six determinations
6.1C.6.2. Accuracy:
Table 13: Results of recovery studies
Level of
% Recovery FFD %* Mean Recovery FP FFD S.D.* FP FFD %R.S.D.* FP
80 100.08 9989 0.1916 0.2929 0.1915 0.2936
100 99.56 99.84 0.02524 0.05571 0.2535 0.0558
120 100.04 101.05 0.1100 0.1438 0.1099 0.1423
*Average of three determinations
6.1C.6.3. Limit of Detection (LOD) and Limit of Quantitation (LOQ):
Table 14: LOD and LOQ values
Sr.
No. Component *LOD ( µg/ml) *LOQ (µg/ml)
1. FFD 1.2 2.0
2. FP 1.5 2.4
6.2.4. Method Development for Formoterol Fumarate Dihydrate and Fluticasone Propionate: Selection of Solvent – Mobile Phase was used as diluents for dilutions.
6.2.4.1. Preparation of stock solutions of standard:
The standard FFD, 10 mg and FP, 100 mg were dissolved separately in diluent in separate 100 ml volumetric flasks and volume was made with the same solvent to give stock solutions of 100μg/ml for FFD & 1000 μg/ml for FP.
6.2.4.2. Selection of analytical wavelength: 6.2.4.3.Optimization of mobile phase:
Figure 10: Chromatographic conditions 1 – Mobile phase - Water:ACN(30:70)
Figure 12: Chromatographic conditions 3 - Mobile phase - ACN:Buffer(potassium dihydrogen phosphate) (70:30)
Table 15: Optimized chromatographic conditions for HPLC method
HPLC Column HiQ Sil C18HS, 250×4.6mm, 5 µm
Column temperature Ambient temperature
Mobile Phase Acetonitrile: 0.01 M Ammonium Dihydrogen Phosphate solution (80:20
%v/v)
Flow rate programming Flow rate of 1ml/min
Detection wavelength 215.0 nm
Injection volume 20 μl
Run time 15 min
Figure 13: Typical chromatogram of Combination of FFD & FP obtained in Mobile Phase - Acetonitrile: 0.01 M Ammonium Dihydrogen Phosphate solution
6.2.5. Preparation of standard calibration curves of FFD and FP:
Standard calibration data for FFD
Figure 14: Standard calibration curve for FFD
y = 7074.2x - 4223.2
R² = 0.9927
0
20000
40000
60000
0
2
4
6
8
10
A
rea
Figure 15: Standard Calibration curve for FP
6.2.6. Analysis of the marketed formulation:
Table 16: Results of analysis of capsule formulation by HPLC method
Sr. No.
Drugs Label Claim
( mcg/cap)
Amount Found*
(mcg/cap)
% of Amount found*
1 FFD 6 5.92 98.67
2 FP 100 101.39 101.39
*Average of three determinations
Figure 16: HPLC chromatogram of FFD and FP in capsule formulation
6.2.7.Method validation:
6.2.7.1. Linearity:
Table 17: Linear regression data for calibration curves of FFD and FP for HPLC method
Drugs Linearity range
(μg/ml) Slope y-intercept Regression
coefficient (r2)
FFD 2.4-7.8 7074 4223 0.992
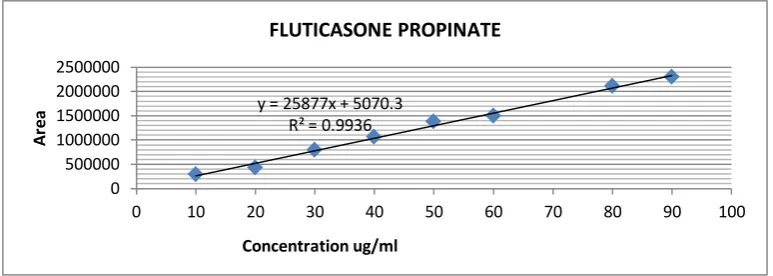
FP 10-90 25877 5070 0.993
Figure 17: Chromatogram of FFD & FP Linearity
y = 25877x + 5070.3 R² = 0.9936
0 500000 1000000 1500000 2000000 2500000
0 10 20 30 40 50 60 70 80 90 100
Ar
ea
Concentration ug/ml
6.2.7.2. Precision:
Table 18: Statistical evaluation for precision studies
Precision
Parameter FFD % Mean* FP FFD S.D.* FP FFD % R.S.D.* FP
Intra-day 100.21 100.71 1.5834 1.9438 1.5800 1.9401
Inter-day 100.45 99.89 1.7762 1.5264 1.7768 1.5204
*Average of six determinations
6.2.7.3.Specificity:
The chromatogram of capsule sample showed only two peaks at retention time of 4.89 ± 0.02 and 9.18 ± 0.02 min for FFD and FP respectively (Fig. No. 25), indicating that there is no interference of the excipients present in the capsule formulation.
6.2.7.4. Accuracy:.
Table 19: Results of recovery studies for HPLC method
Level of
% Recovery Amount present (μg/ml) Total amount recovered (μg/ml) % Recovery
FFD FP FFD FP FFD FP
80 10.8 10.8 180 180 10.87 10.68 181.81 176.43 100.70 98.95 101.00 98.01
10.8 180 10.82 184.23 100.24 100.20
100 12 12 200 200 11.76 12.28 200.29 201.92 98.04136 101.1963 100.14 100.96
12 200 12.33 200.61 101.5747 100.30
120 13.2 13.2 220 220 13.30 13.04 217.33 224.01 100.81 98.79 101.82 98.78
13.2 220 13.59 223.05 100.69 101.39
Table 20: Statistical validation of recovery data for HPLC method
Level of
% Recovery % Mean Recovery* S. D.* % R.S.D.*
FFD FP FFD FP FFD FP
80 99.96 100.46 1.7862 1.5464 1.7868 1.5504
100 100.27 100.47 1.9400 0.4319 1.9347 0.4298
120 100.10 100.66 0.8292 1.3403 0.8283 1.3314
*Average of three determinations
6.2.7.5. Robustness:
Table 21: Results of robustness testing for HPLC method
Flow Rate (ml/min) Retention time Tailing factor
FFD FP FFD FP
0.9 4.43 8.39 1.264 1,18
1.0 4.78 9.22 1.26 1.19
1.1 5.45 10.25 1.27 1.20
pH of Buffer
3.4 3.98 9.08 1.31 1,20
3.5 4.78 9.22 1.26 1.19
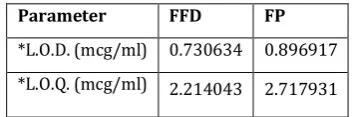
6.2.7.6.Limit of Detection and Limit of Quantitation:
Table 22:LOD and LOQ values for HPLC method
Parameter FFD FP
*L.O.D. (mcg/ml) 0.730634 0.896917 *L.O.Q. (mcg/ml) 2.214043 2.717931
RESULTS AND DISCUSSION
UV SPECTROPHOTOMETRIC METHODS:
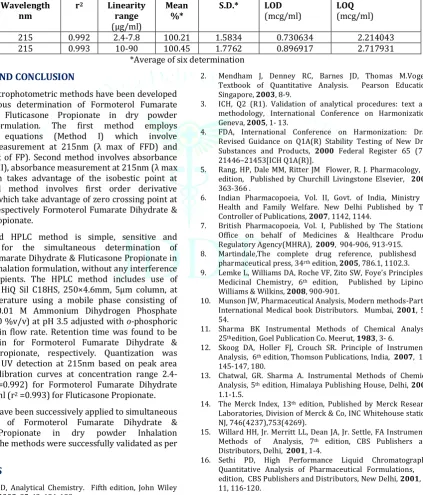
Table 23: Result & statistical validation data for marketed formulation by UV spectrophotometric methods
Method Drug Wavelength
nm Linearity range(μg/ml) r
2 Mean
%* S.D.* LOD (µg/ml) LOQ (µg/ml)
Simultaneous equation method
FFD 215 2-20 0.996 99.87 1.6310 1.5 1.3
FP 236 2-20 0.991 100.12 1.63100 2.10 2.0
Absorption
ratio method FFD FP 215 233 2-20 2-20 0.996 0.991 100.86 98.32 1.03890 0.2869 2.2 1.6 1.2 2.0
Ist order
derivative FFD FP 236 268 2-20 2-20 0.999 0.990 100.25 98.40 1.462 1.356 1.5 1.2 2.0 2.4
*Average of six determination
HPLC Method:
Table 24: Result & statistical validation data for marketed formulation by HPLC method
Drug Wavelength
nm r
2 Linearity
range
(μg/ml)
Mean
%* S.D.* LOD (mcg/ml) LOQ (mcg/ml)
FFD 215 0.992 2.4-7.8 100.21 1.5834 0.730634 2.214043
FP 215 0.993 10-90 100.45 1.7762 0.896917 2.717931
*Average of six determination
SUMMARY AND CONCLUSION
Three UV spectrophotometric methods have been developed for simultaneous determination of Formoterol Fumarate Dihydrate & Fluticasone Propionate in dry powder Inhalation formulation. The first method employs simultaneous equations (Method I) which involve absorbance measurement at 215nm (λ max of FFD) and 236nm (λ max of FP). Second method involves absorbance ratio (Method II), absorbance measurement at 215nm (λ max of FFD) which takes advantage of the isobestic point at 233nm. Third method involves first order derivative spectroscopy which take advantage of zero crossing point at 236, 268nm respectively Formoterol Fumarate Dihydrate & Fluticasone Propionate.
The developed HPLC method is simple, sensitive and reproducible for the simultaneous determination of Formoterol Fumarate Dihydrate & Fluticasone Propionate in dry powder Inhalation formulation, without any interference from the excipients. The HPLC method includes use of reverse phase HiQ Sil C18HS, 250×4.6mm, 5µm column, at ambient temperature using a mobile phase consisting of Acetonitrile: 0.01 M Ammonium Dihydrogen Phosphate solution (80:20 %v/v) at pH 3.5 adjusted with o-phosphoric acid at 1ml/min flow rate. Retention time was found to be 4.89, 9.22 min for Formoterol Fumarate Dihydrate & Fluticasone Propionate, respectively. Quantization was achieved with UV detection at 215nm based on peak area with linear calibration curves at concentration range 2.4-7.8μg/ml (r2 =0.992) for Formoterol Fumarate Dihydrate and 10-90μg/ml (r2 =0.993) for Fluticasone Propionate. The methods have been successively applied to simultaneous determination of Formoterol Fumarate Dihydrate & Fluticasone Propionate in dry powder Inhalation formulation. The methods were successfully validated as per ICH guidelines.
REFERENCES
1. Christen GD, Analytical Chemistry. Fifthedition, John Wiley
and Sons, 2003, 35-42, 131-132.
2. Mendham J, Denney RC, Barnes JD, Thomas M.Vogel’s
Textbook of Quantitative Analysis. Pearson Education,
Singapore, 2003, 8-9.
3. ICH, Q2 (R1). Validation of analytical procedures: text and
methodology, International Conference on Harmonization,
Geneva, 2005, 1- 13.
4. FDA, International Conference on Harmonization: Draft
Revised Guidance on Q1A(R) Stability Testing of New Drug
Substances and Products, 2000 Federal Register 65 (78),
21446–21453[ICH Q1A(R)].
5. Rang, HP, Dale MM, Ritter JM Flower, R. J. Pharmacology, 6th
edition, Published by Churchill Livingstone Elsevier, 2007, 363-366 .
6. Indian Pharmacopoeia, Vol. II, Govt. of India, Ministry of
Health and Family Welfare. New Delhi Published by The
Controller of Publications, 2007, 1142, 1144.
7. British Pharmacopoeia, Vol. I, Published by The Stationery
Office on behalf of Medicines & Healthcare Products
Regulatory Agency(MHRA), 2009, 904-906, 913-915.
8. Martindale,The complete drug reference, publishesd by
pharmaceutical press, 34rth edition, 2005, 786.1, 1102.3.
9. Lemke L, Williams DA, Roche VF, Zito SW, Foye’s Principles of
Medicinal Chemistry, 6th edition, Published by Lipincott
Williams & Wilkins, 2008, 900-901.
10. Munson JW, Pharmaceutical Analysis, Modern methods-Part B,
International Medical book Distributors. Mumbai, 2001,
51-54.
11. Sharma BK Instrumental Methods of Chemical Analysis,
25thedition, Goel Publication Co. Meerut, 1983, 3- 6.
12. Skoog DA, Holler FJ, Crouch SR. Principle of Instrumental
Analysis, 6th edition, Thomson Publications, India, 2007, 1-3,
145-147, 180.
13. Chatwal, GR. Sharma A. Instrumental Methods of Chemical
Analysis, 5th edition, Himalaya Publishing House, Delhi, 2004,
1.1-1.5.
14. The Merck Index, 13th edition, Published by Merck Research
Laboratories, Division of Merck & Co, INC Whitehouse station, NJ, 746(4237),753(4269).
15. Willard HH, Jr. Merritt LL, Dean JA, Jr. Settle, FA Instrumental
Methods of Analysis, 7th edition, CBS Publishers and
Distributors, Delhi, 2001, 1-4.
16. Sethi PD, High Performance Liquid Chromatography,
Quantitative Analysis of Pharmaceutical Formulations, 1st
edition, CBS Publishers and Distributors, New Delhi, 2001,