Preliminary assessment of the foraging behaviour and population dynamics of a cryptic
population of the endangered New Zealand sea lion
B. Louise Chilvers
Marine Species and Threats Team, Department of Conservation, PO Box 10420, Wellington 6143, New Zealand Present address: Wildbase, IVABS, Massey University, Private Bag 11222, Palmerston North 4400, New Zealand (Email: b.l.chilvers@massey.ac.nz)
Published online: 24 October 2017
Abstract: The endangered New Zealand sea lion (Phocarctos hookeri) has recently been confirmed as breeding on Stewart Island/Rakiura, southern New Zealand. This area is thought to have the largest number of sea lion pups born outside of the New Zealand subantarctics. However, the sparse distribution and cryptic behaviour of this population means known human threats and their effects on the population will be difficult to determine, limiting conservation priority setting and management. This research aimed to investigate the foraging behaviour of adult females from the population and examine what information is available to help determine current population parameters including undertaking pup surveys in the area. Foraging behaviour research was undertaken in the Austral autumn 2012 and 2013, while pup production surveys were undertaken in March each year between 2011 and 2016. Pup production surveys show up to 36 pups are born in the Stewart Island area annually. The foraging behaviour of 14 adult female New Zealand sea lions was characterised by short foraging trips (c. 12 hrs), close to shore or in areas of known upwellings, undertaking short, shallow dives (average 2.5 mins, 60 m). This diving behaviour is intermediate between the foraging behaviours of females from Enderby Island (Auckland Islands), the largest but severely declining population of New Zealand sea lions, and Otago (mainland New Zealand), a smaller, increasing recolonising population. Based on the foraging behaviour and limited population dynamic information collected from the Stewart Island population, it is likely the Stewart Island population has survival and reproductive parameters more like the recolonising Otago population than the declining Auckland Islands population. Such information is critical for determining the impacts of the known direct and indirect human impacts on this small isolated population, which is likely to be important for the survival of the endangered New Zealand sea lion species as a whole.
Keywords: diving; foraging strategies; New Zealand; New Zealand sea lion; Phocarctos hookeri
Introduction
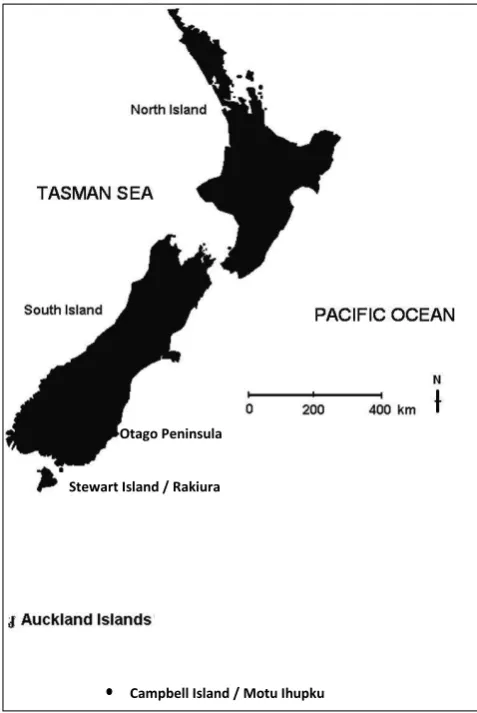
Historically, New Zealand sea lions (Phocarctos hookeri) were distributed throughout New Zealand’s mainland and subantarctic islands. However, during the 1800s they were extirpated from the mainland initially by Polynesian hunting and finally due to European sealing until only the subantarctic island populations remained (Collins et al. 2014). It is now the subantarctic populations that are significantly declining, with the new threat status being driven by the decline of the species at its main breeding area, Auckland Islands (Fig. 1). In 2015, the New Zealand sea lion had its International Union for the Conservation of Nature (IUCN) Red List threat status elevated from Vulnerable to Endangered (Chilvers 2015). Given this change, any new self-sustaining populations of New Zealand sea lions on the New Zealand mainland are likely to be significant for the long-term persistence of the species. Two such mainland re-colonisations have occurred for New Zealand sea lions, one at Otago Peninsula, South Island, New Zealand in 2002 (McConkey et al. 2002) and one at Stewart Island/Rakiura, the most southern of New Zealand’s three main islands, recognised since 2011 (Chilvers & Meyner 2017; Fig. 1). The Stewart Island population has a highly dispersed, cryptic breeding behaviour in heavily forested, isolated areas, unpopulated by humans (pers. obs.). There are known direct (deaths by shooting) and indirect (human disturbance and resource competition) human impacts on this
new, small population including five individuals known to be shot and killed in the last 5 years (Department of Conservation 2017). Considering these impacts and the potential importance of this New Zealand sea lion population, more information is needed to better understand and manage it. However, the isolation of the Stewart Island population and the behaviour of its individuals reduce the ability to assess the Stewart Island population using traditional monitoring methods.
Mark-recapture (resighting) monitoring methods are the benchmark for monitoring populations; however, they usually require a long time-series of data to assess and identify population dynamics and trends, which can be difficult for long-lived, slow-reproducing species (i.e. Sandercock 2007). The collection of such data can be logistically or temporally challenging for endangered marine mammal species due to their aquatic habitat and often small and/or isolated populations, e.g. Galapagos fur seals (Arctocephalus galapagoensis; Trillmich & Limberger 1985) or Hawaiian monk seals (Monachus schauinslandi; Gerrodette & Gilmartin 1990). In such cases, alternative methods may need to be considered for monitoring cryptic, isolated or difficult to monitor species.
Marine top predator foraging behaviour is a product of the physical marine habitat, the abundance and distribution of prey, and the physiological limits of the predator (Costa 1991, 1993; Sala et al. 2012). Since marine predators such as pinnipeds, cetaceans and penguins need to hold their breath while diving, they are constrained by their aerobic metabolism
Otago Peninsula
Campbell Island / Motu Ihupku Stewart Island / Rakiura
Figure 1. New Zealand sea lion breeding locations, including the Auckland Islands, Stewart Island/Rakiura and Otago Peninsula, New Zealand.
when pursuing prey. If they consistently dive for longer than their aerobic capacity, their overall diving efficiency will be lowered and could impact their survival, reproduction rate and offspring survival (McCafferty et al. 1998; Bolnick et al. 2003; Costa et al. 2004; Sala et al. 2012). Consequently, it has been hypothesised that the interspecific variation in marine predator diving behaviour can be correlated with species demographics (Costa et al. 2004; Sala et al. 2012).
This correlation is also thought to occur within species for some pinnipeds (Bradshaw et al. 2004; Costa et al. 2006). For example, the foraging behaviour of New Zealand sea lions has been hypothesised to be related to the demographics of a population (Augé et al. 2011b). Female sea lions at Enderby Island, Auckland Islands (Fig. 1) have the longest and deepest dives of all otariids (Gales & Mattlin 1997; Costa & Gales 2000; Chilvers et al. 2006) and travel some of the greatest distance during a foraging trip (Chilvers et al. 2005). Enderby Island female New Zealand sea lions have two distinct dive profile types or foraging patterns (foraging specialisation): a benthic diving profile; and a deeper, more varied mesopelagic diving profile; with individual females showing only one foraging type across seasons and years (Chilvers et al. 2006; Chilvers & Wilkinson 2009). Both of these foraging strategies result in females exceeding their calculated aerobic dive limits (cADL) on average during 68% of all dives, and this finding, coupled with the extensive distances travelled, indicates that they are
operating at or near their maximum physiological capacity (Chilvers et al. 2006). This foraging behaviour makes them highly susceptible to external impacts, such as the direct and indirect effects of fisheries and local environmental changes because they have limited ability to adapt their foraging behaviour to compensate for these issues (Gales & Mattlin 1997; Costa & Gales 2000; Chilvers et al. 2006; Robertson & Chilvers 2011). Correspondingly, the Enderby Island population has declining pup production (Chilvers & Meyner 2017), late age of first breeding (Chilvers et al. 2010), low reproductive ability (Childerhouse et al. 2010) and low juvenile survival (Chilvers & MacKenzie 2010).
In contrast, adult female New Zealand sea lions at the recolonising site on Otago Peninsula (Fig. 1) conduct short, shallow dives and only exceed their cADL during 7% of dives (Augé et al. 2011a, b). These sea lions have no consistent foraging patterns (i.e. they exhibit both benthic and mesopelagic behaviours; Augé et al. 2011a) and remain close to shore while foraging, with short trips over the continental shelf (Augé et al. 2011b). This population has a stable pup production, earlier age at first breeding, higher reproductive ability and higher juvenile survival than the Auckland Islands population (Augé 2010).
The aim of this research was to investigate the population of New Zealand sea lions at Stewart Island using pup production, and mark and resighting surveys (mark-recapture method) undertaken between 2011 to 2016, and using a combination of satellite or GPS and dive instruments to identify the foraging patterns and range of lactating females in 2012 and 2013. These data will shed light on the population dynamics across the species’ range by comparing pup production and foraging behaviour in the Stewart Island population to populations elsewhere (Auckland Islands and Otago; Fig.1).
Material and methods
Location and population survey
In March 2011, a survey was carried out on Stewart Island (47°00’S, 167°50’E; Fig. 1) to confirm New Zealand sea lion breeding and to flipper tag any pups seen. Breeding was confirmed in 2011, therefore, surveys and pup tagging were continued from 2012 to 2016. Pups were tagged to provide a pool of known age individuals for the estimation of population dynamic parameters in the future if the area became part of a long-term study. All pups were tagged in both flippers. All live pups seen were tagged with coffin shaped Dalton ‘Jumbo’ tags (Dalton Supplies Ltd., Henley-on-Thames, United Kingdom). Foraging research was conducted on Stewart Island in May 2012 and March 2013. Eight females were monitored each year; however, two individuals were monitored across both years, giving a total of 14 individuals.
Capture and deployment
nostrils clear (Gales & Mattlin 1998; Costa & Gales 2000). The netted sea lion was physically restrained by two people and anaesthetised using an isoflurane-oxygen mix (2–5%) delivered by a mask from a portable vaporising system (Gales & Mattlin 1998). The time from initial netting to the mask being in position was approximately 3–5 mins and each sea lion was anaesthetised for less than 20 mins. Once stable, the sea lion was weighed (200 kg capacity scale ± 0.5 kg) and measured before instruments were attached. Prior to attachment, each instrument was glued to a piece of neoprene material cut to the same size as the unit’s base. This neoprene base was then glued to the dorsal pelage just below the shoulder blades of the sea lion using two-part epoxy glue. Once the instruments had been adequately attached to the sea lion (8–10 mins after glue application), the flow of anaesthetic was stopped and while the animal was recovering, a milk sample was collected from the lactating females. Each sea lion was observed after restraint until it was fully conscious. In 2012, we attempted to recapture females in the same manner to retrieve tags. However, no attempt was made to recover tags in 2013 due to logistical restrictions. The fat, protein and total solids of milk samples were determined using Fourier transform infrared spectroscopy with a Milkoscan FT 120 (Foss electric A/S, Hillerod, Denmark; see Riet-Sapriza et al. 2012 for full details).
To record foraging behaviour, one of three tag combinations was attached to each of the 14 female NZ sea lions: (1) satellite-linked GPS (F1G138B, FASTLOC GPS, 100 mm × 55 mm × 18 mm, 160 g, Sirtrack, Havelock North, NZ) and time depth recorder (TDR; MK9, 40 mm × 30 mm × 22 mm and 65 mm × 18 mm × 18 mm, Wildlife Computers, Redmond, Washington, USA); (2) non-satellite-linked GPS (same dimensions and supplier as satellite-linked GPS tags) and MK9 TDR; or (3) SPLASH tag containing both Argos satellite location system (PTT) and TDR/SLTDR (100 mm × 635mm × 635 mm, 150 g, Wildlife Computers, Redmond, Washington, USA). All TDRs and SLTDRs were programmed to record depth every 5 s when wet, thus recording the number and length of dry periods when females were on land. The SPLASH tags were designed so that if retrieved, all of the TDR data recorded (i.e. individual dive depths and dive durations) could be retrieved. However, if not retrieved, dive data were transmitted via satellite and received in histogram form, providing general descriptions of diving behaviour in the form of SLTDR data. In 2012, all tagged animals also had VHF transmitters attached (Sirtrack, Havelock North, NZ) to help relocate them to remove tags.
Dive data analysis TDR data
Diving data were analysed using Multitrace (Jensen Software Systems) to produce summary statistics for each dive. Zero offset drift in the depth values for each tag was corrected manually within Multitrace. Dives <6 m were considered to be non-foraging dives primarily associated with travel and were not analysed further (Gales & Mattlin 1997; Chilvers et al. 2006). Bottom time was defined as the time the sea lion spent at depths exceeding 85% of the maximum depth for that dive (Gales & Mattlin 1997). The cADL for each female in this study was estimated based on a usable oxygen store of 47.4 mL O2 kg–1 (Costa et al. 1998) and assuming a diving metabolic rate of 58.7 mL O2 kg–0.75 min–1 (Costa & Gales 2000). All results are presented as means ± 1 SE.
SLTDR data
SLTDR dive depth and duration data were stored in histogram bins that were determined prior to deployment. The minimum depth considered to be a dive was 6 m (Gales & Mattlin 1997; Chilvers et al. 2006). The first dive-depth bin was 6–20 m and the upper limits for the remaining bins were 50, 100, 120, 150, 200, 250, 300, 400, 500, 600 and >600 m. The upper limits on the dive-duration bins were defined as 30, 60, 90, 120, 180, 240, 300, 360, 420, 480, 540, 600, 1200 and >1200 seconds. Dive histograms were coded to represent four 6-hour periods corresponding to midnight to 6 am, 6 am to 12 noon, 12 noon to 6 pm and 6 pm to midnight. SLTDR dive data were analysed by summing the counts of dives in each depth- and duration-bin for each trip for each female.
Foraging location analysis GPS locations
The Sirtrack Fastloc GPS tags collected locations at 30-min intervals when the sea lion was at the surface. Of the three GPS tags that were not satellite linked, only one was recovered. Data were then downloaded, processed and erroneous GPS locations filtered out based on a maximum transit rate of 2 m s–1 (Chilvers et al. 2011) and a 160° turning angle. The two satellite-linked GPS tags were programmed to transmit a subset of the GPS data via the Argos system at the highest priority level. When archived GPS data were not recovered, transmitted GPS data were used and filtered as above. Satellite locations
At sea locations were calculated for each sea lion by reference to three satellites and were assigned to one of six classes by Argos on the basis of their accuracy. Since New Zealand sea lions dive almost continuously while at sea (Gales & Mattlin 1997; Chilvers et al. 2006), all trips and satellite locations were assumed to be part of a foraging trip and to represent foraging locations. Raw Argos data were filtered using a speed/ angle filter to remove unlikely position estimates (thresholds: 2 m s-1 and 160° angle, respectively).
Filtered locations were used to estimate distance from Stewart Island and total distance travelled. Calculations of mean distance travelled per trip, maximum distance from the breeding area and kernel ranges (Worton 1989) were restricted to complete trips (those defined as sea lion locations that were at the breeding area or within 10 km of the breeding area while the sea lion was travelling towards it). Locations from incomplete trips are represented in the tables for time at sea, time ashore and maximum distances from shore information but were not used in trip statistics, as they did not represent full return trips. Kernel ranges for 50% and 65% of all locations per sea lion were created using the Animal Movement Extension of ArcView (Hooge et al. 2000). These ranges were thought to show representative foraging locations (Chilvers et al.2005) and were determined using smoothing factors calculated via least-square cross validation (Seaman & Powell 1996).
Comparison of foraging behaviours between populations
Augé 2010; Augé et al. 2011a, b). Both the Enderby Island and Otago research were undertaken using the same capture and tag attachment methods on adult female New Zealand sea lions using SPLASH tags (Wildlife Computers, Redmond, Washington, USA). All tags were recovered during the Enderby Island and Otago research so all data is based on full TDR and satellite location data. Deployments during these research trips ranged from 5 to 46 days. The foraging behaviours of these three New Zealand sea lion populations were compared using Kruskal Wallis tests in SPSS 22 (SPSS Inc. 2004).
Results
There are limited data on population dynamics of sea lions at Stewart Island. In 2011, 16 pups were found and tagged on Stewart Island. Subsequent annual surveys recorded a further 25, 26, 32, 36 and 31 pups born each year respectively between 2012 and 2016. The increase in pup numbers across years is likely due to increased knowledge on where to look for pups rather than increasing numbers, as Stewart Island females breed as individual, highly dispersed, forest breeders and are difficult to find. There were approximately 40 females and 20 male New Zealand sea lions sighted around Stewart
Island during each survey. Male numbers are likely to be much higher but surveys specifically avoided males as it was unlikely that females and pups would be in areas with large numbers of males (pers. obs.). Across the years there were 49 sightings of tagged individuals with all of them being one- to four-year old male and females that were marked in previous years and the adult females that were flipper tagged during satellite research.
Over the two-year foraging study period, satellite or GPS and dive instruments were attached to 16 female New Zealand sea lions for between 3 and 53 days (Table 1). Two sea lions (6064 and E788) were tagged in both years. No foraging data were obtained from two sea lions (E790 and E792) as their GPS and TDRs were not retrieved and they were not satellite linked. GPS data were collected from one retrieved GPS tag. Data were also collected from two satellite-linked GPS tags, while Argos location data were obtained from the remaining 11 sea lions (Table 1).
Diving data TDR data
Complete dive TDR datasets were collected for three sea lions from which tags were retrieved in 2012, totalling four foraging trips and 802 dives (Tables 1 and 2). Foraging trip
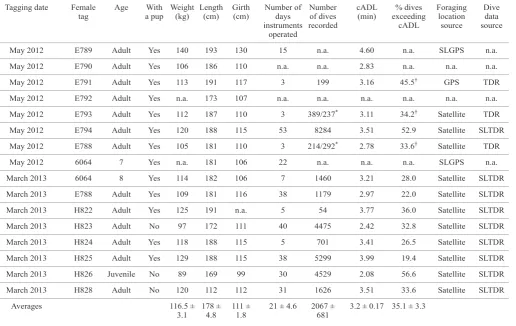
Table 1. Summary information for tagged individuals showing data sources and foraging behaviour for 14 female New Zealand sea lions captured at Stewart Island during May 2012 and March 2013. Calculated aerobic dive limits (cADLs) were estimated based on a useable oxygen store of 47.4 mL O2 kg–1 (Costa et al. 1998) and assuming a diving metabolic rate of 58.7 mL O2 kg–0.75 min-1 (Costa & Gales 2000).
Tagging date Female Age With Weight Length Girth Number of Number cADL % dives Foraging Dive tag a pup (kg) (cm) (cm) days of dives (min) exceeding location data
instruments recorded cADL source source
operated
__________________________________________________________________________________________________________________________________________________________________
May 2012 E789 Adult Yes 140 193 130 15 n.a. 4.60 n.a. SLGPS n.a.
__________________________________________________________________________________________________________________________________________________________________
May 2012 E790 Adult Yes 106 186 110 n.a. n.a. 2.83 n.a. n.a. n.a.
__________________________________________________________________________________________________________________________________________________________________
May 2012 E791 Adult Yes 113 191 117 3 199 3.16 45.5† GPS TDR
__________________________________________________________________________________________________________________________________________________________________
May 2012 E792 Adult Yes n.a. 173 107 n.a. n.a. n.a. n.a. n.a. n.a.
__________________________________________________________________________________________________________________________________________________________________ May 2012 E793 Adult Yes 112 187 110 3 389/237* 3.11 34.2† Satellite TDR
__________________________________________________________________________________________________________________________________________________________________ May 2012 E794 Adult Yes 120 188 115 53 8284 3.51 52.9 Satellite SLTDR __________________________________________________________________________________________________________________________________________________________________ May 2012 E788 Adult Yes 105 181 110 3 214/292* 2.78 33.6† Satellite TDR
__________________________________________________________________________________________________________________________________________________________________
May 2012 6064 7 Yes n.a. 181 106 22 n.a. n.a. n.a. SLGPS n.a.
__________________________________________________________________________________________________________________________________________________________________
March 2013 6064 8 Yes 114 182 106 7 1460 3.21 28.0 Satellite SLTDR
__________________________________________________________________________________________________________________________________________________________________ March 2013 E788 Adult Yes 109 181 116 38 1179 2.97 22.0 Satellite SLTDR __________________________________________________________________________________________________________________________________________________________________ March 2013 H822 Adult Yes 125 191 n.a. 5 54 3.77 36.0 Satellite SLTDR __________________________________________________________________________________________________________________________________________________________________ March 2013 H823 Adult No 97 172 111 40 4475 2.42 32.8 Satellite SLTDR __________________________________________________________________________________________________________________________________________________________________ March 2013 H824 Adult Yes 118 188 115 5 701 3.41 26.5 Satellite SLTDR __________________________________________________________________________________________________________________________________________________________________ March 2013 H825 Adult Yes 129 188 115 38 5299 3.99 19.4 Satellite SLTDR __________________________________________________________________________________________________________________________________________________________________ March 2013 H826 Juvenile No 89 169 99 30 4529 2.08 56.6 Satellite SLTDR __________________________________________________________________________________________________________________________________________________________________ March 2013 H828 Adult No 120 112 112 31 1626 3.51 33.6 Satellite SLTDR __________________________________________________________________________________________________________________________________________________________________ Averages 116.5 ± 178 ± 111 ± 21 ± 4.6 2067 ± 3.2 ± 0.17 35.1 ± 3.3
3.1 4.8 1.8 681
* Number of dives recorded presented as TDR/SLTDR.
Table 2. Summary of diving records and behaviour for three female New Zealand sea lions from Stewart Island tagged with TDRs in 2012, and dive summaries for females from Otago, New Zealand (n=8), and Enderby Island, Auckland Islands (n=18). Dives are defined as submersions to >6 m. Calculated aerobic dive limits (cADLs) were estimated based on a useable oxygen store of 47.4 mL O2 kg–1 (Costa et al. 1998) and assuming a diving metabolic rate of 58.7 mL O2 kg–0.75 min-1 (Costa & Gales 2000). Data are presented as means ± SE, Kruskal Wallis test presented testing differences between locations.
Female Number Mass Number Mean no. Mean Mean Mean % bottom Mean Time cADL % dives identity of foraging (kg) of dives dives per surface dive dive time time at submerged (min) exceeding
trips recorded hour at interval depth duration sea (h) at sea cADL
sea (min) (m) (min) (%)
__________________________________________________________________________________________________________________________________________________________________ E788 1 105 214 19.5 ± 1.9 1.1 ± 0.1 48.8 ± 2.7 2.1 ± 0.1 34.0 ±1.7 11.0 66% 2.78 33.6% __________________________________________________________________________________________________________________________________________________________________
E791 1 113 199 11.2 ± 0.8 2.4 ± 0.3 72.7 ± 2.8 2.9 ± 0.1 36.0 ± 1.4 13.1 61% 3.16 45.5% __________________________________________________________________________________________________________________________________________________________________
E793 2 n.a. 389 13.9 ± 1.3 1.7 ± 0.2 57.2 ± 2.0 2.7 ± 0.1 40.5 ± 1.2 12.2 ± 1.8 58% 3.11 34.2% __________________________________________________________________________________________________________________________________________________________________ This study n=3 116.5 ± 14.9 ± 2.4 1.7 ± 0.4 59.6 ± 7.0 2.5 ± 0.2 37.0 ± 1.9 12.1 ± 0.6 61.6 ± 2.3 35.1 ± 3.3‡
3.1#
__________________________________________________________________________________________________________________________________________________________________ Otago* n=8 125.1 ± 18.8 ± 4.6 20.2 ± 24.5 1.8 ± 1.1 55.0 ± 17 11.8 ± 1.5 7.1 ± 8.1
6.9
__________________________________________________________________________________________________________________________________________________________________ Enderby† n=18 113.8 ± 7.8 ± 0.3 129.0 ± 5.3 3.9 ± 1.0 40.0 ± 2.9 66.2 ± 4.2 52.7± 2.3 68.7 ± 4.4
2.9
__________________________________________________________________________________________________________________________________________________________________ Kruskal Wallis n.s. F2,26 = F2,26 = 20.7 F2,26 = n.s F2,26 = n.s. F2,36 =
results 20.0 P ≤ P ≤ 0.0001 20.5 P ≤ 19.8 P ≤ 28.0
0.0001 0.0001 0.0001 P ≤ 0.0001
# Average mass from all 14 Stewart Island female NZ sea lions. * Augé et al. 2011a. Adults only ≤4 yrs.
† Chilvers et al. 2006.
‡Calculated from all cADL for Stewart Island NZ sea lions; refer to Table 1.
-180 -160 -140 -120 -100 -80 -60 -40 -20 0
Dept
h (
m)
Time
08.00 10.00 12.00 14.00 16.00
lengths averaged 12.1 hours (range: 11–12.2), with sea lions spending on average 61.6 ± 2.3% of this time in the water column below 6 m. Fifty percent of dives recorded by the TDRs were between 100 and 120 m, and 35% were between 20 and 50 m; the overall mean dive depth for each sea lion was 48.8 ± 2.7 m, 72.7 ± 2.8 m and 57.2 ± 2.0 m (Table 2, Fig. 2). On average, 37% of all dives were spent in the bottom 85% depth of dives (range: 34–40.5%) with the predominant dive shape being U-shaped (78% ± 3.5). Average dive duration was 2.5 ± 0.2 mins, with mean surface intervals of 1.7 ± 0.4 mins (Table 2). These three females exceeded their cADL during 37.8 ± 3.3% of dives (Table 2).
SLTDR data
SLTDR dive data were collected from 11 sea lions: three in 2012, two of which also had full TDR datasets (E788 and
Figure 2. An example of New Zealand sea lion E793’s dive profile showing continual diving at variable depths across an entire foraging trip.
E793), and eight in 2013. A total of 88 134 dives were recorded by the three SLTDRS in 2012 and 19 323 dives by the eight SLTDRs in 2013 (Table 1). The majority of dives (60%, range: 33–72%) recorded by the SLTDRs were in the 20–50 m bin, while 28% of all dives recorded were between 50 and 150 m depth. Maximum dive depths recorded were in the 250–300 m bin for all females except one – the maximum dive depth of H822 was in the 100–120 m bin. Dive duration varied between years, with 50% of dives in 2012 in the 180–300 s bins, but 55% of dives in 2013 were less than 180 s in duration. All females with dive data (TDR and SLTDR) exceeded their cADLs during 35.1 ± 3.3% of dives (Tables 1).
Foraging locations
Table 3. Number and duration of foraging trips, kernel range (KR) sizes and mean straight line distances from breeding area to centre of KR for 14 New Zealand sea lions from Stewart Island, New Zealand and summaries for females from Otago, New Zealand (n=6), and Enderby Island, Auckland Islands (n=25). Data are presented as means ± SE, Kruskal Wallis test presented testing differences between locations.
Female With No. days Total No. of Mean time Mean time Mean trip Max. trip Max. 50% KR 65% KR identity a pup deployed no. trips at sea (h) ashore (h) distance distance distance (km2) (km2)
locations (km) (km) from shore
(km)
__________________________________________________________________________________________________________________________________________________________________
E789 Yes 15 349 12 20.4 ± 2.8 7.4 ± 1.2 49.0 ± 5.5 89 38 40 334
__________________________________________________________________________________________________________________________________________________________________
E791 Yes 3 86 1 13.1 11.5 57.0 57 28 n.a. n.a.
__________________________________________________________________________________________________________________________________________________________________
E793 Yes 3 53 2 12.2 ± 1.8 4.8 ± 0.1 58.0 ± 7 72 31 n.a. n.a.
__________________________________________________________________________________________________________________________________________________________________
E794 Yes 53 571 31 23.7 ± 2.4 13.2 ± 0.8 43.0 ± 4.8 114 32 12 92
__________________________________________________________________________________________________________________________________________________________________
E788 Yes 3 32 1 11.0 12.0 47.0 47 20 n.a. n.a.
__________________________________________________________________________________________________________________________________________________________________
6064 Yes 22 408 16 25.3 ± 3.3 4.5 ± 0.12 11.0 ± 3.7 60 22 2 6
__________________________________________________________________________________________________________________________________________________________________
6064 Yes 7 84 2 17.5 ± 4.3 12.9 ± 1.9 61.0 ± 24.3 120 28 54 592
__________________________________________________________________________________________________________________________________________________________________
E788 Yes 8 75 7 8.6 ± 1.7 22.1 ± 4.5 49.0 ± 7.2 72 32 59 740
__________________________________________________________________________________________________________________________________________________________________
H822 Yes 5 18 2 7.5 ± 0.2 23.3 17.0 ± 3.3 24 4 n.a. n.a.
__________________________________________________________________________________________________________________________________________________________________
H823 No 40 402 29 15.7 ± 2.1 14.6 ±1.6 40.0 ± 2.9 74 24 38 300
__________________________________________________________________________________________________________________________________________________________________
H824 Yes 5 52 4 15.4 ± 7.6 15.6 ± 0.15 48.0 ± 26.5 120 30 24 350
__________________________________________________________________________________________________________________________________________________________________ H825 Yes 38 150 18 11.8 ± 1.8 14.6 ± 1.5 57.0 ± 7.1 135 33 25 420 __________________________________________________________________________________________________________________________________________________________________
H826 No 30 335 20 14.7 ± 1.8 15.9 ± 1.9 61.0 ± 6.7 100 38 110 1300 __________________________________________________________________________________________________________________________________________________________________
H828 No 31 219 23 12.4 ± 1.6 15.6 ± 1.7 37.0 ± 4.1 77 31 18 265
__________________________________________________________________________________________________________________________________________________________________ Stewart 14.9 ± 1.4 13.4 ± 1.5 45.0 ± 4.1 83 ± 8.5 28 ± 2.3 38 ± 9.8 440 ± 117 __________________________________________________________________________________________________________________________________________________________________
Otago* n=9 11.8 ± 1.5 13.8 ± 1.4 26.4 ± 2.7 4.7 ± 1.6 n.a. 47 ± 5.0
__________________________________________________________________________________________________________________________________________________________________ Enderby† n=26 66.2 ± 4.2 26.8 ± 1.8 423.0 ± 43.9 102 ± 7.7 378 ± 8.0 643 ± 131
__________________________________________________________________________________________________________________________________________________________________ Kruskal Wallis F2,43 = 26.9, F2,43 = 13.4, F2,43 = 39.1, F2,43 = 23.7, F1,34 = 16.2, F2,43 = 13.8,
results P < 0.0001 P < 0.0001 P < 0.0001 P < 0.0001 P = 0.01 P = 0.003
* Augé 2010; Augé et al. 2011a. † Chilvers et al. 2005.
trips, most of which lasted ≤1 day (Table 3). The number of days over which the location tags were deployed, mean time at sea and ashore, foraging trip distances, and kernel range (KR) sizes for each female are shown in Table 3. Overall, females from Stewart Island foraged within 40 km of the shore (range: 4–38 km), with mean trip distances of 45 ± 4.1 km and maximum trip distances ≤135 km (range: 24–135 km). The mean duration of foraging trips was 14.9 ± 1.4 hrs, with almost equal time spent ashore (13.4 ± 1.5 hrs). KR sizes varied between individuals, with a mean 50% KR area of 38 ± 9.8 km2 and a mean 65% KR area of 440 ± 117 km2 (Table 3). All 50% KRs were centred on capture locations, with foraging concentrations at offshore isles and known upwelling locations around Stewart Island.
Comparison of foraging behaviours between populations
Summary statistics for the diving and foraging behaviours of adult female New Zealand sea lions from Enderby Island (Chilvers et al. 2005, 2006) and Otago Peninsula (Augé 2010; Augé et al. 2011a, b) are displayed in Figures 3 (a, b & c) and 4, and Tables 2 and 3. Figures 3a, b & c present the Enderby Island data split by the two diving foraging types benthic
and mesopelagic (Chilvers & Wilkinson 2009). Overall, Enderby Island females have dives that are significantly deeper and longer in duration than either Otago or Stewart Island females (Table 2, Figs. 3a & b). They also exceed their cADL almost twice as often as Stewart Island females and almost 10 times more often than Otago females (Fig. 3c), but carry out significantly fewer dives per hour than either of the other populations (Table 2). By contrast, the only significant differences between Stewart Island and Otago females were in mean dive duration and the number of dives exceeding the cADL, with Stewart Island females exceeding Otago females for both of these (Figs. 3b & c, Table 2). There was no significant difference in the mass of females between the three sites; however, the Otago females were on average 10 kg heavier than either the Stewart Island or Auckland Islands females (Table 3), and milk fat content differed significantly with the Auckland Islands females having significantly lower milk fat composition (n=181 females, fat 21.3 ± 8.1%; Riet-Sapriza et al. 2012), than either Stewart Island or Otago females (Stewart Island, n=11, fat 35.7 ± 2.7%; Otago, n=11, fat 40.7 ± 2.9%; Augé 2010).
Figure 4. Comparison of the mean trip distance, maximum trip distance from shore and area of the 65% KR (means ± SE ) for adult female New Zealand sea lions breeding at Otago, Stewart Island and Enderby Islands.
Figure 3. (A) Boxplot comparisons of the mean dive depth, (B) mean dive duration and (C) % of dives exceeding the calculated aerobic dive limits (means ± SE) for adult female New Zealand sea lions breeding at Otago, Stewart Island and Enderby Island benthic and mesopelagic divers.
females from Otago or Stewart Island (Fig. 4; Table 3). By contrast, the only significant difference between the Otago and Stewart Island populations was in the 65% KR, with Stewart Island females travelling over significantly greater distances and areas than Otago females (Fig. 4, Table 3).
Discussion
There is limited population parameter information that can be gleaned from the pup production, mark and resighting surveys undertaken on Stewart Island between 2011 and 2016. The data indicate that pup production was at least likely to be stable between 2011 to 2016. Resights of locally tagged pups as juveniles and resights of tagged females (who had been satellite-tagged) pupping, indicate juvenile and adult survival and reproduction parameters, however, currently sample sizes are too small for much accuracy. Overall, the continuation of this tagging and resighting research for up to 10 years will be required to get meaningful population dynamics estimates given the small number of tagged pups of known age available to monitor through their lives (i.e. Hammond 2010).
The foraging behaviours of the females from Stewart Island show that their foraging behaviour and strategies are between those of the Enderby Island and Otago females, although significantly closer to Otago than Enderby Island. Distinct foraging strategies have been found to correlate with population dynamics in several species of marine mammals (e.g. northern fur seals, Callorhinus ursinus, Goebel et al. 1991; Californian sea otters, Enhydra lutris nereis, Tinker et al. 2007) and seabirds (Magellanic penguins, Spheniscus magellanicus, Sala et al. 2012).
Variation in diving behaviour within and between populations has also been correlated with reproductive success, survival and population viability (Bradshaw et al. 2004; Costa et al. 2006; Tinker et al. 2007; Sala et al. 2012). For Antarctic fur seals (Arctocephalus gazella), intraspecific variation in foraging behaviour has been linked to population dynamics (Staniland et al. 2010, 2011). Antarctic fur seals appear to have a reduced niche width available at the southeast end of Bird Island, South Georgia, due to local bathymetry (Staniland et al. 2010, 2011). This appears to reduce the ability of these central place foragers to alter their foraging behaviour during periods of environmental variability, reducing the population size and growth rates relative to individuals living elsewhere
0 100 200 300 400 500 600 700 800
Mean trip distance (km) Max. distance from shore (km) 65% KR (km2)
Otago Stewart Island Auckland Islands
(A)
(B)
on the island (Staniland et al. 2011). Similarly, Antarctic fur seals that breed on Heard Island (southwest of Australia) carry out deeper dives than fur seals from northern Bird Island. These dives exceed their cADLs, and are thought to correlate to decreasing population growth rates and overall limiting the recovery of this population (Staniland et al. 2010).
New Zealand sea lions exhibit intraspecific variation in foraging strategies and population dynamics between the Auckland Islands and Otago peninsula populations (Augé et al. 2011a, b). Therefore, using these populations as benchmarks, what does the foraging behaviour of the Stewart Island females (and limited population data available) indicate for the population dynamics of the Stewart Island population?
Female New Zealand sea lions from Stewart Island had a foraging strategy that was more similar to the recolonising Otago population than the remnant Auckland Islands population, with relatively short, shallow dives close to shore in concentrated foraging areas (Figs. 2, 3 and 4). These dives suggest that the Stewart Island population may have more stable population dynamics relative to the declining Auckland Islands population. The population data that has been concurrently collected from Stewart Island indicates that this population trend may be the case (i.e. pup production from 2011 to 2016 appears stable, there are resights of locally tagged pups as juveniles and resights of tagged females pupping, indicating a level of survival and reproduction).
The Auckland Islands population (which represents 73% of the total population) has shown a >50% decline in pup production over 17 years (1998 to 2015) and exhibited extreme diving and foraging behaviour as well as long-term individual foraging specialisation during this same period (Gales & Mattlin 1997; Costa & Gales 2000; Chilvers et al. 2006; Chilvers 2008, 2009; Chilvers & Wilkinson 2009; Chilvers & Meyer 2017). Animals that operate at or near their maximum physiological limits and those that show highly specialised foraging behaviours tend to be less able to adapt to changing environments, which can result in decreasing survival, reproduction and eventually population size and higher risk of extinction (Gallagher et al. 2015). Such effects can be seen in the Auckland Islands population including low reproduction rates, survival, slightly smaller adult body size and significantly lower milk fat composition (Chilvers & McKenzie 2010; Chilvers et al. 2006, 2010; Riet-Sapriza et al. 2012; Table 3). By contrast, both the Otago and Stewart Island populations are not displaying this extreme foraging behaviour or foraging specialisation and available data suggest that there is no population decline at these sites (this research; www.sealiontrust.org.nz).
Female New Zealand sea lions from Stewart Island and Otago appear to have foraging strategies and population dynamics similar to California sea lions (Zalophus californianus), which are characterised by shorter, closer to shore foraging trips, with dives that are not thought to be physiologically extreme, correlated with stable or increasing populations (Lowry & Maravilla-Chavez 2005; Szteren et al. 2006; Villegas-Amtmann et al. 2011). By contrast, females from the Auckland Islands display population dynamics similar to benthic- or specialised foraging otariids (e.g. Australian sea lions, Neophoca cinerea; Costa & Gales 2003; Fowler et al. 2007), shown to be correlated with stable or declining populations (Arnould & Costa 2006; Costa et al. 2006).
It is possible that both Stewart Island and Otago females foraging behaviour is related to low population size and ease of finding prey resources (low intraspecific competition).
However, it is estimated that up to 250 juvenile and adult male New Zealand sea lions are found around Otago and similar numbers at Stewart Island most years (McConkey unpubl. data; pers. obs.). These groups likely have some foraging area overlap with females, particularly juvenile males (as seen at Enderby Island; Leung et al. 2012, 2014). In addition, there are large numbers of other marine carnivores which forage in these areas, including New Zealand fur seals Arctocephalus fosteri (>20 000 individuals; Lalas 2008) that could have an overlap or be competing for prey (Lalas & Webster 2014) whereas fur seal numbers are limited at the Auckland Islands (pers. obs.). Additionally, the Auckland Islands population has declined by ~50% in the last 17 years and over that time the foraging behaviour of female New Zealand sea lions and many population parameters at Auckland Islands have not changed, indicating that before the decline they were not at or near carrying-capacity for their environment (Chilvers et al. 2005, 2006, 2011; Chilvers 2012). Consequently, small population size alone is unlikely to be the course of these contrasting foraging behaviours, however, as either mainland populations grow, intraspecific competition may become more important in these areas and foraging behaviour and population dynamics should be investigated again (Kuhn et al. 2014).
There are now 5 years of confirmed pupping of New Zealand sea lions on Stewart Island. Stewart Island is the biggest resident breeding population of New Zealand sea lions outside the New Zealand subantarctic, and is the equivalent to 1% of the entire pup production of New Zealand sea lions annually. This apparently self-sustaining population is critical to the species, as it is dispersing the breeding population of New Zealand sea lions away from their current restricted, significantly declining subantarctic distribution. However, the isolation and cryptic dispersed breeding behaviour of these animals makes them difficult to study and means it may take decades to fully understand the population dynamics of the Stewart Island population using traditional mark recapture methods. Delays in further understanding the population dynamics of the Stewart Island population could restrict management agencies’ ability to assess and manage known and potential indirect and direct human impacts on this small recolonising population. An example of this is already identified in the New Zealand sea lion threat management plan with a review of the impacts of aquaculture on sea lions, with relevance to Stewart Island sea lions already identified as needed (Department of Conservation 2017). This research, in investigating both the foraging behaviour of adult females and pup production, gives some indication that the Stewart Island population of New Zealand sea lions is likely to have population parameters more similar to the slowly increasing colonising population of Otago than the declining Auckland Islands population. However, like all small populations, the Stewart Island population remains vulnerable to human impacts and should be managed proactively using strong precautionary measures to minimise human impacts such as are likely with aquaculture (Wursig & Gailey 2002) and therefore maximise the population’s chance for survival and growth.
Acknowledgements
Islands for their logistical assistance, and P. Young and D. Harding, the skippers of Southern Winds, for all their work and baking. I sincerely thank Auckland Zoo Conservation Fund for co-funding this work, and thank J. Amey, P. Dobbins, J. Milicich, K. McInnes, B. Lenting, J. Hiscock, R. Cole, L. Meynier and D. Johnston for assistance with captures in the field. Sincere thanks to D. Freeman as co-EI team leader. Approval for this work was obtained from DOC Animal Ethics Committee—Approval AEC232 (1 October 2011). D. Freeman, A. Todd, S. Geange and two anonymous reviewers all provided helpful, critical reviews of the manuscript.
References
Arnould JPY, Costa DP 2006. Sea lions in drag, fur seals incognito: insights from the Otariid deviants. In: Trites AW, DeMaster DP, Fritz LW, Gelatt LD, Rea LD, Wynne KM eds. Sea lions of the world. Alaska Sea Grant College Program, University of Alaska, Fairbanks. Pp. 111–125. Augé AA 2010. Foraging ecology of New Zealand sea lions.
PhD Thesis, University of Otago, Dunedin. 261 p. Augé AA, Chilvers BL, Davis LS, Moore AB 2011a. In the
shallow end: diving behaviour of recolonising female New Zealand sea lions (Phocarctos hookeri) around the Otago Peninsula. Canadian Journal of Zoology 89: 1195–1205.
Augé AA, Chilvers BL, Moore AB, Davis LS 2011b. Foraging behaviour indicates marginal habitat for New Zealand sea lions: remnant vs recolonizing. Marine Ecology Progress Series 432: 247–256.
Bolnick DI, Svanback R, Fordyce JA, Yang LH, Davis JM, Hulsey CD, Forister ML 2003. The ecology of individuals: incidence and implications of individual specialization. American Naturalist 161: 1–28.
Bradshaw CJA, Hindell MA, Sumner MD, Michael KJ 2004. Loyalty pays: potential life history consequences of fidelity to marine foraging regions by southern elephant seals. Animal Behaviour 68: 1349–1360.
Childerhouse S, Dawson S, Fletcher D, Slooten E, Chilvers BL 2010. Growth and reproduction of female New Zealand sea lions. Journal of Mammology 91: 165–176.
Chilvers BL 2008. Foraging behaviour site fidelity of lactating New Zealand sea lions, Phocarctos hookeri. Journal of Zoology, London 276: 28–36.
Chilvers BL 2009. Foraging locations of a decreasing colony of New Zealand sea lions (Phocarctos hookeri). New Zealand Journal of Zoology 33: 106–113.
Chilvers BL 2012. Using life-history traits of New Zealand sea lions, Auckland Islands, to clarify potential cause of decline. Journal of Zoology, London 287: 240–249. Chilvers BL 2015. Phocarctos hookeri. The IUCN Red List
of Threatened Species. Version 2015.2. www.iucnredlist. org (accessed 20 November 2015).
Chilvers BL, Mackenzie D 2010. Age- and sex-specific survival estimates incorporating tag loss for New Zealand sea lions, Phocarctos hookeri. Journal of Mammology 91: 758–767.
Chilvers BL, Meyner S 2017. Conservation needs for the endangered New Zealand sea lion, Phocarctus hookeri. Aquatic Conservation 27: 846–855.
Chilvers BL, Wilkinson IS 2009. Divers foraging strategies in lactating New Zealand sea lions. Marine Ecology Progress Series 378: 299–308.
Chilvers BL, Wilkinson IS, Duignan PJ, Gemmell NJ 2005. Identifying the distribution of summer foraging areas for lactating New Zealand sea lions, Phocarctos hookeri. Marine Ecology Progress Series 304: 235–247.
Chilvers BL, Wilkinson IS, Duignan PJ, Gemmell N 2006. Diving to extremes: are New Zealand sea lions (Phocarctos hookeri) pushing their limits in a marginal habitat? Journal of Zoology, London 269: 233–241.
Chilvers BL, Wilkinson IS, Mackenzie D 2010. Predicting life-history traits for female New Zealand sea lions, Phocarctos hookeri: integrating short-term mark-recapture data and population modelling. Journal of Agriculture Biology Ecological Statistics 15: 259–264.
Chilvers BL, Amey JM, Huckstadt LA, Costa DP 2011. Investigating foraging utilization distribution of female New Zealand sea lions. Polar Biology 34: 565–574. Collins CJ, Rawlence NJ, Prost S, Anderson CNK, Knapp
M, Scofield RP, Robertson BC, Smith I, Matisoo-Smith EA, Chilvers BL, Waters JM 2014. Extinction and recolonization of coastal megafauna following human arrival in New Zealand. Proceedings of the Royal Society B: Biological Sciences 281: DOI: 10.1098/ rspb.2014.0097.
Costa DP 1991. Reproductive and foraging energetics of high latitude penguins, albatross and pinnipeds: implications for life history patterns. American Zoology 31: 111–130. Costa DP 1993. The relationship between reproductive and
foraging energetics and the evolution of the pinnipedia. In: Boyd I ed. Marine mammals: advances in behavioural and population biology. Symposia of the Zoological Society of London. Oxford, Oxford University Press. Pp. 293–314.
Costa DP, Gales NJ 2000. Foraging energetic and diving behaviour of lactating New Zealand sea lions, Phocarctos hookeri. Journal of Experimental Biology 203: 3655– 3665.
Costa DP, Gales NJ 2003. Energetics of a benthic diver: seasonal foraging ecology of the Australian sea lion, Neophoca cinérea. Ecological Monograms 73: 27–43.
Costa DP, Gales NJ, Crocker DE 1998. Blood volume diving ability of the New Zeal sea lion, Phocarctos hookeri. Physiological Zoology 71: 208–213.
Costa DP, Kuhn CE, Weise MJ, Shaffer SA, Arnould JPY 2004. When does physiology limit the foraging behaviour of freely diving mammals? International Congress Series 1275: 359–366.
Costa DP, Weise MJ, Arnould JPY 2006. Worldwide pinniped population status and trends. In: Estes J, Williams TM, Doak D, DeMaster D eds. Whales, whaling, and ocean ecosystems. Berkeley, University of California Press. Pp. 342–359.
Department of Conservation 2017. New Zealand sea lion / rapoka threat management plan 2017–2022. Wellington, Department of Conservation and Minsitry for Primary Industries. 17 p.
Fowler SL, Costa DP, Arnould JP 2007. Ontogeny of movements and foraging ranges in the Australian sea lion. Marine Mammal Science 23: 598–614.
Gales NJ, Mattlin RH 1997. Summer diving behaviour of lactating New Zealand sea lions, Phocarctos hookeri. Canadian Journal of Zoology 75: 1695–1706.
Gallagher AJ, Hammerschlag N, Cooke SJ, Costa DP, Irschick DJ 2015. Evolutionary theory as a tool for predicting extinction risk. Trends in Ecology and Evolution 30: 61–65.
Gerrodette T, Gilmartin WG 1990. Demographic consequences of changed pupping and hauling sites of the Hawaiian monk seal. Conservation Biology 4: 423–430.
Goebel ME, Bengston JL, Delong RL, Gentry RL, Loughlin TR 1991. Diving patterns and foraging locations of female northern fur seals. Fisheries Bulletin 89: 171–179. Hammond PS 2010. Estimating the abundance of marine
mammals. In: Boyd IL, Bowen WD, Iverson SJ eds. Marine mammal ecology and conservation – a handbook of techniques. New York, Oxford University Press. Pp. 42–67.
Hooge PN, Eichenlaub WM, Solomon EK 2000. Using GIS to analyze animal movements in the marine environment. Alaska Biological Science Centre, US Geological Survey, Gustavus, AK. 21 p.
Kuhn CE, Baker JD, Towell RG, Ream RR 2014. Evidence of localized resource depletion following a natural colonization event by a large marine predator. Journal of Animal Ecology 83: 1169–1177.
Lalas C 2008. Recolonisation of Otago, southern New Zealand, by fur seals and sea lions: unexpected patterns and consequences. In: Clarkson B, Kurian P, Nachowitz T, Rennie H eds. Proceedings of the Conserv-Vision Conference, University of Waikato, 2–4 July 2007. Hamilton, The University of Waikato. Pp. 1–16.
Lalas C, Webster T 2014. Contrast in the importance of arrow squid as prey of male New Zealand sea lions and New Zealand fur seals at the Snares, subantarctic New Zealand. Marine Biology 161: 631–643.
Leung ES, Chilvers BL, Nakagawa S, Moore AB, Robertson BC 2012. Sexual segregation in juvenile New Zealand sea lion foraging ranges: implications for intraspecific competition, population dynamics and conservation. PLoS ONE 7: e45389.
Leung ES, Chilvers BL, Nakagawa S, Robertson BC 2014. Size and experience matter: diving behaviour of juvenile New Zealand sea lions (Phocarctos hookeri). Polar Biology 37: 15–26.
Lowry MS, Maravilla-Chavez O 2005. Recent abundance of California sea lions in western Baja California, Mexico and the United States. In: Garcelon DK, Schwemm CA eds. Proceedings of the Sixth California Islands Symposium. National Park Service Technical Publication CHIS-05-01. Arcata, California, Institute for Wildlife Studies. Pp. 485–497.
McCafferty DJ, Boyd IL, Walker TR, Taylor RI 1998. Foraging responses of Antarctic fur seals to changes in the marine environment. Marine Ecology Progress Series 166: 285–299.
McConkey SD, McConnell H, Lalas C, Heinrich S, Ludmerer A, McNally N, Parker E, Borofsky C, Schimanski K, McIntosh G 2002. A northward spread in the breeding distribution of the New Zealand sea lion, Phocarctos hookeri. Australian Mammalogy 24: 97–106.
Riet-Sapriza FG, Duignan PJ, Chilvers BL, Wilkinson IS, Lopez-Villalobos NS, MacKenzie DS, MacGibbon A, Costa DP, Gales N 2012. Interannual and individual variation in milk composition of New Zealand sea lions (Phocarctos hookeri). Journal of Mammology 93: 1006–1016.
Robertson BC, Chilvers BL 2011. The population decline of New Zealand sea lions Phocarctos hookeri: a review of possible causes. Mammal Review 41: 253–275.
Sala JE, Wilson RP, Frere E, Quintana F 2012. Foraging effort in Magellanic penguins in Coastal Patagonia, Argentina. Marine Ecology Progress Series 464: 273–287.
Sandercock BK 2007. Estimation of demographic parameters from live-encounter data: a summary review. Journal of Wildlife Management 70: 1504–1520.
Seaman DE, Powell RA 1996. An evaluation of the accuracy of kernel density estimators for home range analysis. Ecology 77: 2075–2085.
Staniland IJ, Gales N, Warren NL, Robinson SL, Goldsworthy SD, Casper RM 2010. Geographical variation in the behaviour of a central place forager: Antarctic fur seals foraging in contrasting environments. Marine Biology 157: 2383–2396.
Staniland IJ, Morton A, Robinson SL, Malone D, Forcada J 2011. Foraging behaviour in two Antarctic fur seal colonies with differing population recoveries. Marine Ecology Progress Series 434: 183–196.
Szteren D, Aurioles D, Gerber L 2006. Population status and trends of the California sea lion in the Gulf of California, Mexico. In: Trites AW, DeMaster DP, Fritz LW, Gelatt LD, Rea LD, Wynne KM eds. Sea lions of the world. University of Alaska, Fairbanks, Alaska Sea Grant College Program. Pp. 369–384.
Tinker MT, Costa DP, Estes JA, Wieringa N 2007. Individual dietary specialization and dive behaviour in the California sea otter: using archival time–depth data to detect alternative foraging strategies. Deep-Sea Research 54: 330–342.
Trillmich F, Limberger D 1985. Drastic effects of El Nino on Galapagos pinnipeds. Ocologia 67: 19–22.
Villegas-Amtmann S, Simmons SE, Kuhn CE, Huckstadt LA, Costa DP 2011. Latitudinal range influences the seasonal variation in the foraging behaviour of marine top predators. PLoS ONE 6: e23166.
Worton BJ 1989. Kernel methods for estimating the utilization distribution in home range studies. Ecology 70: 164–168.
Wursig B, Gailey GA 2002. Marine mammals and aquaculture: conflicts and potential resolutions. In: Stickney RR, McVey JP eds. Responsible marine aquaculture. Oxon, UK, CAB International Publishing. Pp. 45–59.
Editorial board member: Tammy Steeves