*M.Sc., Faculty of Economics and Business Administration, St. Andrew the First-Called Georgian University of Patriarchate of Georgia, Tbilisi, Georgia. Email: [email protected]
Diversification Effects on the Banks’ Return and Risk
Ivane SHAVDATUASHVILI*
Abstract
This article analyses the diversification effects on the exchange listed EU banks’ risk-re-turn framework. Second banking directive of 1989 has initiated the boom of activity diversification in Europe. The empirical results indicated to the statistically significant di-versification premium on the banks’ performance, using the non-interest income share, together with its quadratic term, as indicator of banking diversification. The same holds for the banks with the diversified assets. In terms of revenue diversification, diversified banks are less profitable. Due to the statistically insignificant outcomes, in case of total and bank-specific risk analysis, it is difficult to make an implicit conclusion, how the diversification decision affects those types of risk. However, in terms of systematic risk there is strong statistical evidence that more diversified banks are exposed to higher levels of market risk. As a result, for the sample of European banks, the positive risk-re-turn trade-off was not found.
Keywords: bank holding company, bank performance, diversification, risk
JEL: G11, G21
Different ways were used by financial institutions to re-alize the given opportunity of activity diversification. Some of them established their own subsidiaries, others entered into the joint venture or mergers & acquisitions (M&A) deals. Several famous M&A deals have been documented since 1990s. German Allianz took over the Dresdner Bank; ING was founded in 1991 by a merger between Nationale-Ned-erlanden and NMB Postbank Group, Citigroup was formed in United States from one of the world's largest merger in a history by merging the banking giant Citicorp and finan-cial conglomerate Travelers Group (Van Lelyveld & Knot, 2009). As a result, the world society obtained larger, more complex and globally diversified universal banks, combining the traditional banking with various types of non-traditional banking activities.
Especially for the supervisory concerns, it is important to define the term financial conglomerate. According to the Basel Committee on Banking Supervision, financial con-glomerate is defined as any group of companies, including financial holding companies, which operates in at least two of the following financial sectors: banking, securities or in-surance (Basel Committee on Banking Supervision, 2012). In the United States, only those institutions are qualified as financial conglomerates, which include a bank in the group. Such a precondition is not placed for European banks, but in practice, there is no significant evidence of financial con-glomerates without credit institution. Therefore, throughout
Introduction
Since the creation of the first banks, banking industry has been becoming an important gearing element of a country’s economy. The importance of banks was growing and once more, this has been proved by the last global financial tur-moil. Every country or the union of countries wishes to have a sound banking system and to achieve this, different reg-ulatory measures have been created and enacted over the decades. During the last 20-25 years, a bunch of changes has been overcome by the banks all over the world. Various regulatory reforms, innovations on the product market and the technological progress have drastically changed the banking sector around the world.
the article, the term Bank Holding Company (BHC), bank, financial institution will be used interchangeably, addressing the financial institution at least with banking activity.
After the last global financial crisis of 2007-2008, dis-cussion about the de-conglomeration of banks gains its strength. Particularly, in the United States, several results have been published claiming that composites of financial conglomerates were worth more on the market than the whole conglomerate itself (Bloomberg, 2012). Moreover, in Europe the number of financial conglomerates has been gradually decreasing, since the beginning of crisis. Based on the data provided by the European Commission, 75 fi-nancial conglomerates, headquartered in EU/EEA, were identified in 2006 compared to 57 in 2010.
Therefore, the main question to answer in this article is the following: Is the financial institution with high level of activity diversification more profitable and at the same time less risky than the specialized one?
Literature Review
The consequences of diversification in financial institutions and especially in banks were not much researched before the late 1990s. The financial literature addressing this prob-lem could be split according to the methodology and the sample used during the study. There are mainly three ap-proaches used in different articles on that topic: simulation, accounting and market. Regarding the data choice, the ma-jority of scholars investigate either sample of US or Europe-an bEurope-anks. There are several studies using world sample of banks or banking industry of some specific country.
The simulation approach is based on a “what if” anal-yses and it is intuitive that majority of studies using this approach were conducted before BHCs were permitted to diversify across activities. Boyd and Graham (1988) divided their study into two: real and hypothetical parts. First, they calculated risk/return characteristics of 249 publicly trad-ed banks and non-bank companies. On the second stage, they simulated mergers between banks and other financial firms and compared obtained risk (return) levels to the actu-al stand-actu-alone banks’ risk (return). Acquired results did not allow them to make a distinct and clear conclusion about diversification discount or premium. The similar results were received in the later work of Boyd, Graham and Hewitt (1993). Allen and Jagtiani (2000) extended this study. They created synthetic universal banks by combining banks not only with one non-bank firm, but also with two of them. This was done to capture the full universal banking environment and more potential of diversification. In addition, they looked at not only the total risk of BHCs but systematic risk also. Empirical results showed that diversified banks had lower overall risk but higher systematic risk. Higher market risk was propagated by the engagement in investment activities. Insurance activities showed no significant effect on market risk.
The second approach is based on the accounting infor-mation, reaped from the BHCs balance sheets and income statements. There are number of financial literatures using
this method and nearly all works conclude the diversifica-tion discount in the financial institudiversifica-tions. De Young and Rice (2004) investigated the changing sources of the US com-mercial banks’ income and had a closer look at the non-terest income (Non-II) streams. They have showed that in-creased share of non-interest income in the total operating income tends to increase the profitability of banks but it also generates more volatile revenue streams and worsens the risk-return tradeoff for the average US commercial bank. Stiroh (2004) studied the effect of increased non-interest generating activities on the banks’ risk and return. Using the data from banks’ financial statements, he also rejected the belief that expansion into non-traditional banking ac-tivities reduces risk via diversification effects. In addition, the positive and growing correlation between non-interest income and net interest income (NII) suggests how banks were focused on cross-selling strategies. Stiroh and Rum-ble (2006) came up with the same conclusion by examining the link between revenue diversification and risk-adjusted performance of the financial holding companies. The bene-fits of diversification were offset by the volatile and not more profitable non-banking activities. Schmid and Walter (2009) have studied the effects of activity and geographic diver-sification using the data of US financial firms from 1985 to 2004. They found the diversification discount in the financial conglomerates and showed that the specialized firms are more profitable. In contrast, there is a diversification premi-um created by diversifying geographically and in addition, they concluded diversification benefits for a subsample of the largest banks. Contradicting results were obtained by Elsas, Hackethal, and Holzhäuser (2010) using the dataset of exchange listed banks from nine well-developed coun-tries. They provided strong evidence that diversification en-hances the bank profitability. The results were robust using different measures of diversification and alternative subsa-mples. Acharya, Hasan, and Sounders. (2006) studied the diversification of individual bank portfolios using the dataset of Italian banks. The empirical study showed that diversifi-cation of loan portfolio does not guarantee the increased profits and reduced risk. Berger, Hasan, and Zhou (2010) and Berger, Hasan, Korhonen and Zhou (2010) investigate banking industry in emerging markets, particularly, in China and Russia. The results for both markets are quite similar. Banks from both countries did not gain from diversification, in general, but there is a diversification premium for foreign owned banks. In both countries, specialized banks have an advantage over the diversified counterparts in terms of performance and risk. Köhler (2013) studied the effect of non-interest income in German banking sector and provid-ed results consistent with the recent studies of EU banking industry. In particular, author investigated the link between the business model of bank and revenue streams from the non-interest income. The study concluded the diversifica-tion benefits when neither depending heavily on interest nor non-interest income.
Standard deviation of stocks weekly returns measured the banks risk. Empirical results showed positive relationship between risk and non-interest income. Laeven and Levine (2007) also found negative effects of activity diversification on the market valuation of the financial institutions using the data of 43 countries from different parts of the world. They have pointed on the increased agency problems, which were not compensated by the positive effects of conglom-eration. The result was unchanged after several extensions and robustness test. Baele, De Jonghe, and Vander Vennet (2007) studied the exchange-listed banks from 17 European countries in the period of 1989-2004. Bank franchise value was calculated to measure the long-run performance and from single index model, augmented by interest rate factor, risk measure was obtained. The results were not consis-tent to before mentioned studies. They have showed that there exists the strong positive relationship between bank performance and the degree of diversification. Regarding the risk, non-linear relationship between risk and diversifi-cation allowed diversified banks to reduce the risk to some threshold. In addition, decomposition of total risk into sys-tematic and idiosyncratic parts permitted them to provide results consistent with the theory. Namely, large and diver-sified banks showed higher exposure to systematic risk and the possibility to reduce bank specific risk through diver-sification. Van Lelyveld and Knot (2009) analyzed the set of European financial conglomerates, mixing banking and insurance activities, and found no universal diversification discount. After examining the data, 52% of financial groups showed premium while for the rest discount was a case. As possible triggers of diversification discount, three factors were named: size, interest of conflicts between sharehold-ers and debt holdsharehold-ers and opacity of financial conglomerates. In empirical tests, only the last factor did not qualify as a sig-nificant reason of discount. Using the stock market data of Japanese banks Sawada (2013) reveals the positive effect of diversification on bank’s performance. On the risk side, in contrast, there was no strong evidence that shifting into non-interest generating activities reduces the risk of banks. After investigating the components of non-interest income only fee based income exposed a potential to reduce risk.
Overall, various results were documented in the finan-cial studies investigating the effects of diversification on the risk and return of banks. Different methods of estimation and datasets were employed to reveal either diversification premium or discount. It is also evident that majority of recent works, especially using the accounting approach, publicized the negative effects of diversification.
Data and Methodology
The analysis has been conducted based on the ex-change-listed banks headquartered in one of the following European countries: Austria, Belgium, Cyprus, Finland, France, Germany, Greece, Ireland, Italy, the Netherlands, Portugal, Slovak Republic and Spain. All those countries are members of European Union and share the common currency – Euro. The sample covers 10-year period from 2004 to 2014. The period captures different macroeco-nomic, as well as stock market, conditions. For the banks
from the countries, where Euro was not an official currency throughout those 10 years, official exchange rates, set by the corresponding central banks, were used for the conver-sion of the respective data. Financial conglomerates, which were not conducting the traditional banking activities during the sample period, were excluded from the dataset. Banks defaulted, delisted, merged or acquired by other financial firms are dropped from the sample. As a result, panel data-set is unbalanced and final data-set of sample consists of 78 Eu-ropean banks, active in the given period.
Throughout the analysis, different variables from equity market and financial statements were used. Daily data of banks’ stock prices were obtained from the Yahoo Finance. Stock prices were adjusted for dividends and splits. Euro STOXX banks index represents the benchmark index. This is a STOXX sector index covering 29 leading European banks. Furthermore, EuroMTS Eurozone Government Bond Index (EGBI) is used to represent the bond index. Data was obtained from the official web site of a provider.
Annual accounting data was compiled from the banks’ fi-nancial statements, published in the official annual or finan-cial reports. For the sake of data comparability, all balance sheet and income statement variables correspond to the year-end standing and were calculated according to IFRS (International Financial Reporting Standards).
To explore the link between the diversification strategies and risk/return framework of the banks panel data regres-sion has been executed by using the within regresregres-sion esti-mator. This means that for the panel of 78 European listed banks averages and standard deviations were calculated for each year separately, rather than calculating them over the entire period in question. Constructed panel of bank-year observations allows us to detect the performance and risk variability caused by the changes in diversification strat-egies. In all specifications, dummy variables are included but not reported in the tables.
The Model Specification
This chapter discusses all the variables employed in the analysis and specifies the model through which the links between the diversification and risk-performance structure of banks is being analyzed. The effects of bank diversifica-tion on performance and risk are being explored using the following model:
The dependent variable Yi,t represents either the
perfor-mance measure or one of the risk indicators.
Measuring Performance
to estimate expected future profits and as a result, Tobin’s Q ratio is widely used as a proxy of banks’ franchise value. Tobin’s Q is calculated as the ratio of market value of assets (AM) to book value of assets (A). Market value of assets is
a sum of discounted cash flows to debt and equity. There is a problem in estimating the expected cash flow on debt (Hughes, Lang, Mester, & Moon, 1999).Therefore, an ap-proximation is done by summing the market value of equity (EM) and book value of liabilities (L). The first one shows
the market capitalization of a bank and is obtained by mul-tiplying the stock price on a number of outstanding shares. Market value of liabilities should be approximately the same as its book value (De Jonghe & Vander Vennet, 2008).But, the Tobin’s Q ratio has several shortcomings. It assumes that all financial agents are perfect optimizers and it does not take into account technical inefficiencies and some un-predictable random shocks. Those factors are most likely to cause the deviations from the maximum output. Problems associated with the Tobin’s Q can be avoided by consider-ing a stochastic frontier production function of Battese and Coelli (1992). The following stochastic frontier model with thetrans-log specification is obtained:
Error term - εi,t consists of two time varying
compo-nents: statistical noise - independently and identically distributed (i.i.d) and inefficiency component - obtained by truncation at zero, in order to capture non-negativity.
After the estimation of stochastic frontier model, the noise adjusted Tobin’s Q ratio (QNA) was calculated, as
pro-posed by De Jonghe and Vander Vennet (2008).
Right hand side of equation (4) consists of two compo-nents: potential Tobin’s Q ratio and the exponential term, capturing the degree of technical efficiency. is a fitted value of equation (2) and indicates to the level of bank’s market value when the bank is situated on the frontier.
Measuring Risk
To measure the risk in banking industry, well-known capital asset pricing model (CAPM) has been employed. Among other attractive properties, the possibility to split the total risk into its constituent - systematic and idiosyncratic parts, made this model the most popular and used one in a finan-cial world. The following single index model was considered:
where, Ri,tand RMt denote returns of bank’s stock and
mar-ket index, respectively. By construction, residual vector is uncorrelated with the market index returns. Based on this assumption, the following decomposition of total variance of a stock returns can be achieved:
From (6) can be seen that the variability of stock returns is a sum of estimated return variability of systematic factors . and variance of residuals As a result, three types of risk measures can be obtained and used in the analysis:
1. Total risk (σi) – standard deviation of banks’ stock
return;
2. Systematic risk (βi) – estimates of beta coefficient;
3. Bank specific risk – standard deviation of an error term.
A number of financial scholars have criticized the single index model on several grounds. As a result, a number of extensions and modifications, dealing with the problems, associated with the original model, have been proposed. In terms of banking, an important remark was made by Stone (1974) and later by Flannery & James (1984), suggesting the use of two index model when calculating the risk of an underlying that is sensitive to the interest rate changes. The bank stock returns are exposed to the interest rate shocks due to the typical mismatch between bank assets and liabil-ities (Flannery, 1984).The inclusion of an interest rate factor in the single-index model (Eq.5) was supported by the em-pirical studies. Flannery & James (1984) found a significant connection between the returns on stock and interest rate changes. In addition, the explanatory power of a model was enhanced by estimating the interest rate augmented model. Considering the interest rate changes, (5) can be rewritten as:
RI,t is a continuously compounded rate of return of
Eu-roMTS Eurozone Government Bond Index (EGBI). This is the first pan-European bond index and covers Eurozone’s largest and most widely traded government bonds. Accord-ing to the financial theory, there is a negative correlation between the return on bonds and interest rate changes. A rise in interest rate is accompanied by the fall in bond prices and consequently, bond return decreases (Mishkin, 2009). Therefore, positive value of γ estimate, which measures the interest rate sensitivity of stock returns, would lead to the fact that market value of bank stocks decreases. Thus, us-ing the European bond index to capture the interest rate effect on market value of stocks is a justifiable move. How-ever, changes in interest rate may also have influence on the return of benchmark index.
Measuring Diversification
On the right hand side of the equation (1), a set of inde-pendent variables were included. Xi,t-stands for the
diver-sification measure, either revenue based or asset one and additionally, non-interest share will be included to see how the market reacts when the BHC shifts its business into non-traditional banking activity.
As-set based and revenue based measures of diversification are the most popular indicators of diversification. Former is based on the information extracted from the balance sheet and later – from the income statement. Both metrics have advantages as well as disadvantages. Laeven and Levine (2007) claim that asset-based measure suffers from fewer measurement problems. The main argument is that through loan making additionally might also be generated non-terest income, like fees and commissions. Using the in-come-based measure may overestimate the dependence of a bank on non-banking activities. On the other hand, there are some drawbacks related to the balance sheet data. For instance, banks may keep substantial sum of assets on off-balance sheet and many non-traditional banking activi-ties, like mutual funds, derivatives or securities underwriting are indeed captured by off-balance sheet items. Therefore, investors may rely more on income statement information (Stiroh, 2006b).
Using the information from the financial statements the degree of bank’s diversification can be estimated by the fol-lowing formulas:
Difference between (8) and (9) is that from (8) lower levels of diversity measure (DivAsset) indicate that bank is
focused either on loan making or on non-traditional banking activities. However, (9) shows the degree of income diver-sification and banks with diversity measure (DivRev) close to
1, poses completely, perfectly diversified revenue streams. Both indicators measure the diversification from the differ-ent angles. Equation (8) points to the degree of asset di-versification and equation (9) to the revenue didi-versification. Here, should be noted that shares used in the calcula-tion of DivRev can be negative and/or greater than 1. This
is the case when the bank has incurred substantial losses on either interest bearing or non-interest activities. These extreme values of shares lead to the levels of diversification that are difficult to interpret. To avoid those difficulties and to keep the revenue diversity measure in the interpretable range of [0, 1] two possible solutions are suggested in the literature: First, exclude the extreme values from the cal-culation of (9) and second: take into account the proposal of Elsas, Hackethal, and Holzhäuser (2010) and calculate the total operating income as the sum of absolute values of interest and non-interest income. Both methods were test-ed and obtaintest-ed results were qualitatively and quantitatively nearly the same. In further analysis, Elsas, Hackethal, and Holzhäuser (2010) approach was preferable to avoid the re-duction of the sample size.
Other Independent Variables
In the equation (1), Zi,tis a vector of a number of control
variables and to control for time and country specific events corresponding dummy variables were added. The following control variables are included in Zi,t: Size of a BHC, financial
leverage, the share of total deposits in total liabilities, the quality of loan portfolio, operational efficiency and profit-ability.
Demsetz and Strahan (1997) found a significant link be-tween the size of BHC and diversification. The bank size is indicated by the natural logarithm of total assets. They concluded that large banks are more diversified than small ones. It is expected that the size effects would have a pos-itive impact on market beta but regarding the performance of a bank, it is difficult to make any inference in advance. The equity-to-assets ratio controls for the differences in the financial leverage of banks. The higher level of this ratio implies that bank is less interested to engage into more risky activities. Thus, well-capitalized banks are expect-ed to show lower risk level and the possibility to boost the performance. The share of total deposits in the total liabil-ities controls for the funding structure of a bank. Deposits generally are considered as low cost way of funding. The higher share of deposits indicates to the fact that customers consider this bank as reliable and believe in the soundness of the institution. Additionally, it shows whether bank has access to these inexpensive sources or not. As a result, it is likely to think that banks with more deposit funds will be highly valued by the market. In the world of asymmetric information, it is difficult to evaluate the riskiness of loan portfolio. To capture the quality of loan portfolio, the share of non-performing loans (NPL) in the total loans is widely used by analysts. The methodology of defining the loans as non-performing varies from country to country. However, these differences are highly reduced considering the Eu-ropean banking sector. According to ECB, loans are cate-gorized as non-performing if the payments of interest and principal are past due 90 or more days or when based on some strong arguments there is a doubt that loan will be paid back. In our sample of European banks, mostly the definition of NPL was homogeneous across countries. The impact of NPL on banks performance is expected to be neg-ative and on the risk positive. Cost-to-income ratio is one of the important indicators when assessing the operational efficiency of banks. It shows the share of overall operating costs in total operating income. Hence, it is expected that inefficient banks will show underperformance compared to the cost-efficient counterparts. There is no strong theoretical evidence to claim the negative or the positive relationship of this ratio to the risk structure of a financial institution. Finally, the return on assets (ROA) is included in the equation to re-flect the difference in accounting profitability of BHCs. If the positive influence on the performance is likely to be a case, the impact on risk is less clear in advance.
Empirical Results
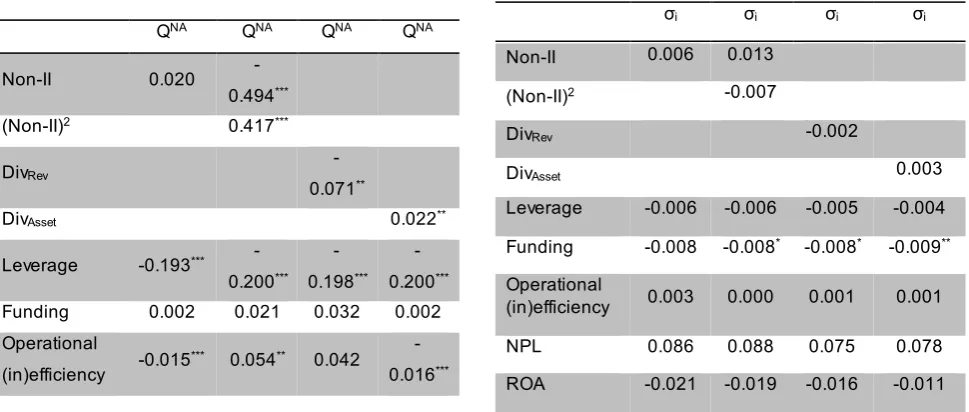
First, the equation (1) was executed to detect the perfor-mance of the banks using four different specifications. Table 1 presents the results of the fixed effect panel regression. Using the non-interest income share as independent vari-able together with control varivari-ables did not produce the sta-tistically significant coefficient. Although, the coefficient on non-interest income share is positive there is no point, at least statistically to claim that generating more non-interest income will be positively evaluated by the market and will enhance the performance. The squared term of non-interest income share is added to check for non-linear relationship between the performance and activity measure. Coefficients on non-interest income share and on its quadratic term are both significant at the 1% level. In addition, they showed joint significance at the 5% level. Opposite signs on the co-efficients is the indicator that the relationship is U shaped. Using the revenue diversification measure as independent variable produced the negative and at 5% significant co-efficient. Thus, the banks with more diversified revenue streams are deemed by the market as less performing than their specialized counterparts. This result contradicts to the findings of Baele, De Jonghe and Vander Vennet (2007), showing the significant diversification premium for the sam-ple of exchange traded European financial conglomerates. The possible reason of contradictory results can be the pe-riod of time analyzed. In the above-mentioned work, Euro-pean banks were analyzed in 1989-2004. This is the period with considerably different macroeconomic situation and banking strategies. The structural and the macroeconomic changes since 2004 together with the global financial crisis can be named as possible drivers of diversification discount in European banking in the last decade. Looking at the problem from the asset diversification angle, findings show that banks with diversified asset structure are valued more by the market. This fact once more highlights the statement that asset diversity and revenue diversity cannot be com-pared.
Table 1. Tobin’s Q Regression Results
Regarding the control variables, increased leverage, in all specification, had negative impact on banks’ perfor-mance. In some specifications, cost-inefficiency of banks was not only statistically but also economically significant results. There is statistical evidence, in all cases, that per-formance decreases with the increase of non-performing loans. Based on the regression results there is no point to associate big banks with the high performance. In all cases, coefficient of bank size is negative and in the first and fourth specifications statistically significant at 1% level.
Next step is to analyze the relationship between the di-versification and different types of risk. Table 2 shows the impact of diversification decision on total risk. From the pos-itive coefficient on non-interest income share can be said that shifting the activities in non-interest income generating businesses increases total risk of BHC. Although, this in-ference is statistically insignificant, economically it can be justified by the fact that interest income is more stable than non-interest income. Adding the quadratic term does not change the overall picture. As was the case in the third and the fourth specifications, suggesting no statistical evidence that revenue diversity reduces and asset diversity increases total risk.
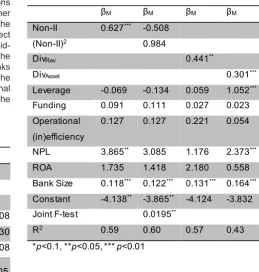
Table 4 shows the results of systematic risk regression. Placing more weight on non-interest generating activities increases the market risk of a bank. The coefficient is pos-itive and statistically significant. Checking for the quadrat-ic relationship, coeffquadrat-icients separately are insignifquadrat-icant but they show joint significance, which points to the U shaped relationship between variables. Regarding the diversifica-tion measures, both asset and revenue diversity coefficients are statistically significant and positive. This confirms that more diversified financial institutions are exposed to higher market risk. In addition, as amount of assets grows bank becomes more system-making element of a sector and is exposed to higher levels of market risk. The positive and statistically significant coefficient of bank size is a confirma-tion of this logic.
Other control variables are mostly insignificant in differ-ent specifications, indicating that changes in those ratios do not have a significant influence on the market risk of a financial institution.
Table 4. Systematic Risk Regression The only statistically significant coefficient was
regis-tered for funding term. The increased share of deposits re-duces the total risk. Beside the fact, that estimates of total risk regression are mainly statistically insignificant there are some economically meaningful results. The coefficient of bank size is negative but very close to zero and from here it can be concluded that size has nearly no effect on total risk. This makes more interesting to analyze the systematic and idiosyncratic parts of total risk.
In order to see the relationship between the idiosyn-cratic risk and diversification strategy, in a regression, bank specific risk measure was used as dependent variable. Ta-ble 3 presents the outcome of the regressions. As in total risk case, non-interest income share alone and together with squared term is statistically insignificant, but the pos-itive sign of a coefficient indicates that more income from non-traditional banking activities increases the bank specif-ic risk. In case of revenue diversifspecif-ication measure, result was both statistically and economically insignificant. The positive coefficient on revenue diversity contradicts to the modern portfolio theory claiming low levels of firm specific risk for diversified companies. On the other hand, in the last specification negative asset diversity coefficient supports the theory, but shows no statistical evidence. Concerning the control variables, NPL coefficient in all specifications was positive and statistically significant at 1% level. Higher share of non-performing loans had a positive impact on the bank specific risk. For all specifications, banks size effect acted as a statistically significant source of reduction in id-iosyncratic risk. It is economically acceptable following the finding of Demsetz and Strahan (1997), that large banks are associated with the high levels of diversification. The signs of coefficients on leverage, funding and operational inefficiency were in line with what was expected but at the same time, statistically insignificant.
Conclusion
The results of the study are in line with the conclusions made by other studies, but it contradicts to the outcomes of the majority studies using the sample of European banks in the analysis. There can be several reasons named that triggered these differences in results, but the most evident ones are the selection of a sample and the period of time analyzed. Last decade was much turbulent period for Eu-ropean banks. Global financial crisis and then following Euro crisis, without doubt, had much altered the European banking system. There was a completely different macro-economic situation during the 1990-ies, when banks were intensively expanding their scope of operations and devel-oping new products. On the contrary, due to the outbreak of the crisis, banks started shifting their business strategies and trying to operate in those fields where they had a com-parative advantage. This inference is supported by the fact that during the times of distress European banking system was gradually increasing the share of interest income.
The impact of diversification decision on banks’ perfor-mance and risk was tested by using different specification of the regression model. The results showed that for the sample of European banks, BHCs with more diversified revenue streams are less successful than their specialized counterparts. When looking from the side of asset diversi-fication, the opposite conclusion can be made. Concerning the effect on the total risk structure, there is no evidence, at least from the statistical point of view, to claim the positive or negative impact of diversification decision. The same holds for the bank specific risk measure. However, taking into account the systematic risk factor, there is a statistical ev-idence of positive relationship between diversification and market risk. Additionally, the interaction between the reve-nue based activity measure and performance is non-linear. The same can be concluded taking into account the market risk of a financial institution.
Overall, there is no clear evidence that more diversified banks are able to possess some comparative advantage over the specialized ones, in terms of risk and return. For the sample of European banks, the positive risk-return trade-off was not found. Explored diversification discount in European banks may be the indicator to the need of some de-conglomeration processes.
References
Acharya, V., Hasan, I., & Saunders, A. (2006). Should banks be diversified? Evidence from individual bank loan portfoli-os. Journal of Business, 79 (3), 1355-1412.
Allen, L., & Jagtiani, L. (2000). The risk effects of combining banking, securities, and insurance activities. Journal of Eco-nomics and Business, 52, 485– 497.
Baele, L., De Jonghe, O., & Vander Vennet, R. (2007). Does the stock market value bank diversification? Journal of Banking & Finance, 31, 1999-2023.
Barisitz, S. (2013). Nonperforming loans in Western Europe – a selective comparison of countries and national defini-tions. Österreichische Nationalbank, Focus on European Economic Integration, Q1/13, 28-47.
Basel Committee on Banking Supervision. (2012). Prin-ciples for the supervision of financial conglomerates. The Joint Forum's final report, BIS, 1-40.
Battese, G. E., & J., C. T. (1992). Frontier production func-tions, technical efficiency and panel data: With application to paddy farmers in India. Journal of Productivity Analysis, 3, 153–169.
Berger, A. N., Hasan, I., Korhonen, I., & Zhou, M. (2010). Does diversification increase or decrease bank risk and per-formance? Evidence on diversification and the risk-return tradeoff. BOFIT Discussion Papers, 9, 3-34.
Berger, A. N., Hasan, I., & Zhou, M. (2010). The effects of focus versus diversification on bank performance: Evidence from Chinese banks. BOFIT Discussion Papers, 4, 1-34. Bloomberg. (2012, June 27). Retrieved June 28, 2014, from http://www.bloomberg.com/news/2012-06-27/breaking-up-big-banks-hard-to-do-as-market-forces-fail.html
Boyd, J., & Graham, S. (1988). The profitability and risk effects of allowing bank holding companies to merge with other financial firms. A simulation study. Quarterly Review, Federal Reserve Bank of Minneapolis, 12, 2, 3-20.
Boyd, J., Graham, S., & Hewitt, R. (1993). Bank holding company mergers with nonbank financial firms: Effects on the risk of failure. Journal of Banking and Finance, 17, 43-63.
De Jonghe, O., & Vander Vennet, R. (2008). Competition versus efficiency: What drives franchise values in European banking. Journal of Banking & Finance, 32(9), 1820–1835. Demsetz, S. R., & Strahan, P. (1997). Diversification, size and risk at bank holding companies. Journal of Money, Credit and Banking, 29, 3, 300-313.
De Young, R., & Rice, T. (2004). Noninterest income and financial performance at U.S. commercial banks. The Fi-nancial Review, 39, 101-207.
Elsas, R., Hackethal, A., & Holzhäuser, M. (2010). The anatomy of bank diversification. Journal of Banking and Fi-nance, 34, 1274-1287.
Flannery, M. J. (1984). The effect of interest rate changes on the common stock returns of financial institutions. Jour-nal of Finance, 39(4), 1141-1153.
Hughes, J., Lang, W., Mester, L., & Moon, C.G. (1999). The dollars and sense of bank consolidation. Journal of Banking & Finance, 23, 291-324.
Laevine, L., & Levine, R. (2007). Is there a diversification discount in financial conglomerates? Journal of Financial Economics, 85, 331-367.
Mishkin, F. (2009). The economics of money, banking & fi-nancial markets (9th ed.). Boston: Pearson.
Sawada, M. (2013). How does the stock market value bank diversification? Empirical evidence from Japanese banks. Pacific-Basin Finance Journal, 25, 40–61.
Schmid, M., & Walter, I. (2009). Do financial conglomerates create or destroy economic value? Journal of Financial In-termediation, 18, 193-216.
Stiroh, K. (2004). Diversification in banking: is noninterest income the answer? Journal of Money Credit and Banking. 36(5), 853-882.
Stiroh, K. (2006a). A portfolio view of banking with interest and noninterest activities. Journal of Money, Credit and Banking, 38(5), 1351-1361.
Stiroh, K. (2006b). New evidence on the determinants of bank risk. Journal of Financial Services Research, 30, 237-263.
Stiroh, K., & Rumble, A. (2006). The dark side of diversifica-tion: The case of US financial holding companies. Journal of Banking and Finance, 30, 2131-2161.
Stone, B. (1974). Systematic interest-rate risk in a two-in-dex model of returns. The Journal of Financial and Quanti-tative Analysis, 9(5), 709-721.