Economic Affairs
DOI :India is second largest producer of horticulture commodities in the world after China. It accounts for about 30 percent of India’s agricultural GDP from 13.08 percent of cropped area. It also provides about 37 percent of the total exports of agricultural commodities. The sector has received focused attention mainly from the 7th plan period onwards (Planning Commission, 2011). Later, National Horticulture Mission was launched in 2005-06 as a Centrally Sponsored Scheme (CSS) to promote holistic growth of the horticulture sector through an area based regionally differentiated strategies. The scheme has been subsumed as a part of Mission for Integration Development of Horticulture (MIDH) during 2014-15. The country provides highly favourable condition for growing a wide range of horticultural crops such as fruits, vegetables, tuber crops, ornamental crops, medicinal plants, aromatic plants, spices and plantation crops. The annual area and
Temporal and Spatial Performance of Horticultural Crops in India
Harish Kumar Kallega, Amit Kar and V.C. Mathur
Indian agricultural Research Institute, New Delhi, 110012, India Corresponding author: [email protected]
Abstract
Horticultural sector accounts for about 30 percent of India’s agricultural GDP and 37 percent of the total exports of agricultural commodities. This sector has immense potential to promote trade and generate gainful employment during the process of value addition. This paper focused on temporal and spatial performance of horticultural crops in India. The growth in area and production of fruit crops was 1.82 percent and 1.8 percent respectively during 1996-97 to 2000-01 regardless of the focus through golden revolution in mid-1990s. However, the actual impact was observed during 2001-02 to 2005-06 as area and production growth was 8.92 percent and 6.43 percent, respectively. Growth in area under vegetables was negative during 1991-92 to 1995-96, which was increased to 4.13 percent in 2001-02 to 2005-06. The NHM was focused on bringing less fertile land under cultivation of plantation crops and targeting the small scale farmers in area expansion programme of flower crops. Hence, the positive shift in area under plantation and flower crops was observed in last decade shows prominence given to high value, commercial and market orientated horticultural crops. The states of Maharashtra (10.7 percent) and West Bengal (10.5 percent) shared largest area and production of horticultural crops in India. The major fruits growing areas were concentrated in southern and western India, whereas vegetables growing states concentrated in eastern India and about 80 percent of plantation crops are grown by southern states. Thus, the area specific regionally differentiated cluster approach needed for holistic development of horticultural sector. The diversification plan of the horticulture sector needs to identify area wise or region wise potential crops. Horticultural research should concentrate on technology generation appropriate to each region keeping in view of their specific agro-climatic and socio-economic condition.
Keywords:Horticulture, NHM, fruits, vegetables, plantation, flowers, diversification
production growth of fruits and vegetables from 1991-2005 was quite significant compared to the decline in area under cereals and cereal production which is growing at the rate of 1.4 percent per annum only in the last one-and-a-half decades (Mittal, 2007). The share of fruits and vegetables in the total value of agricultural exports has increased over the years from 9.5 percent in 1980-81 to 16.5 percent in 2002-03. But India is still lagging behind in actual exports of these produce. India produces 25 percent of world Banana and 44 percent world’s mango and guava, ranking first in the production of all those crops. Yet India’s exports of these two crops are nearly negligible of the total agricultural exports from India (Indian Horticulture Database, 2013). Horticultural produce have high demand in the international markets in both fresh and processed forms. Thus, this sector has immense potential to generate gainful employment and promote trade during process
Paper No.: 236 Received: 7 April 2015 Accepted: 21 September 2015
of value addition.
Systematic study of development of horticultural sector over the period of time with special focus on different subgroups like Vegetables, Fruits, Plantation crops, Flower crops will helps to formulate the in future policies of different subsectors. Also, spatial variation in different horticultural subgroups may provide knowledge on requirement of area pacific focus by policy makers. Overall the spatial and temporal variation in area and production of horticultural crops will helps in generating useful information for improving supply chain network, market linkages and formulating the area specific policies for horticultural production. Thereby, enhance the competitiveness in horticultural sector. In view of this, the study was attempted to make the comprehensive study on the temporal and spatial performance of horticultural commodities in India.
Database and Methodology
The purpose of the study is to analyse the overall horticultural sector with special focus on different sub-sectors like Vegetables, Fruits, Plantation crops and Flowers. Study on spatial and temporal performance of horticultural commodities was conducted using secondary data on area and production. The data was collected from National Horticultural Board, Gurgaon and Directorate of Economics and Statistics, Government of India. The Compound Annual Growth Rate (CAGR) and Instability Index (Cuddy-Della Valle Index) were analytical tools employed to study the temporal change in area and production of horticultural crops. The time series data on area and production was collected for 21 years from 1991-92 to 2011-12. For the convenience of the study whole period was divided into four sub-periods broadly representing different phases of horticultural growth. The period of 1991-92 to 1995-96 (5 years) and 1996-97 to 2000-01 (5 years) represents initial focus period on horticulture, where significant improvement in plan investment started in 8th Five Year Plan onwards called period of golden revolution. The period of 2001-02 to 2005-06 (5 years) Horticulture Mission for North East and Himalayan states was started in 11 states. The period of 2006-07 to 2011-12 (6 years) represents the period of National Horticultural Mission. The CAGR is obtained using the formula
Y
t= Y
0(1+r)
t(1)
The logarithmic transformation of equation (1) is given as,
ln Y
t= ln Y
0+ t ln (1+ r)
(2)
where, Yt is the value of the variable at tth period for
which growth is calculated, r is the compound annual growth rate.
Now, let ln Y0 = 1 and ln (1+r) = 2, the above equation becomes ln Y1 =1 +2t.1 and2 are estimated through the Ordinary Least Square (OLS) method and the compound growth rate (r) is obtained by,
r
= (antilog
2–1)
×
100
(3)
The use of simple Coefficient of Variation (CV) to measure the variation over-estimates the level of instability in the time series data that are characterized by long term trends. The use of Cuddy-Della Valle Index (CDVI) corrects the coefficient of variation for the trend component in the time series data (Della Valle, 1979). So, the CDVI is used in the present study to measure the instability in the area and production of horticultural crops.
CDVI
=
CV
1R2
(4)
where, CDVI is the instability index in percent, CV is the coefficient of variation in percent calculated by (/X) × 100 and 2
R is the coefficient of determination from a time trend regression adjusted by the number of degrees of freedom.
Results and Discussion
The focused attention on horticulture development was given during post-1993 period through an enhancement of plan allocation and knowledge-based technology development. As a result of this there was a marginal progress in productivity was observed (Mittal, 2007). The decade of 1990 was called as period of Golden Revolution for horticultural sector. However, the real attention on this sector was given only after 2000-01 onwards. The stable growth of production (CDVI of 2.12) of 5.57 percent was seen in 2006-07 to 2011-12. Growth of area under overall horticulture sector was higher during 01 to 2011-12 compared to 1991-92 to 2000-01 (Table 1 and Figure 1). This may be due to National Horticulture Mission of 2005-06, which focuses on integrated development of horticulture sector in production front, post-harvest side as well as infrastructure developmental initiatives.
Table 1: Temporal performance of horticultural Sector in India
Period Area Production
CAGR CDVI CAGR CDVI
Total horticultural sector
1991-92 to 1995-96 1.57 1.25 6.41 2.30
1996-97 to 2000-01 2.08 0.42 5.03 3.42
2001-02 to 2005-06 3.72 5.47 6.16 3.77
2006-07 to 2011-12 3.33 1.69 5.57 2.12
1991-92 to 2011-12 3.10 2.85 4.44 5.59
Fruit Crops
1991-92 to 1995-96 3.28 3.16 9.43 3.69
1996-97 to 2000-01 1.82 0.66 1.80 3.68
2001-02 to 2005-06 8.92 6.41 6.43 3.24
2006-07 to 2011-12 3.60 1.28 4.94 2.17
1991-92 to 2011-12 4.36 5.87 4.32 7.75
Vegetable Crops
1991-92 to 1995-96 -1.00 6.16 4.67 1.92
1996-97 to 2000-01 3.22 0.84 6.92 5.29
2001-02 to 2005-06 4.13 2.89 6.10 4.57
2006-07 to 2011-12 3.16 2.19 5.78 2.80
1991-92 to 2011-12 2.90 5.11 4.68 5.78
Plantation crops
1991-92 to 1995-96 4.42 1.67 6.06 5.44
1996-97 to 2000-01 -0.07 2.28 -0.83 8.60
2001-02 to 2005-06 2.47 1.25 3.19 15.10
2006-07 to 2011-12 1.93 2.73 5.22 12.58
1991-92 to 2011-12 1.85 3.59 2.23 10.59
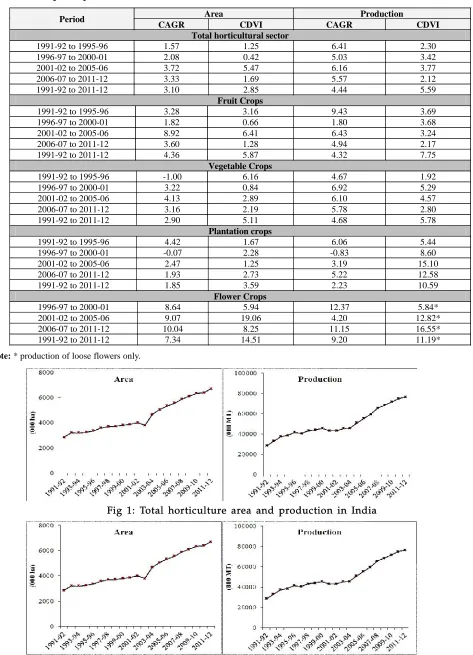
Flower Crops
1996-97 to 2000-01 8.64 5.94 12.37 5.84*
2001-02 to 2005-06 9.07 19.06 4.20 12.82*
2006-07 to 2011-12 10.04 8.25 11.15 16.55*
1991-92 to 2011-12 7.34 14.51 9.20 11.19*
Note: * production of loose flowers only.
Fig 1: Total horticulture area and production in India
that golden revolution focused much on development of fruit crops sector. The actual impact of golden revolution was observed after 2000-01 onwards, as most of fruit crops have gestation period of 4 to 6 years before fruit bearing. The study by Singh and Mathur (2008) indicates that the total gain in production of fruit crops during 1997-98 has come from area expansion despite the fact that yield growth was negative during the corresponding period. The growth rate in production of fruits during 2001 to 2012 was 6.43 percent, mainly due to production of Mango and Banana (Mittal, 2007). National Horticulture Mission (NHM) intervention brought 13.14 lakh ha area under fruit production as part of area expansion program in 11 and 12th Five Year Plan (Source: NHM website). As result of all these developments stable production (CDVI of 2.17) was observed from 2006-07 to 2011-12.
The major focus towards vegetable crops shifted only after 2001-01 (Table 1 and Figure 3). Growth in area under vegetables was negative (-1 percent) during
1991-92 to 1995-96, which was increased to 4.13 percent in 2001-02 to 2005-06. The growth in area and production was encouraging in recent years and it was mainly contributed by potato, onion, tomato and brinjal (Mittal, 2007). The NHM intervention in vegetables mainly focuses on protected cultivation (19.54 percent area), organic farming, IPM (Choudhary, 2013).
The major plantation crops grown in India are Coconut, Arecanut, Cashewnut, Coffee, Tea, and Rubber. The growth rate of 4.42 percent in area and 6.06 percent in production during 1992-1996 was observed due to the expansion of area in traditional areas of plantation crops (Table 1 and Figure 4). The NHM intervention in plantation crop sector mainly focused on bringing less fertile or unutilised land under cultivation i.e. to increase the area under non-traditional areas. Similar study conducted by Namasivayam and Paul (2004) shows positive growth in area, production and productivity of coconut in 1977-78 to 1986-87 and 1987-86 to 1996-97 Fig. 3: Vegetable crops area and production in India
Note: * production of loose flowers only
whereas growth in productivity was negative during 1997-98 to 2001-2002.
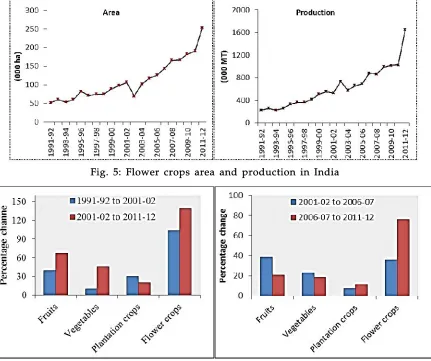
The major flower crops grown in India are Marigold, Rose, Chrysanthemum, Jasmine, Gladiolus, Tuberose, Orchids, Tulip, etc. Growth rate of 10.04 percent in area and 11.15 percent in production was observed from 2006-07 to 2011-12 mainly due to higher export demand for flower crops (Table 1). The requirement of higher initial investment discourages the small farmers to undertake floriculture industry. In this regard NHM targeting the small scale farmers in area expansion programme of flower crops. The programme brought 6029 ha area under loose flowers cultivation and 1269 ha area under cut flowers cultivation in 2013-14 (NHM website).
The shift in area within the horticultural sector was shown in Fig. 6. There was a significant increase in area during 2001 to 2012 compared to 1992 to 2001 in different horticultural subgroups. In last decade, positive shift in area was observed mainly in plantation crops and flower crops. This shows prominence given to high value,
commercial and market orientated horticultural crops in recent years.
Spatial distribution of horticultural crops in India shows that some parts of county have more advantage in growing particular crops. This is mainly due to the endowment of natural resources, adequate rainfall and other favourable climatic conditions. Among different states, Maharashtra (10.7 percent) shared largest area under horticultural crops followed by Karnataka, Andhra Pradesh and Kerala. But in terms of production West Bengal (10.5 percent) is major producer of horticultural crops followed by Andhra Pradesh, Uttar Pradesh, Tamil Nadu and Karnataka (Figure 7). Disaggregated levels of area and production of horticultural crops was shows (Table 2) major fruits growing areas concentrated in southern and western India, whereas vegetables growing area is concentrated in eastern India and about 80 percent of plantation crops are grown by southern states. This reiterates the fact that some crops have the comparative advantage in growing at particular region. Consequently some region gets Fig. 5: Flower crops area and production in India
Fig. 7: State wise area and production horticultural crops in India
Table 2: Major states shares in area and production (%) 2011-12
Particulars >10% Area 5 to 10% Area
Area
Fruits Maharashtra (23.3), Andhra Pradesh
(10.1)
Tamil Nadu (5), Gujarat (5.3), Karnataka (5.6), Uttar Pradesh (5.1)
Vegetables West Bengal (14.9)
Uttar Pradesh (9.5), Bihar (9.6), Andhra Pradesh (7.4), Madhya Pradesh (5.7), Gujarat (5.8), Odisha (7.7), Maharashtra (6.6), Karnataka (5.1)
Plantation crops
Tamil Nadu (16.7), Karnataka (24.6),
Kerala (26.8) Andhra Pradesh (9.8), Odisha (6), Maharashtra (5.8)
Flowers Andhra Pradesh (25.3), Tamil Nadu
(12.8), Karnataka (11.6)
Madhya Pradesh (6.2), Gujarat (6.3), Maharashtra (7.5), West Bengal (9.5)
Spices Gujarat (17.2), Rajasthan (22.8) Karnataka (8.3), Madhya Pradesh (9.4)
Aromatic crops Rajasthan (55.5), Uttar Pradesh (26.4) Madhya Pradesh (8.6)
Production
Fruits Maharashtra (13.8), Andhra Pradesh
(12.9), Tamil Nadu (11.2)
Gujarat (9.9), Karnataka (8.5), Uttar Pradesh (7.6), Bihar (5.2)
Vegetables West Bengal (15), Uttar Pradesh
(11.9), Bihar (10)
Andhra Pradesh (7.7), Madhya Pradesh (6.5), Gujarat (6.5), Odisha (6.1), Tamil Nadu (5.9), Maharashtra (5.7), Karnataka (5)
Plantation crops
Tamil Nadu (28.1), Karnataka (25.9),
Kerala (25.5) Andhra Pradesh (8.6)
Flowers Andhra Pradesh (23.6), Tamil Nadu
(20.2), Karnataka (12.9) Madhya Pradesh (9.2), Gujarat (8.3), Maharashtra (6.3)
Spices Andhra Pradesh (19), Gujarat (14.9),
Rajasthan (14.7) Karnataka (8.5), Madhya Pradesh (7.8), Tamil Nadu (7.2)
Aromatic crops
Rajasthan (26.4), Arunachal Pradesh (19.3), Madhya Pradesh (18.9), Chhattisgarh (16.2), Tamil Nadu (12)
higher yield of that crops and thereby higher production. For instance about 35 percent of fruits produced by Maharashtra, Andhra Pradesh, and Tamil Nadu and about 35 percent of vegetables produced by West Bengal, Uttar Pradesh and Bihar. Similarly, 80 percent of plantation crops production comes from Tamil Nadu, Karnataka and Kerala.
Conclusion
Horticulture sector is facing constrains such as low crop productivity, limited irrigation facilities and underdeveloped infrastructure support like cold storages, markets, roads, transportation facilities, etc. Thus, efforts are needed in the direction to capitalize on our strengths and remove constrains to meet the goal of moving towards a formidable horticultural growth in India. On the other hand, India’s long growing-season, diverse soil and climatic conditions comprising several agro-ecological regions provide comparative advantage in growing a variety of horticulture crops. So area specific regionally differentiated cluster approach needed for holistic development of horticultural sector. The diversification plan of the horticulture sector needs to identify area wise or region wise potential crops. The area under low yielding vegetables and fruits should be replaced by more productive and profitable one. Horticultural research should concentrate on technology generation appropriate to each region keeping in view of their specific agro-climatic and socio-economic condition. In order to reduce the post-harvest loss, transportation loss, it is better to establish the markets and necessary infrastructure facilities like godowns, cold storage units and establish the processing units nearer
to the production centre. This will also help in reducing the sudden fluctuations in market prices. Also, an adequate credit facility at subsidized rate is required to encourage the small farmers to undertake commercial agriculture.
References
Choudhary, S.K. 2013. Contribution of National Horticulture Mission in agricultural develop-ment,International Journal of Advanced Research in Management and Social Sciences,2(6): 52-64. Della, Valle, P.A. 1979. On the instability index of time
series data: a generalization,Oxford Bulletin of Economics and Statistics,41(3): 247-248.
Government of India, 2011. Report of the working group on Horticulture and Plantation crops, 12th Five Year Plan, Planning Commission, New Delhi. Government of India, 2013. Indian Horticulture
Database, National Horticulture Board, Ministry of Agriculture, New Delhi.
Mittal., S. 2007. Can horticulture be a success story for India?,Working Paper No. 197, Indian Council for Research on International Economic Relations, New Delhi, India.
Namasivayam, N. and Paul, R.V. 2004. Trend Analysis of Coconut Production in India, Journal of Plantation Crops,32(3): 64-67.