REVIEWARTICLE
Geo-social visual analytics
Wei Luo and Alan M. MacEachren
GeoVISTA Center, Department of Geography, Pennsylvania State University, PA, USA
Received: March 28, 2013; returned: May 25, 2013; revised: July 9, 2013; accepted: August 21, 2013.
Abstract:Spatial analysis and social network analysis typically consider social processes in their own specific contexts, either geographical or network space. Both approaches demon-strate strong conceptual overlaps. For example, actors close to each other tend to have greater similarity than those far apart; this phenomenon has different labels in geography (spatial autocorrelation) and in network science (homophily). In spite of those conceptual and observed overlaps, the integration of geography and social network context has not received the attention needed in order to develop a comprehensive understanding of their interaction or their impact on outcomes of interest, such as population health behaviors, information dissemination, or human behavior in a crisis. In order to address this gap, this paper discusses the integration of geographic with social network perspectives ap-plied to understanding social processes in place from two levels: the theoretical level and the methodological level. At the theoretical level, this paper argues that the concepts of nearness and relationship in terms of a possible extension of the First Law of Geography are a matter of both geographical and social network distance, relationship, and interac-tion. At the methodological level, the integration of geography and social network con-texts are framed within a new interdisciplinary field: visual analytics, in which three major application-oriented subfields (data exploration, decision-making, and predictive analysis) are used to organize discussion. In each subfield, this paper presents a theoretical frame-work first, and then reviews what has been achieved regarding geo-social visual analytics in order to identify potential future research.
Keywords: geography, social network, visual analytics, First Law of Geography, data ex-ploration, decision-making, predictive analysis
1
Introduction
whereas they also change or reshape the traditional notion of geographical effects (e.g., distance) [115]. For example, small social groups are usually geographically cohesive (with the geographic span of group members a function of group size); but large social groups are less cohesive and less likely to exhibit spatial clusters [147]. Furthermore, because of advances in communication and transportation technologies over the past decade, there is a shift from networks that are both geographically and socially close (e.g., physical commu-nities) to networks that are socially near but geographically dispersed (e.g., on-line com-munities) [185,195]. To effectively understand the complex interaction between space and techno-social networks, it is necessary to encourage interdisciplinary understanding (e.g., geography, network science) through integrating current theories and methods (e.g., spatial thinking, social network theory) and to develop new theories and methods.
Recent research in physics emphasizes the power of networks in which space becomes a background to visualize and understand network analysis results [175]. Research in geog-raphy encourages the integration of spatial thinking into traditional social science through the concepts of space, place, and time [79,80], but often treats networks in a simplistic way. This paper argues that space and social networks should be considered simultane-ously when framing research on human activity. We contend that this perspective has not received enough attention and provide examples throughout the paper to support this contention. We further contend and present evidence that the new multidisciplinary re-search field of visual analytics provides an approach and methods that are well-suited to understanding the interaction of geographical and social network contexts. Visual analyt-ics is defined as “the science of analytical reasoning facilitated by interactive visual inter-faces” [176, p. 4]. A core objective of research in visual analytics is to provide a framework for integration of computational analytical methods with visual interfaces to both the in-formation of interest and the computational methods that enable human analysts to cope with large, complex, and heterogeneous data sources and complex questions that these data sources make it possible to address.
Understanding large and complex techno-social networks and their interaction with space at geographic scales requires advances in computational methods. However, com-putational methods alone have limits and biases because of the predefined structures they have, which greatly limit their analytical power. The process and results of any compu-tational techniques have limited value without input from human analysts to select ap-propriate methods, to set parameters, to interpret results, to understand what to do next, and to draw conclusions [11]. Visualization of data and computational processing gives users an intuitive representation, greatly promoting application of human perceptual and cognitive information processing capabilities. A simple combination of visualization with computational analysis, however, is not sufficient. Thus, the goal for visual analytics is to integrate human and computational reasoning in more fundamental ways, bringing the experts’ background knowledge, creativity, and intuition into the analysis process through an interactive visual environment, in order to combine the strengths of humans and com-puters to enable an insight gaining process [105].
theo-retical framework in which geography and social network contexts can be combined and through which visual analytics methods can be developed and applied (Section 2), (2) to introduce “geo-social visual analytics” as an integrated analytical approach grounded in the conceptual framework (Section 3), (3) to review what has been achieved in relation to the integration of geographic and social network contexts in relation to three core tasks for geo-social visual analytics: data exploration, decision-making, and predictive analysis (also Section 3), and (4) to use the review of the current state of the art to identify potential future research challenges for advancing their integration (Section 4). From here on, we will refer to the interaction of geographical and social relationships as geo-social relationships, and the interaction between both in terms of visual analytics as geo-social visual analytics. The key distinction between geo-social visual analytics and prior work ingeo-visual ana-lytics[10] is the explicit integration of social network perspectives and methods into the approach and tools.
2
Geo-social relationships at a conceptual level
The theoretical framework we propose as a base upon which to develop and apply visual analytics methods that enable understanding of human processes draws upon a wide range of perspectives from human geography and social sciences more generally. One theme that connects the perspectives is thatsocial processes take place within particular contexts. The two focused on here are spatial and social network contexts, each of which has been addressed in the past with specific methods and perspectives. Spatial analysis in social science is used to identify geographical patterns that result from social processes and to understand how space affects such processes. Most spatial analysis is based on an explicit or implicit assumption of the First Law of Geography [180, p. 236]: “Everything is related to every-thing else, but near every-things are more related than distant every-things.” Social network analysis is used to understand how relationships among actors (i.e., individuals, groups, or other social collectives) within a network affect or are affected by social processes [187]. Social network analysis has an assumption, complementary to the First Law cited above, that actors with similar relations may have similar attributes/behaviors. Spatial analysis and social network analysis consider social phenomena in their own specific contexts, either geographical space or network space, but as we outline below, considering both contexts together when they contribute simultaneously has the potential to achieve new insights about human processes.
the actors behave: how the places influence actors’ behaviors and attributes; how the ac-tors’ behaviors change the territory. The overlap area in Figure 1 between the territorial embeddedness and the societal embeddedness fits the First Law of Geography [180]. The overlap area between the network embeddedness and the societal embeddedness fits the homophily principle in social network analysis theory: similarity breeds connection [142]. The overlap area between the territorial embeddedness and the network embeddedness fits a common phenomenon: how space constrains the development of networks and how networks reshape the space. The three overlap areas in Figure 1 indicate that they are not mutually exclusive, but interact with each other; the emphasis is on the interaction between geographic and social network context and the impact of the interaction on outcomes of interest. The overlap area suggests a possible extension of the First Law of Geography: Ev-erything is related to evEv-erything else, but near things are more related than distant things. Nearness can be considered a matter of geographical and social network distance[73].
In addition to distance, the other two important concepts implied in the First Law of Geography are relationship and interaction: “everything is related to everything else.” Flint [72, p. 33] argues that “the nature of a place is the combination of both locations and their connections to the rest of the world.” Prager [149] also argues that geographical lo-cations would be unrelated without relationships and interactions, whereas such relation-ships and interactions would be meaningless without the context geographical locations provide. Some of those social relationships may be constrained within the place, whereas others may stretch out to link geographical locations to wider relations and processes [139]. There is an increasing understanding of the importance of combining geographical space and networks from different sub-disciplines within geography, such as political geogra-phy [122], economic geography [166], and geographical information science (GIS) [29]. Staeheli [169, p. 160] argues that spaces become “social locations” embedded in “webs of cultural, social, economic, and political relationships.” Ashdown [16] even argues that the political power is now shifting from a dominance of western culture to a collective gover-nance at the global scale, because we have come into a new interlocked age (i.e., of complex, interconnected networks) that causes our destinies to be shared with our enemies.
sex-Geo-Social Relationship
Territorial Embeddedness
Societal Embeddedness
Network Embeddedness
Homophily Geo-Network
The First Law of Geography
Figure 1: Proposed conceptual framework for geo-social relationships based on fundamen-tal categories of embeddedness [92]. The framework consists of three kinds of embed-dedness: territorial, network and societal. The paired overlaps each match with specific perspectives, as indicated and the joint overlap of all three areas suggests the extension of the First Law of Geography.
ual, and health-related), and the interaction of such individual-level behaviors develops macrosocial phenomena observed in a spatiotemporal framework.
are more related than distant things/ones; Nearness and relationship can be considered a matter of geographical and social network distance, relationship, and interaction.
In addition to the exploration of geographical and social relationships and interactions, the conceptual framework (Figure 1) allows such relationships to be put into particular societal contexts (i.e., political, economic, cultural). On the one hand, the premise “near things are more related than distant things” in the First Law of Geography implies that certain local factors and circumstances can make geo-socially close areas different from geo-socially distant areas. For example, spatial proximity together with connections that link spatially heterogeneous groups in the population (i.e., city-wide travel of select indi-viduals) are two major factors that determine the spatial layout and the temporal sequence of disease transmission [138]. And, recent research by Onnela, et al. [147] suggests that the size at which spatial cohesion of groups breaks down (about 30 members) coincides with the optimal group size for cooperation in social dilemma situations. On the other hand, the premise “everything is related to everything else” indicates that there are multiple factors that make contributions to patterns and connections among areas. For example, geograph-ical homophily has a major impact on international trade among developing countries, whereas political and cultural homophily matters the most for bilateral trade between de-veloped and developing countries [101,206]. The societal context provides the framework to explore different factors (i.e., political, economic, cultural) behind observed geo-social patterns, and how such social patterns interact with those factors to generate new geo-social patterns.
In work that complements the discussion above of geo-social integrations at the con-ceptual level, Adams, Faust, and Lovasi [2] identify five conceptual strategies for the in-tegration based on current geo-social relationship research: (1) spatial impacts on the de-velopment of social networks over varying spatial scales, such as offices [159,197], com-munities [55,70], and so on; (2) the impact of social network on the places people select to inhabit [188]; (3) the use of peer network structures to determine neighborhood bound-aries [93]; (4) the interactive impacts between spatial and social relationships [125,150,164]; and (5) multiple context impacts on outcomes related to social, health, and other pro-cesses [58,143,173]. The five conceptually geo-social integrations also fit the conceptual framework (Figure 1). The first integration focuses more on spatial constraints; the sec-ond emphasizes the network effects on residence selection; the third and fourth stress the interaction between geographical and network relationships; and the last highlights the multiple context impacts on outcomes.
that there is no single correct way to interpret and visualize data [168]. Fifth, both methods acknowledge the importance of situating knowledge construction into the historical, geo-graphical, and cultural context. Lastly, both methods recognize the existence of uncertainty in the data.
3
Geo-social visual analytics at a methodological level
Building upon the introduction to geo-social relationships at a conceptual level, this section discusses how to put the geo-social relationships into practice. From an application per-spective, visual analytics methods can be classified into three groups focused on support for: data exploration, decision-making, and predictive analysis. This classification is used here to organize the methodological level in terms of geo-social visual analytics. Visual an-alytics aims to enable the human reasoning process, so it must build on an understanding of that reasoning process [177]. For the above three categories in visual analytics, this paper presents reasoning frameworks related to geo-social perspectives for each group first, and then discusses corresponding geo-social visual analytics technologies in order to identify potential future research directions.
3.1
Data exploration
3.1.1 Conceptual framework
Data exploration is a primary task in visual analytics to make sense of overwhelming amounts of disparate, conflicting, and dynamic data in a novel manner. Here, we use the Feature-ID model for geovisualization (Figure 2) [128], an extension of an earlier pattern-matching model of cartographic visualization [130], as the reasoning framework for data exploration in terms of geo-social visual analytics. The pattern-matching model, in turn, draws upon a general scientific visualization perspective based on human cognition [76] to support understanding of human-display interaction in the context of map-based geovisu-alization.
Figure 2: Feature-ID model of geovisualization; elaboration of ideas first presented in Fig-ure 8.1 in [128]. The model focused on identifying key components in visually-enabled reasoning about geographic phenomena and relationships.
among “seeing,” “interpreting,” and “constructing-knowledge” at each step. Therefore, geovisualization works as a larger cognitive system to support a human reasoning process. The framework provides a general model for understanding the visual and cognitive processes involved in interpreting and reasoning with geographic representations to ad-dress place-based questions. Extending the framework to geo-social analysis will require integrating: what has been learned about human perception and cognition of spatializa-tions [65,66], an understanding of how geographic scale social processes are conceptual-ized, and an understanding of the more complex reasoning process required by analysts attempting to understand the potentially complex relationships in geo-social processes. More generally, geo-social visual analytics aims to understand the interaction between two contexts and the impact of multiple contexts on reasoning outcomes through integrating social network space into geographic space to provide users a broader perspective. The following section illustrates the perspective through examples from existing research that each offers a step toward the objective of geo-social visual analytics to enable data explo-ration.
3.1.2 Geo-social visual analytics in data exploration
relationships among geographical areas (e.g., nation, state, county), and (2) geo-social re-lationships among individuals at discrete locations (e.g., locations of mobile phone use, individual household locations, etc.).
Geo-social relationships among geographical areas Geo-social relationships among geo-graphical areas cover a wide range of topics: such as migration flows at the city scale [152], state scale [148,182], or country scale [90]; transportation flows [13,57,89]; international trade among countries [68,69]; sports competition among countries [4]; and so on. In an early example shown in Figure 3(a), Tobler [181] uses a network representation to describe the migration among different states in the U.S. In work grounded in geovisualization and geovisual analytics, Guo [86] proposes an integrated interactive visualization framework that is used to effectively discover and visualize major flow patterns and multivariate rela-tions from the county-to-county migration data in the U.S (Figure 3(b)). In complementary recent research, Wood et al. [199] propose an origins and destinations (OD) map to preserve all origin and destination locations of the spatial layout through constructing a gridded two-level spatial treemap.
The above work assumes that geographic location defines the spatial-social process with explicitly spatial representation and implicitly network representation, but the as-sumption only holds partially true for the modern interconnected world. Such represen-tations reflect a situation in which the current integration of network analysis in GIS only focuses on a mathematical perspective that emphasizes graph theory and topology compo-nents of networks [54]. Such representations do not allow users to explore the relationship between geographical space and social space, because they ignore network theory behind the network representation. Miller [145] also suggests that geographic phenomena with strong social components (e.g., infectious disease propagation [52]) do not appear to fol-low a Euclidean metric. Thus, geographical proximity does not necessarily mean social closeness and conversely, geographical long distance does not necessarily result in social isolation. From a cognitive perspective, explicitly spatial representation and implicitly net-work representation can mislead human intuition about social relationships among actors and their relationships to place. Thus, it is necessary to involve explicit network represen-tations to consider the importance of social position, social distance, and social space.
Andris [14] proposes five benefits to involving an explicit network representation within a geographical environment:
(1) network community structure methods can identify clusters to understand the group of interconnected places as a unit rather than as dense collocations;
(2) node measures (i.e., degree, betweenness) can show the power of places;
(3) network system measures like degree distribution, closeness distribution, and clus-tering coefficients can indicate the role of any connected geographic region over the whole system;
(4) multiple social flow layers can be added simultaneously like spatial overlay functions in a geographical information system (GIS) to better evaluate interaction between places; and
(5) explicit network representation performs better to model the case in which spatial closeness does not correspond to stronger social flows between places.
a. b.
Figure 3: (a) State to state migration from 1995 to 2000. Adapted from Figure 7 in [181] with Flow Mapper program fromCSISS.org. (b): Flow mapping and multivariate visual-ization of large spatial interaction data. Figure courtesy of Diansheng Guo. For additional information on the research it is derived from, see [86].
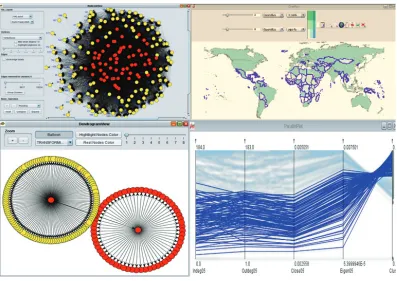
that supports network, geographical, and attribute spaces in this way to allow the explo-ration of spatial-social networks among them (Figure 4). The GeoSocialApp is a prelimi-nary tool based on an early, less comprehensive version of the conceptual framework for geo-social relationships discussed in this paper. In the GeoSocialApp, different interactive and linked views for network, geographical, and attribute spaces, respectively, correspond to network embeddedness, territorial embeddedness, and societal embeddedness (see Fig-ure 1). However, the GeoSocialApp is only a first step toward instantiating our overall framework and its present capabilities connect the three components without fully inte-grating them and without a full range of spatial and network analysis methods that will be required to support many of the ideas presented in this paper. That said, a brief description of the GeoSocialApp will serve to illustrate initial strategies for implementing the overall framework.
With explicit network spaces (in a dendrogram view and node-link view), GeoSo-cialApp users can have an intuitive understanding of social position, social distance, and social groups directly. For example, with the international trade network among 192 coun-tries in 2005 as a case study, two groups identified through the dendrogram view show a core-periphery structure in the node-link view in which the red nodes are in the core and the yellow nodes are in the periphery. Since each node represents one country in the map view, the results in the map also show that the countries in the world have a hierarchical structure in which red nodes in the node-link view are economic core countries without highlight and yellow nodes are economic periphery countries with highlight. The parallel coordinate plot allows users to explore the power of places based on the network measures for each country. Core countries that have a low clustering coefficient (a measure of de-gree to which nodes in a network tend to cluster together) have high values with the other four variables (in-degree, out-degree, closeness, and Eigenvector). The negative relation-ship implies that rich countries may benefit more from more diversified trade partners and small economies may benefit more from concentrated trade partners.
Unlike geographical distance measures, a new shortest-path distance based on node cen-trality measures is implemented into SPaTo Visual Explorer [200]. This tool can easily identify the shortest social distance among different cities based on the worldwide air-transportation network. While the SPaTo Visual Explorer implements analytical methods that are relevant to the overall geo-social visual analytics perspective we present here, the authors do not ground the work explicitly in any conceptual framework for integration of spatial with network contexts. Their related work (cited above) on the nature of borders in “spatially embedded multi-scale interaction networks” [175], however, illustrates how multiscale human mobility can be understood through what we would categorize as geo-social visual analytics methods (although the authors do not use those terms). Although Theimann, et al. [175] make some use of network statistics in their analysis, we would position the analysis and its interpretation in the overlap of territorial and network embed-dedness in relation to the conceptual framework outlined in Section 2.
Geo-social relationships among individual locations Geo-social relationships among individual locations include ones reflected in road networks [19,56], commuting behav-iors [112], location-based social networks [60], and social media networks [204]. Kwan and Lee [116] apply geovisualization methods to explore activity patterns of women in Lexing-ton, Kentucky as they relate to the transportation network. Specifically, they use GPS data collected through a travel data collection test to explore trips by women without children under 16 years of age. Their analysis used 3D GIS-generated space-time path depictions to help find that trips by this subset of women mainly use highways and major arterials, thus illustrating that individuals within a particular demographic group can share activity patterns that use geographic networks in similar ways. In subsequent work, Kwan [114] ap-plies the concept of human extensibility (the ability of individuals to utilize space-adjusting technologies, including transportation and communication, to overcome the friction of dis-tance) to more deeply explore the complex daily interactions of individuals grounded in interlinked geographic and social networks across scales from local to global. In comple-mentary work in the geovisual analytics domain, Shen and Ma [165] create MobiVis which allows visual analytics of social and spatial information in a human interaction network over time, and they illustrate how easily this tool supports comparison of individual and group behavior patterns (using the MIT Reality Mining Dataset [61]). Those studies, and most similar research studies, illustrate that geovisualization and geovisual analytics can reveal distinctive patterns of spatial and social behaviors of different human interaction groups in a straightforward way [49,99,120,154,167].
Complementary to the visualization advances outlined above, computational methods to explore spatial-social human interactions focus on developing quantitative representa-tions of human movements. For example, with mobile phone data, Gonzalez et al. [78] and Rhee et al. [155] find that human trajectories are characterized by a regular, time indepen-dent characteristic length scale and are more attracted to more popular places, like home or work. With the circulation of bank notes in the United States, Brockmann et al. [39] find that the traveling distances of human mobility decay as a power law, and that the distri-bution of the time people stay in one small, spatially confined region follows algebraically long tails. Chaintreau et al. [44] and Karagiannis et al. [102] observe that inter-contact time between mobile devices shows an approximate power law in the range of 10 minutes to 1 day. Overall, all of the above studies suggest the existence of scale-free characteristics observed in most networks in which a small number of nodes have a high degree distri-bution and a large number of nodes have a small degree distridistri-bution [6,22] in both spatial and temporal dimension. In other words, the number of people in terms of spatial distance or inter-contact time has a scale-free distribution: a small number of people travel a long distance or have a long inter-contact time with others, whereas a large number of people travel a short distance or have a short inter-contact time with others. The scale-free char-acteristics identified in the human movement data over spatial and temporal dimensions are a representation of the whole system distribution of all individuals. Representing other attributes (i.e., location, demography) of each individual in other visual analytics views and using standard linked brushing methods to connect points in the scale free graph to their matching entities in other views allows users to explore questions in terms of “who,” “where,” “when,” and “what” on each individual.
al. [20] develop a unified model to study the multiscale nature of human mobility and its relationship with epidemic spread, including airline traffic networks and short-range commuting interactions. Crandall et al. [53] take work a step further to develop models that quantify how likely it is that two people know each other, if they have a very close geographic distance at approximately the same time. These results open new directions for new perspectives on not only link prediction but also network dynamics with spatial, so-cial, and even multiscale considerations. The topic of predictive analysis will be addressed directly in Section 3.3 below.
3.2
Decision-making
In addition to enabling an efficient insight gain from a complex dataset, another major application in visual analytics is to use the insight to support a decision-making process. To design a visual analytic tool to effectively support human decision-making related to the interactions among geographic and social contexts, it is important to understand how people process information and how people make decisions in real situations.
3.2.1 Conceptual framework
Decision-making is a process to reduce uncertainty and doubt, enabling individuals to take a reasonable course of action facing complex decision problems, often in time pressured sit-uations [91]. The process of decision-making consists of three steps: analyze the situation, find out relevant alternatives, and select an alternative by certain criteria [109]. Here, we draw upon two theoretical perspectives to frame the discussion of geo-social visual analyt-ics for decision-making: situation awareness and spatial multicriteria decision analysis.
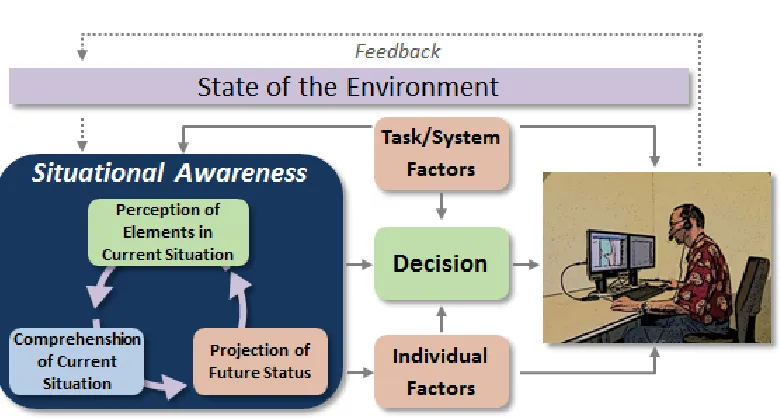
The conceptual framework from situation awareness (SA) can represent the making process from a cognitive perspective and also integrate data exploration, decision-making and predictive analysis in the context of visual analytics. SA can be defined as “the human user’s internal conceptualization of a situation” [110, p. 3609]. Endsley [64] defines three levels of SA: the first level is the perception of elements in the current situ-ation, the second level is the comprehension of the current situsitu-ation, and the third level is the projection of future status (Figure 5). A reasonable decision-making process should be based on an understanding of the current situation from the first two steps of SA, and also a prediction for future situations. The first two steps also match Figure 2 in terms of a mental model building process to comprehend the current situation.
Figure 5: The process of decision-making for situation awareness. Situation awareness is defined as the human user’s internal conceptualization of a situation, which plays a key role in effective decision making. Figure adapted from [109]. Spatial data analysis and social network analysis can support decision-making from different perspectives, so the effective integration of both can enhance human user’s internal conceptualization of a situation.
3.2.2 Geo-social visual analytics in decision-making
Spatial data analysis and social network analysis have their independent advantages to support decision-making. As discussed in the proposed conceptual framework for geo-social relationships (Figure 1), both analysis approaches should be considered together. This section illustrates how integrating spatial data analysis and social network analysis frames the decision-making problem in a unique and insightful way. We argue here that their integration can be more powerful in support of decision-making than the sum of the parts. Limited research has been carried out thus far that achieves such integration. This section proposes two categories of geo-social integrations in terms of decision-making: the first one discusses an integrative approach toward spatial and social network factors to support a decision-making process; the second one discusses how social network structures impact GIS-based MCDM.
inter-actions among individuals to the size, scale, and shape of social phenomena observed in a spatiotemporal framework [26]. For example, urban sprawl that used to be understood through deterministic methods within economic location theory [7] has more recently been considered as a problem of organized complexity [97]. Network science has been proposed to study both urban physical networks (e.g., transport systems, water delivery) and urban social networks (e.g., industrial ecosystem) to build theories of how cities function as com-plex systems [17,25–27]. We argue here that, while the application of network science has achieved important insights, a problem such as urban sprawl (or any other phenomenon that is both place-based and the product of complex societal factors) can be most fully understood through conceptual approaches that integrate geographical with social context and methods that integrate spatial with network analysis. As noted elsewhere in this paper, the complexity of such problems is what visual analytics methods are designed to address. The two most typical network phenomena: small-world networks (characterized by high local clustering and short average node-to-node distance) [194] and scale-free net-works (in which, as noted above, a small number of nodes have a high degree distribution and a large number of nodes have a small degree distribution) [6], have shown a strong relationship with space and time. For example, the famous small world experiments to study the average path length for social networks of people observed these relationships at two geographical levels: U.S. [144] and world [193]. Additionally, small-world and scale-free properties have been demonstrated to exist in many spatial-social networks (i.e., World Wide Web graph, power grid graph, and road networks) [5,22,82,124,194,202]. Even many traditional spatial phenomena exhibit scale-free characteristics such as city and company growth [25,170]. Finally, as discussed in the data exploration section, the existence of scale-free characteristics has been extended from social relationships into spatial and temporal dimensions through analyzing mobile phone and GPS data.
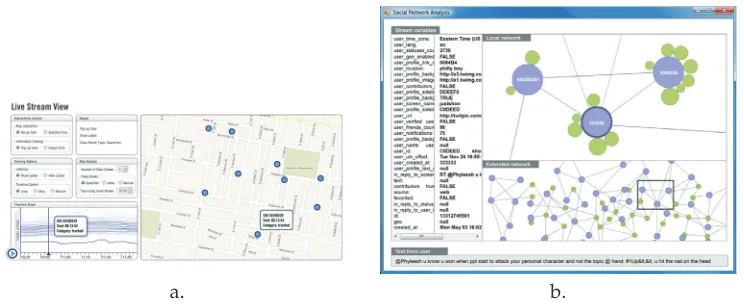
Geo-social visual analytic tools have the potential to directly enable decision-making that incorporates understanding of both geographic and social factors in an integrated way. One prototype of how such tools might work, TwitterHitter, was introduced by White and Roth [196]. The objective of TwitterHitter is to harvest information from Twitter.com to support the functions of crime analysis; these functions include decisions related to on-going investigations as well as those related to deployment of personnel. TwitterHitter provides functions to plot a linked map-timeline view of the recent spatiotemporal activi-ties of suspects on Twitter, and also can generate a directed network graph of the suspect’s known associates (i.e., Twitter friends) (Figure 6). Some other spatial data analysis methods can also be used, such as geographically weighted regression [74], to understand the etiol-ogy (scientific analysis of the causes) of the criminal activity, with the collected tweets or their attributes as potential explanatory variables in the analysis. In complementary work focused on decisions related to disease outbreaks, Guo [85] proposes a geo-social visual analytic approach to analyze large spatial human interaction data to support effective pan-demic control measures. The approach includes two linked views: a reorderable matrix and a map view to enable pattern interpretation in a geographical context and social con-text simultaneously. The geo-social interaction patterns provide valuable insight toward identifying critical locations and regions to suggest hypothetical control strategies for a pandemic outbreak based on synthetic population data.
a. b.
Figure 6: Individual linked map-timeline and social network analysis views in TwitterHit-ter. The left view allows analysts to retrieve a spatiotemporal record of a suspect’s activity on twitter. The right view can uncover all potential connections among suspects through network group of twitterers within a region. The views are courtesy of Jeremy D. White from Figures 3 and 4 in [196].
factors relevant to spatial clusters of crime include, but may not be limited by alcohol outlet densities [81], single person households [42], and depression [158]. Social network analysis in crime analysis has many important implications for crime investigations, such as target-ing criminal leaders [201] and fighting organized crime proactively [141]. Decision-making in terms of disease control should not only require the observation of corresponding spa-tial patterns and driving factors behind these patterns [190], but also needs the networks through which diseases are transmitted from person to person [32]. Epidemic models, based on human interaction networks, can be used to simulate disease transmission pro-cesses and test the effectiveness of proposed control strategies [104]. Recent research imple-ments human cognitive behaviors into epidemic models to consider human preventive be-haviors, which results in a very good agreement with the observed influenza data [137,162]. Similarly, decision-making related to evacuation (e.g., in response to a hurricane threat) re-quires both spatial analysis related to location of people, evacuation routes, etc. as well as an understanding of how social connections impact individual evacuation decisions and behaviors [8].
for their decision abilities [34]. However, GIS-MCDM has not taken the impact of social relationships on actors’ decision making into account.
The potential importance of social relationships for GIS-MCDM is illustrated in work by Bodin and Crona [34]. They review the role of social networks in terms of different rela-tional patterns on governance process and outcomes: 1) high network density can facilitate collective action, reduce conflicts, and enhance knowledge development; 2) low degree of cohesiveness (i.e., clearly distinguishable subgroups) has negative effects on collaborative processes among subgroups [83]; 3) bonding ties among subgroups is beneficial for conflict resolution and collective action; 4) high degree of network centralization is positively cor-related with collective action [163]. Furthermore, Bodin and Crona’s research shows that none of the above network characteristics has a monotonically increasing positive effect on collective actions and conflict reduction, and that increasing one characteristic may cause the reduction of another. Therefore, how to maximize the positive effects of the individual and mix level of different network characteristics presents a key research challenge in terms of group decision-making.
The integration of visualization techniques into GIS-MCDM has received increasing at-tention [12,98], but most studies focus on individual decision makers rather than groups [135]. Consequently, the collaborative tasks in GIS-MCDM with visualization/visual ana-lytics have not been explored, not to mention considering the impact of social networks on decision-making. Here, we highlight a geo-social visual analytics tool developed to ana-lyze public decision-making processes, and discuss the possibility to extend this tool into MCDM domains in order to consider the impact of social network structures.
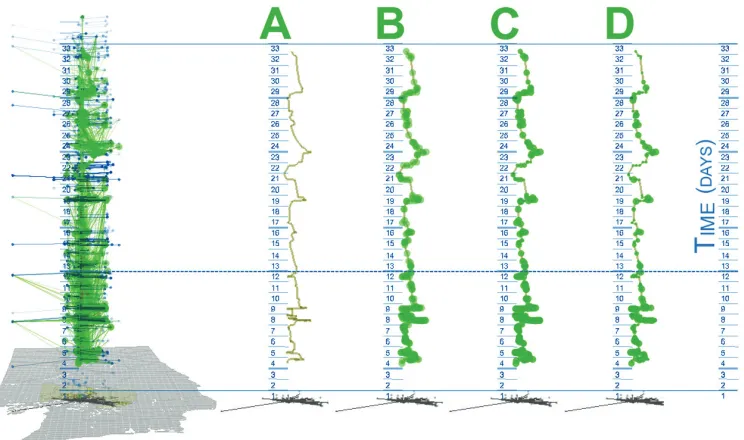
Aguirre and Nyerges [3] introduce a novel geo-social visual analytics method that they label “grapevine” (Figure 7) that is directed to analysis of the very complex geo-social infor-mation generated within applications of web-based public participation systems for partic-ipatory learning and decision-making. The authors applied the grapevine tool to analysis of data collected during a month-long, online and asynchronous citizen advisory activity focused on planning for transportation in Puget Sound. The analysis enabled by the tool allowed Aguirre and Nyerges to partially confirm a hypothesis about analytic–deliberative decision-making, “that decisions are better when they come from a combination of analysis and deliberation rather than from analysis alone” [3, p. 320]. But, it also allowed them to identify key challenges in supporting deliberative processes that attempt to engage a wide cross-section of the public in deliberation that includes technical information and complex problems.
alterna-tives for MCDM to allow decision-makers to choose and negotiate to support collaborative tasks. Last, agent-based modeling, a collection of agents that assess their situations and make decisions based on certain rules [37], can be used to simulate the group decision-making process.
Figure 7: The static display of the grapevine. A main stem grows up with the increasing number of messages over geographical space. The main stem generates nodes when the number of votes to messages increases. The nodes generate buds when the number of replies (thus social connections) to messages increases. It shows the main stem in four states: (A) all features are turned off; (B) nodes are turned on; (C) the number of nodes is according to the number of votes; (D) the size of buds is according to the number of replies. Reproduced from Figure 4 in [3].
This section presents an argument that there are two categories of geo-social integra-tions in terms of decision-making: a decision-making process considering spatial and so-cial network factors, and the impact of soso-cial network structures on GIS-based MCDM. The decision-making process is an iterative process that requires the support of a visual-interactive environment, especially in time-pressured situations [176]. One common prob-lem with current geo-social visual analytic tools in terms of decision-making is that they are focused on helping analysts understand the current situations from the first two steps of SA, but lack the power to support decisions relevant to the current SA or predictions for future situations.
3.3
Predictive analysis
not independent from the first two steps of the SA model: it requires the understanding of the past and current situations through data exploration. An internal conceptualization of a situation, aided by predictive models and human reasoning, is the key to predictive analysis.
Developing mathematical models to support predictive analysis starts with the under-standing of patterns found in real-world data. For example, based on the common prop-erty: scale-free characteristics observed in many large networks (e.g., actor collaboration graph, World Wide Web graph), Barab´asi and Albert [22] build a preferential attachment model to explain the development of scale-free networks in which networks tend to con-tinue to grow with new vertices, and new vertices have a preferential attachment to vertices that are already well connected. The preferential attachment model has been used to make predictions of network growth with scale-free characteristics, but this model does not con-sider the impact of geographical constraints on the network growth. As discussed in the data exploration section, scale-free characteristics have been extended into spatial and tem-poral dimensions in terms of human mobility. Lee et al. [121] develop a new mobility model called SLAW (self-similar least action walk) that can capture all human mobility features reviewed in the data exploration section, including the L´evy flight travel patterns [39], spa-tial heterogeneously bounded mobility [78], power-law inter-contact times (ICTs) [44,102], and fractal waypoints [155]. However, none of those mathematical models in terms of geo-social relationships have been implemented into geo-geo-social visual analytics to empower prediction.
Recent studies have shown that mathematical models have a better prediction per-formance when they consider multiple components of context information (i.e., spatial, network, societal in Figure 1) rather than just one. For example, Andris, Halverson, and Hardisty [15] develop a new model considering physical and social space for predicting future migration, and for U.S. migration flows among major cities; the model outperforms a gravity model considering physical space alone. In complementary work, Takhteyev et al. [173] find that pre-existing ties (i.e., frequency of air travel) between places and people is the best predictor of Twitter ties compared to three other spatial and social factors includ-ing geographic distance, national boundaries, and language. A related study shows that using place-based attributes (i.e., social, economic, and ecological context) can successfully predict community membership more than 70% of the time in a large-scale social network of cell phone towers [43].
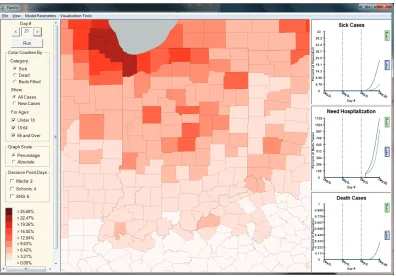
allows the user to set a variety of parameters to simulate the human-to-human infectious disease spread across the world.
Figure 8: Here we illustrate the PanViz user interface. A user has simulated an outbreak originating in Chicago and has been exploring the spread of the infectious disease over space and time. This is day 21 of the simulation. The color of each county represents the percentage of the population that is ill. The plots on the right show the rate of spread (thus the rate of person-to-person connection), hospitalization, and death in user selected counties. Figure Courtesy of Ross Maciejewski from Figure 7 in [126]. For additional Infor-mation on the research it is derived from, see [132].
correspond well with a retrospective survey. A follow-up study identifies that the destina-tions in which people stayed had significant social bonds and the time that the displaced population stays outside the city follows a skewed, fat-tailed distribution [126]. Bengtsson and colleagues have taken the first step to demonstrate that the prediction of population movements with the use of phone data in disaster response is possible, but substantial future work is still required before common usage. For example, cell phone data availabil-ity during natural disasters is still limited [28]; data coverage varies over space, time, and different groups of people [77]; and data privacy is always a big concern [117].
Above all, the process of predictive analysis is an iterative process that needs human interpretation, control, experiences, and imagination, especially in crisis periods. As dis-cussed here, current geo-social visual analytic tools in terms of decision-making are good at enabling perception of elements in and comprehension of the current situations, thus the first two steps of SA, but they lack the power to make predictions for future situations. Meanwhile, there is a gap between the insight gained in the process of data exploration and predictive analysis. For example, the current predictive epidemic visual analytic tools implement epidemic models to simulate disease transmission and design corresponding control strategies without flexible approaches analyzing human spatial-social interactive clusters (like those illustrated by Guo [85] in Section 3.2.2.1), as knowledge input to im-prove control strategy design.
4
Discussion and challenges
Geo-social data do not make any sense when abstracted from their appropriate contexts [1]. Geo-social contexts do not only demonstrate conceptual and observed overlaps, but also shed light on data from different perspectives. Downs and DeSouza [59] argue that spa-tial thinking serves three purposes: 1) a descriptive function, 2) an analytic function, and 3) an inferential function. We follow Downs and DeSouza’s lead and propose extending consideration of spatial thinking into spatial-social thinking. Social thinking describes how human interactions impact their ideas, emotions, and behaviors [198]. A social network ap-proach provides a means to describe human interactions and analyze and infer how such interactions impact the social thinking process. We propose that the three purposes that spatial thinking serves can be applied to social thinking to develop integrative spatial-social thinking for people to acquire knowledge. The three purposes also match the primary goal of visual analytics: interactive visual interfaces should support human analytical reasoning in an efficient and effective way. Supporting spatial and social thinking to address the three purposes outlined is a prototypical example of meeting this goal.
Based on the above discussion, multiple geo-social visual analytics research questions need to be addressed in relation to data exploration, decision-making, and predictive analy-sis. In addition, data exploration, decision-making, and predictive analysis have inner con-nections: knowledge development in the data exploration process can support decision-making and predictive analysis, which sometimes leads decision-decision-making and predicative analysis to develop a new knowledge construction process. Therefore, the overarching goal of visual analytics is to involve human ability with the whole complex analytical process rather than each step separately [9].
nine core challenges that will require interdisciplinary efforts to meet. The challenges can be classified into two categories: the first one focuses on further integration of spatial and social network analytics from an interdisciplinary perspective, and the second one focuses on understanding the impact of geo-social relationships on society.
4.1
An effective integration of spatial and social network analytics
Understanding the interaction of geography, network, and societal space, as well as their respective and coupled impacts on outcomes of interest.This challenge underlies the entire paper. Based on our review it seems clear that understanding how spatial proximity and network re-lationships interact for outcomes of interest is at an early stage [173,188]. Thus, further research is required to investigate how geographical and social relationships operate ex-plicitly in different geo-social systems. In addition to spatial analysis and social network analysis, multivariate analyses methods, that conceptually fit the societal context in Fig-ure 1, can be implemented into geovisual analytics tools to understand the relationships between variables and their relevance to the spatial-social patterns being studied. This pa-per primarily focuses on the spatial-social relationships and methods to understand them; complementary research on multivariate analysis and geovisualization can be found in the following papers [46–48,84,87,88].
Developing theory, methods, and tools to consider spatial and network factors simultaneously.Most geo-social analytical approaches use independent traditional spatial analysis and social network analysis methods simultaneously to explore the same datasets [63]. It is necessary to develop new theory and methods that integrate spatial and social factors together. For example, Radil et al. [151] propose a new method that borrows the concept of social posi-tion to explore an actor’s posiposi-tion in a spatial contiguity matrix simultaneously with his or her position in social networks. The proposed method can identify statistically significant violence patterns which cannot be captured by the classical spatial autocorrelation method, Global Moran’s I [146,178]. Radil and his colleagues’ work is only one attempt to explore new geo-social theory and methods. As discussed in this paper, spatial analysis and social network analysis exhibit strong conceptual and observed overlaps, so much more future work is needed.
Twitter) at a city-to-city scale [183]. The second model has fixed nodes with changing ge-ographical relationships and relatively fixed social relationships (i.e., human movement, mobile-based social media). The last model can support more complex geo-social dynamic behaviors in which networks can expand and recede [24]. Recent developments that apply the concept of “rendezvous” (bringing sensors close to one another in space or time [96] to shed light on human mobility characteristics [95]) provides data and methods to support the last two models.
Integrating distinct applications of cognitive science to support geo-social visual analytics. Cogni-tive science provides theoretical frameworks for the design of geovisualization tools [129], it provides a conceptual approach (e.g., distributed cognition) to understand human rea-soning as enabled by visual tools, and it also offers fundamental theories and approaches to understand and model human behaviors in network science, as discussed in the decision-making section. For example, the Organizational Risk Analyzer (ORA) uses both network theory and social psychology to model human behaviors, and ORA has been used to an-alyze 1500 videos made by insurgents in Iraq and effectively reduce sniper activity by 70% [35]. From a social cognitive perspective, human behaviors result from an interaction between human internal cognition and externally environmental effects [21]. The exter-nal effects also fit the three spaces in the proposed conceptual framework for geo-social relationships (Figure 1), because the external effects include human socioeconomic sta-tus (societal embeddedness), their relationships with others (network embeddedness), and materials provided by a specific location in which the personal is located (territorial em-beddedness). Involving social cognitive theory in modeling human behaviors may make contributions to predict geo-social systems in crisis situations discussed in the predictive analysis section. Therefore, cognitive science should not only be used to design visualiza-tion tools [71], but to support geo-social analytic models as well.
Developing new geo-social visual analytics methods to incorporate data exploration, decision-making, and predictive analysis as a whole. As discussed above, most geo-social visual analyt-ics methods only support one step, so visual analytanalyt-ics cannot effectively transform knowl-edge through visual exploration into complex analytical strategies directly. One possible solution is to improve inter-disciplinary cooperation through understanding the human an-alytical reasoning of real decision-makers to design visual analytic tools accordingly [10], such as has been attempted for maritime anomaly detection [156], bridge management sys-tem analysis [191], and other application domains. In addition, visual analytics have not synergistically integrated computational methods to maximize human conceptual, percep-tual and reasoning capabilities in the whole scientific and problem-solving process. One possible theoretical framework to link the whole complex analytical process can be found in Gahegan [75], situating human reasoning, concretized representation, conceptual struc-tures, visual representation, and mathematical models into the whole science process. To support a full range of applications of geo-social visual analytics, however, the approach must be generalized beyond the context of scientific research, which was the target of Ga-hegan’s model.
4.2
The impact of geo-social relationships on society
includes broad application domains (e.g., transportation, urban planning). Decision-making in terms of those domains involves interests among different stakeholders, but it also has a corresponding influence on the practices of everyday life. The influence will fur-ther impact local community interaction and network structures. For example, people who used to live inhutongs(traditional alleyway neighborhoods) in Beijing report a substantial disruption of the high quality and frequency of local interaction they had in hutong com-pared to that after they were relocated to mega-block high rise apartment complexes on the city periphery when their neighborhood underwent urban renewal [157]. Tita et al. [179] point to a similar impact of urban redevelopment on social networks in their argument that the clear north-south geographical division in the gang rivalry networks in a section of Los Angeles is due to a landscape feature: the San Bernadino Freeway. Although spatial deci-sion making has a significant role in shifting local community network structures, research in GIS-MCDM has not taken such shifts into account.
Understanding the shift of the traditional decision-making approaches with the emergence of social media.The emergence of social media (i.e., Facebook, Twitter, LinkedIn) changes the world via collective power through on-line social networks. One person can communicate with hundreds or even more people about products, news, cultures, and any information. The communication occurs in a smaller world than in the pre-internet era; this is illustrated by Kwak et al. [111] who find that the average path length of a Twitter network is 4.12 com-pared to “six degrees of separation” [144] in the real world. The impact of people-to-people communication has greatly changed the traditional sense of decision-making, because so-cial media based conversations help people to be accountable and occur outside of the direct control of decision-makers [136]. For example, social media is playing an increas-ing role in the most recent anti-government protests, includincreas-ing the Arab Sprincreas-ing, Occupy Wall Street, and the London Riots [184]. MacEachren et al. [131] leverage Twitter into a web-enabled geovisual analytics application and discuss how social media can offer strate-gies for disaster and emergency management. While social media have a transformative impact on traditional decision-making approaches, strategies through which responding organizations can successfully leverage these technologies are just beginning to be consid-ered [203]. Before effective use of social media in decision-making can be achieved, there are many unexplored research questions. For example, how does information diffuse geo-graphically and socially via social media? How do social media change human behaviors in normal and crisis situations? How do social media transform individual voices into collective power to be accountable?
social interaction networks. Nodes represent individuals and edges consider both friend-ships in Facebook and physical proximity in real world (i.e., the same dorm, the same class). However, the demographics of social media users is a biased sample of the whole population (in relation to age, gender, race, etc.) and such networks are still at a rather coarse resolution for the study of disease transmission. As more complete data sets be-come available, individual-level network data with spatial and temporal information may make it possible to predict human behaviors better, but collection of individual level data raises a range of privacy concerns [36].
To sum up, geo-social visual analytics is based on the conceptual extension of the First Law of Geography: everything/everyone is related to everything/everyone else, but near things/persons are more related than distant things/persons [180]; nearness and relation-ships can be considered a matter of geographical and social network distance, relationship and interaction. The observed social phenomena in a spatiotemporal framework moti-vate the development of social, political, and ethical research questions finally to develop th general geo-social theory to understand the world. Thus, at the methodological level, geo-social visual analytics should facilitate the integration of computational methods with human reasoning abilities to answer research and application questions in the context of data exploration, decision-making, and predictive analysis. The resulting methods will, from an integrative perspective of spatial thinking and social science, enable research to understand the geo-social mechanisms and processes that underlie human behavior.
Acknowledgments
This material is based, in part, upon work supported by the U.S. Department of Homeland Security under Award #: 2009-ST-061-CI0001. The views and conclusions contained in this document are those of the authors and should not be interpreted as necessarily represent-ing the official policies, either expressed or implied, of the U.S. Department of Homeland Security; a grant from the Gates Foundation also provided partial support. We thank Guo Diansheng and Ross Maciejewski for permission to include their previously unpublished figures illustrating their research. We thank Krista Kahler for redrawing the Figure 5.
References
[1] ABBOTT, A. Of time and space: The contemporary relevance of the Chicago School. Social Forces 75, 4 (1997), 1149–1182.doi:10.1093/sf/75.4.1149.
[2] ADAMS, J., FAUST, K., AND LOVASI, G. Capturing context: Integrat-ing spatial and social network analyses. Social networks 34, 1 (2012), 1–5.
doi:10.1016/j.socnet.2011.10.007.
[3] AGUIRRE, R., AND NYERGES, T. Geovisual evaluation of public participation in decision making: The grapevine.Journal of Visual Languages & Computing 22, 4 (2011), 305–321.doi:10.1016/j.jvlc.2010.12.004.
cluster-ing. InVisual Information Communication, M. L. Huang, Q. V. Nguyen, and K. Zhang, Eds. Springer, 2010, pp. 25–39.doi:10.1007/978-1-4419-0312-9 2.
[5] ALBERT, R., ALBERT, I., AND NAKARADO, G. Structural vulnerability of the North American power grid. Physical Review E 69, 2 (2004), 025103.
doi:10.1103/PhysRevE.69.025103.
[6] ALBERT, R., JEONG, H.,ANDBARABASI´ , A. Diameter of the world wide web.Nature 401, 6749 (1999), 130–131.doi:10.1038/43601.
[7] ALONSO, W. Location and land use. Toward a general theory of land rent. Harvard Uni-versity Press, Cambridge, MA, 1964.
[8] ALSNIH, R., AND STOPHER, P. Review of procedures associated with devising emergency evacuation plans. Transportation Research Record 1865, 1 (2004), 89–97.
doi:10.3141/1865-13.
[9] ANDRIENKO, G., ANDRIENKO, N., JANKOWSKI, P., KEIM, D., KRAAK, M., MACEACHREN, A.,AND WROBEL, S. Geovisual analytics for spatial decision sup-port: Setting the research agenda. International Journal of Geographical Information Sci-ence 21, 8 (2007), 839–858.doi:10.1080/13658810701349011.
[10] ANDRIENKO, G., ANDRIENKO, N., KEIM, D., MACEACHREN, A.,ANDWROBEL, S. Challenging problems of geospatial visual analytics (editorial introduction). Journal of Visual Languages & Computing 22, 4 (2011), 251–256.doi:10.1016/j.jvlc.2011.04.001. [11] ANDRIENKO, G., ANDRIENKO, N., KOPANAKIS, I., LIGTENBERG, A.,ANDWROBEL,
S. Visual analytics methods for movement data. InMobility, Data Mining and Privacy: Geographic Knowledge Discovery, F. Giannoni and D. Pedreski, Eds. Springer, Berlin, 2008, ch. 13, pp. 375–410.doi:10.1007/978-3-540-75177-9 14.
[12] ANDRIENKO, N., AND ANDRIENKO, G. Informed spatial decisions
through coordinated views. Information Visualization 2, 4 (2003), 270–285.
doi:10.1057/palgrave.ivs.9500058.
[13] ANDRIENKO, N., AND ANDRIENKO, G. Spatial generalisation and aggregation of massive movement data.IEEE Transactions on Visualization and Computer Graphics 17, 2 (2010), 205–219.doi:10.1109/TVCG.2010.44.
[14] ANDRIS, C.Metrics and methods for social distance. PhD thesis, Massachusetts Institute of Technology, 2011.
[15] ANDRIS, C., HALVERSON, S., AND HARDISTY, F. Predicting migration system
dy-namics with conditional and posterior probabilities. InProc. IEEE International Confer-ence on Spatial Data Mining and Geographical Knowledge Services (ICSDM)(2011), IEEE, pp. 192–197.doi:10.1109/ICSDM.2011.5969030.
[16] ASHDOWN, P. The global power shift. TED, 2005. http:www.ted.com/playlists/ 73/the global power shift.html.
[18] BAILEY, T.,ANDGATRELL, A. Interactive spatial data analysis. Longman Scientific & Technical, Essex, UK, 1995.
[19] BAK, P., OMER, I.,ANDSCHRECK, T. Visual analytics of urban environments using high-resolution geographic data. InGeospatial Thinking, M. Painho, M. Y. Santos, and H. Pundt, Eds., Lecture Notes in Geoinformation and Cartography. Springer, Berlin, 2010, pp. 25–42.doi:10.1007/978-3-642-12326-9 2.
[20] BALCAN, D., COLIZZA, V., GONC¸ALVES, B., HU, H., RAMASCO, J.,AND VESPIG
-NANI, A. Multiscale mobility networks and the spatial spreading of infectious dis-eases. Proceedings of the National Academy of Sciences 106, 51 (2009), 21484–21491.
doi:10.1073/pnas.0906910106.
[21] BANDURA, A. Social cognitive theory: An agentic perspective. Annual Review of Psychology 52, 1 (2001), 1–26.doi:10.1111/1467-839X.00024.
[22] BARABASI´ , A. Linked: How everything is connected to everything else and what it means. Perseus, Cambridge, MA, 2002.
[23] BARABASI´ , A. Scale-free networks: A decade and beyond. Science 325, 5939 (2009), 412–413.doi:10.1126/science.1173299.
[24] BATTY, M. Network geography: Relations, interactions, scaling and spatial processes in GIS. InRe-presenting GIS(2005), pp. 149–170.
[25] BATTY, M. Rank clocks.Nature 444, 7119 (2006), 592–596.doi:10.1038/nature05302. [26] BATTY, M. The size, scale, and shape of cities. Science 319, 5864 (2008), 769–771.
doi:10.1126/science.1151419.
[27] BAYNES, T. Complexity in urban development and management. Journal of Industrial Ecology 13, 2 (2009), 214–227.
[28] BENGTSSON, L., LU, X., THORSON, A., GARFIELD, R.,AND VON SCHREEB, J. Im-proved response to disasters and outbreaks by tracking population movements with mobile phone network data: A post-earthquake geospatial study in Haiti. PLoS Medicine 8, 8 (2011), e1001083.doi:10.1371/journal.pmed.1001083.
[29] BERA, R., AND CLARAMUNT, C. Topology-based proximities in spatial systems. Journal of Geographical Systems 5, 4 (2003), 353–379.doi:10.1007/s10109-003-0115-y. [30] BETTENCOURT, L., LOBO, J., HELBING, D., K ¨UHNERT, C.,ANDWEST, G. Growth,
innovation, scaling, and the pace of life in cities. Proceedings of the National Academy of Sciences 104, 17 (2007), 7301–7306.doi:10.1073/pnas.0610172104.
[31] BETTENCOURT, L.,ANDWEST, G. A unified theory of urban living.Nature 467, 7318 (2010), 912–913.doi:10.1038/467912a.
[32] BIAN, L.,ANDLIEBNER, D. A network model for dispersion of communicable
dis-eases. Transactions in GIS 11, 2 (2007), 155–173.doi:10.1111/j.1467-9671.2007.01039.x. [33] BISSET, K.,ANDMARATHE, M. A cyber environment to support pandemic planning
[34] BODIN, ¨O.,AND CRONA, B. The role of social networks in natural resource gover-nance: What relational patterns make a difference? Global Environmental Change 19, 3 (2009), 366–374.doi:10.1016/j.gloenvcha.2009.05.002.
[35] BOHANNON, J. Counterterrorism’s new tool: “Metanetwork” analysis. Science 325, 5939 (2009), 409–411. doi:10.1126/science.325 409.
[36] BOHANNON, J. Investigating networks: The dark side. Science 325, 5939 (2009), 410– 411. doi:10.1126/science.325 410.
[37] BONABEAU, E. Agent-based modeling: Methods and techniques for simulating hu-man systems. Proceedings of the National Academy of Sciences 99, Suppl 3 (2002), 7280– 7287.doi:10.1073/pnas.082080899.
[38] BRIGANTIC, R., EBERT, D., CORLEY, C., MACIEJEWSKI, R., MULLER, G.,ANDTAY
-LOR, A. Development of a quick look pandemic influenza modeling and visualiza-tion tool. InProc. 7th International ISCRAM Conference(Seattle, USA, 2010).
[39] BROCKMANN, D., HUFNAGEL, L.,ANDGEISEL, T. The scaling laws of human travel. Nature 439, 7075 (2006), 462–465.doi:10.1038/nature04292.
[40] BROECK, W., GIOANNINI, C., GONC¸ALVES, B., QUAGGIOTTO, M., COLIZZA, V.,
ANDVESPIGNANI, A. The GLEaMviz computational tool, a publicly available soft-ware to explore realistic epidemic spreading scenarios at the global scale.BMC Infec-tious Diseases 11, 1 (2011), 37.doi:10.1186/1471-2334-11-37.
[41] BUCHANAN, M. Nexus: Small worlds and the groundbreaking theory of networks. W.W. Norton, New York, 2003.
[42] CAHILL, M., AND MULLIGAN, G. Using geographically weighted regression to explore local crime patterns. Social Science Computer Review 25, 2 (2007), 174–193.
doi:10.1177/0894439307298925.
[43] CAUGHLIN, T., RUKTANONCHAI, N., ACEVEDO, M., LOPIANO, K., PROSPER, O., EAGLE, N., AND TATEM, A. Place-based attributes predict community member-ship in a mobile phone communication network. PLoS ONE 8, 2 (2013), e56057.
doi:10.1371/journal.pone.0056057.
[44] CHAINTREAU, A., HUI, P., CROWCROFT, J., DIOT, C., GASS, R., AND SCOTT, J. Impact of human mobility on opportunistic forwarding algorithms.IEEE Transactions on Mobile Computing(2007), 606–620.
[45] CHANG, R., ZIEMKIEWICZ, C., GREEN, T., AND RIBARSKY, W. Defining insight
for visual analytics. IEEE Computer Graphics and Applications 29, 2 (2009), 14–17.
doi:10.1109/MCG.2009.22.
[46] CHEN, J., CARR, D., WECHSLER, H.,ANDPAN, Z. Interactive visualization of mul-tivariate statistical data. The International Journal of Virtual Reality 5, 3 (2006), 67–73.
[47] CHEN, J., AND MACEACHREN, A. Resolution control for balancing overview and detail in multivariate spatial analysis. Cartographic Journal 45, 4 (2008), 261–273.
[48] CHEN, J., MACEACHREN, A., AND GUO, D. Supporting the process of ex-ploring and interpreting space–time multivariate patterns: The visual inquiry toolkit. Cartography and Geographic Information Science 35, 1 (2008), 33–50.
doi:10.1559/152304008783475689.
[49] CHEN, J., SHAW, S., YU, H., LU, F., CHAI, Y.,ANDJIA, Q. Exploratory data analysis of activity diary data: A space-time GIS approach. Journal of Transport Geography 19, 3 (2011), 394–404.doi:10.1016/j.jtrangeo.2010.11.002.
[50] CHO, E., MYERS, S., AND LESKOVEC, J. Friendship and mobility: User move-ment in location-based social networks. In Proc. 17th ACM SIGKDD International Conference on Knowledge Discovery and Data Mining (2011), ACM, pp. 1082–1090.
doi:10.1145/2020408.2020579.
[51] CHRISTAKIS, N.,ANDFOWLER, J.Connected: The surprising power of our social networks and how they shape our lives. Little, Brown and Company, 2009.
[52] CLIFF, A., AND HAGGETT, P. On complex geographic space: Computing frame-works for spatial diffusion processes. InGeocomputation: A primer, P. Longley, S. M. Brooks, R. McDonnell, and B. Macmillan, Eds. John Wiley and Sons, New York, 1998, pp. 231–256.
[53] CRANDALL, D., BACKSTROM, L., COSLEY, D., SURI, S., HUTTENLOCHER, D., AND KLEINBERG, J. Inferring social ties from geographic coincidences. Proceedings of the National Academy of Sciences 107, 52 (2010), 22436–22441.
doi:10.1073/pnas.1006155107.
[54] CURTIN, K. Network analysis in geographic information science: Review, assess-ment, and projections. Cartography and Geographic Information Science 34, 2 (2007), 103–111.doi:10.1559/152304007781002163.
[55] DARAGANOVA, G., PATTISON, P., KOSKINEN, J., MITCHELL, B., BILL, A., WATTS, M.,ANDBAUM, S. Networks and geography: Modelling community network struc-tures as the outcome of both spatial and network processes. Social networks 34, 1 (2012), 6–17.doi:10.1016/j.socnet.2010.12.001.
[56] DEMSARˇ , U., ˇSPATENKOVA´, O., AND VIRRANTAUS, K. Identifying critical
loca-tions in a spatial network with graph theory. Transactions in GIS 12, 1 (2008), 61–82.
doi:10.1111/j.1467-9671.2008.01086.x.
[57] DEMSARˇ , U.,AND VIRRANTAUS, K. Space–time density of trajectories: exploring spatio-temporal patterns in movement data. International Journal of Geographical In-formation Science 24, 10 (2010), 1527–1542.doi:10.1080/13658816.2010.511223.
[58] DOREIAN, P., AND CONTI, N. Social context, spatial structure and social network structure.Social networks 34, 1 (2012), 32–46.doi:10.1016/j.socnet.2010.09.002. [59] DOWNS, R., AND DESOUZA, A. Learning to think spatially: GIS as a support system
![Figure 1: Proposed conceptual framework for geo-social relationships based on fundamen-tal categories of embeddedness [92]](https://thumb-us.123doks.com/thumbv2/123dok_us/1157423.1617827/5.612.194.454.118.351/figure-proposed-conceptual-framework-relationships-fundamen-categories-embeddedness.webp)
![Figure 2: Feature-ID model of geovisualization; elaboration of ideas first presented in Fig-ure 8.1 in [128]](https://thumb-us.123doks.com/thumbv2/123dok_us/1157423.1617827/8.612.111.493.115.336/figure-feature-model-geovisualization-elaboration-ideas-rst-presented.webp)
![Figure 3: (a) State to state migration from 1995 to 2000. Adapted from Figure 7 in [181]with Flow Mapper program from CSISS.org](https://thumb-us.123doks.com/thumbv2/123dok_us/1157423.1617827/10.612.117.488.92.258/figure-state-migration-adapted-figure-mapper-program-csiss.webp)