Intelligent Pattern Mining and Data
Clustering for Pattern Cluster Analysis using
Cancer Data
G.Raj Kumar
Assistant Professor ,Department Of ECE , SASTRA University , Thanjavur ,
Dr.K.Duraiswamy
Dean , Department Of CSE, KSR College Of Technology ,Tiruchengode
M.Thangamani
Assistant Professor in CSE Kongu Engineering College , Erode .
Dr.P.Thangaraj,
Professor & Head , Department of CSE Bannari Amman Institute Of Technology,
Sathyamangalam. Abstract
Data mining techniques are used for the knowledge discovery process under the large data set environment. Clustering techniques are used to group up the relevant data sets. Hierarchical and partitioned clustering techniques are used for the clustering process. The clustering process is the complex task with high process time. The pattern extraction scheme is applied to find frequent item sets. Association rule mining techniques are applied to carry out the pattern extraction process. The pattern extraction scheme and the clustering scheme are integrated in the simultaneous pattern extraction and clustering scheme. The clustering process is improved with pattern comparison and transaction transfer process. The simultaneous clustering scheme is implemented to analyze the cancer patient diagnosis reports. The system is implemented as four major modules data set management, pattern extraction, clustering process and performance analysis. The data sets are preprocessed before the pattern extraction process. The patterns are used in the simultaneous clustering process. The performance analysis is done with the comparison of the data clustering scheme and pattern clustering schemes. The process time and memory factors are used in the performance analysis process. The cluster accuracy is represented using the fitness values. The system is enhanced with the K-means clustering algorithm
Keywords: Datamining, document clustering, pattern cluster, pattern discovery, data cluster. 1.Introduction
The clustering techniques are used to group up the transactional data based on the similarity values. The pattern extraction methods are used to find out similar patterns in the transactional data sets. The system integrates the pattern extraction scheme with clustering method to improve the clustering process. The simultaneous clustering scheme uses the pattern and the transactional data for the clustering process. The partitioned clustering technique is enhanced in the system. The association rule mining technique and clustering technique are integrated in the simultaneous clustering process. The system is designed with the following objectives.
To maintain the patient diagnosis reports for the breast cancer patients
To correct the noisy records using the data preprocessing techniques
To apply the query based techniques to remove the redundant records
To use the aggregation based method to correct incomplete records
To use a priori algorithm to extract association rules
To perform data clustering using the transactional data sets
To prepare pattern clusters using the patterns
To carry out simultaneous clustering using the patterns and transactional data
To find the fitness values for cluster accuracy measurement process
To conduct a study to find out the performance of the clustering algorithms
The simultaneous pattern extraction and clustering system is designed to perform the pattern extraction and clustering process in an integrated manner. The system reduces the process time for clustering process. Generally the data clustering and pattern extraction operations carried out separately. This system integrates the pattern extraction and clustering tasks to reduce the process time and improve the clustering accuracy. The breast cancer data sets are used in the system. The symptoms and their severity levels are maintained in the database. The symptom and their indication values are maintained as quantitative values. The system uses the association rule mining techniques and clustering techniques for the mining process. The pattern extraction is done using the association rule mining techniques. The frequent items are extracted using the priory algorithm. The patterns are extracted from the frequent items. The clustering algorithm is used to group up the transaction data based on similarity value. The system performs three type of clustering tasks. They are data clustering, pattern clustering and simultaneous clustering operations8. The data clustering tasks group the transaction data in the actual data set. The pattern clustering tasks is applied on the extracted patterns. The K-means clustering algorithm is used for the data clustering and pattern clustering process.
The simultaneous clustering mechanism uses the patterns and actual transactional data. The K-means clustering algorithm is modified to perform the simultaneous clustering process. The K-means clustering algorithm uses the same data values for the similarity computation and cluster assignment process. The modified K-means clustering algorithm uses the pattern information for the distance measure process and uses the associated transactional data for cluster assignment process. In this case minimum patterns are used for the comparison process but a set of transactional data are assigned into the corresponding cluster. The system also performs a preprocessing task to clean the data set from noisy records. The simultaneous clustering process uses more memory than data clustering technique. The process time is very low. The clustering accuracy is very high. The simultaneous pattern extraction and clustering technique is developed to improve the performance of the clustering system. The system uses the breast cancer patient diagnosis report for the clustering process. The pattern extraction and clustering process are integrated in the system.
2. Motivation
The major contributions of this work are summarized as follows:
1. A simultaneous pattern and data clustering method is proposed. It is able to cluster not only patterns but also their associated data while making the relation between patterns and data explicit.
2. Since the effectiveness of a pattern-clustering algorithm is highly dependent on the distance measures between patterns and their associated data, in this work, several distance measures are proposed, and their relations to existing common measures are studied. The key component of the proposed approach is the simultaneous pattern and data clustering. If it is able to cluster patterns and the associated data effectively in the divide phase, the subsequent analysis of individual clusters in the conquer phase will become simpler and more effective and can be conducted using existing well-studied techniques.
3.Related Work
Data mining, the extraction of hidden predictive information from large databases, is a powerful new technology with great potential to help companies focus on the most important information in their data warehouses1. Data mining tools predict future trends and behaviors, allowing businesses to make proactive, knowledge-driven decisions. Data warehousing represents an ideal vision of maintaining a central repository of all organizational data. Centralization of data is needed to maximize user access and analysis 2,10.
Association rule mining for multiple database management Systems have continually evolved from primitive file systems to sophisticated and powerful relational and object oriented models5. Present day systems implement various constructs in the form of query optimizing modules, event-condition action rules to trigger events of interest and other mechanisms that have made their use imperative in most applications. Clustering is the process of grouping the data into clusters with high intra-cluster similarity and low inter-cluster similarity6,7,8. There are several clustering techniques: partitioning methods, hierarchical methods, density-based methods, grid-based methods, and model based methods. The basic difference between classification and clustering is that classification is a supervised learning method, which assumes predefined class labels, while clustering is an unsupervised learning method that does not assume any knowledge of classes.
The effectiveness of clustering mainly depends on the distance measure, several distance measures between patterns and their associated data are proposed. Once pattern clusters and their associated data clusters are obtained, each of them can be further analyzed individually8. This paper presents a knowledge exploratory method using multiple pattern associations to conjecture structural and functional characteristics of bimolecular10. To uncover qualitative and quantitative patterns in a data set is a challenging task for research in the area of machine learning and data analysis. Due to the complexity of real-world data, high-order patterns or event associations, in addition to first-order class-dependent relationships, have to be acquired 13. An attribute clustering method which is able to group genes based on their interdependence so as to mine meaningful patterns from the gene expression data. a small pool of selected genes can be used to build classifiers with very high classification rate. From the pool, gene expressions of different categories can be identified 12.
4.Problem Description
4.1 Pattern Discovery Concepts
Today, a primary challenge in data mining and knowledge discovery is to discover interesting relationships from data sets. The basic idea of PD can be illustrated by a simple XOR problem with three binary variables: A, B and C for C = A * B. Suppose that the user want to check whether or not the occurrence of a compound event |A = T,B = T;C = F) is just a random happening. Given the observed frequency of occurrences o of the compound event, if the system could estimate its expected frequency of occurrences e under the random assumption, the system knows whether it is random or not by checking the difference (o – e). Such a notion is formulated as a hypothesis test. A compound event is called an event association pattern or simply a pattern if the difference (o – e) is significant enough to indicate that the compound event is not a random happening.
PD is a useful tool for categorical data analysis. First, the patterns produced are easy to understand for those who are not data mining experts. Hence, it is widely used in business and commercial applications. Second, it assumes very little knowledge about the data from the users. Thus, when the users do not have any a priori knowledge about a data set, PD is a good starting point for exploring the data set. Third, correlation relationship often reveals useful information hidden in the data. Finally, the discovered patterns provide an alternative perspective for further analysis of the data.
4.2 Pattern Analysis
Using the discovered patterns, the user can conduct inference such as classification. The classifiers built from association patterns are known as associative classifiers, which may be easier to understand than conventional classifiers. In addition, there is no systematic and objective way of combining fragments of information from individual patterns to produce a more generalized form of information. Since there are too many patterns, it is difficult to use them to further explore or analyze the data. Hence, the problem of too many patterns limits the usefulness of PD.
4.3 Simultaneous Clustering Process
A new method is proposed that simultaneously clusters the discovered patterns and their associated data. It is referred to as simultaneous pattern and data clustering or simply pattern clustering. One important property of the proposed method is that each pattern cluster is explicitly associated with a corresponding data cluster.
can be further explored and analyzed individually. Since each pattern cluster is associated with a data cluster, the users can further analyze each pattern cluster via its associated data cluster by using existing well-studied techniques such as COBWEB and other discrete-valued data analysis methods interpret why a data cluster is formed via its associated pattern cluster.
5 Materials and Methods
Simultaneous pattern and Data Clustering:
Pattern-Induced Data Clusters
A simultaneous pattern and data clustering method is presented. To begin with, the notion of pattern induced data clusters is introduced. It relates patterns to the set of compound events containing them and makes the relation between patterns and their associated data explicit.
Figure:1 Pattern-Induced Data Clusters common samples.
It can be used as a natural threshold for stopping a clustering algorithm. It is not possible cluster two rules / patterns together if dR > 1, since there is more dissimilarity than similarity between the two patterns. It has been reported that distance / similarity measures based on matched samples such as dT and dG work fairly well for clustering similar patterns, because they go back to the samples where the patterns / rules share or differ. However, these measures do not give special consideration to the attributes where the patterns share or differ. As an illustration, consider the two pairs of patterns i sj
j s i
x
x
,
& ri, rj and rij bear the same meaning. Ci (Cj) is the number of attributes matched by i
sjj s
i
x
x
,
but not by j
si i sj
x
x
,
. That is, ci = |si \ sj|, and cj = |sj \ si|. Let cij be the number of attributes matched by both sii
x
and sj jx
. That is, cij = |si sj|. The system measures dT, dG, and dR will yield the same value for the two pairs of patterns, since ri = rp, rj = rq and rij = rpq. However, it seems more reasonable to consider that sii
x
and sj jx
are more similar, since they share certain attributes (cij>0). This motivates to introduce the notion of pattern induced data cluster I(i) in (6), which consider both the sets of matched samples and matched attributes. In Figure.1, the four highlighted rectangles are actually the induced data clusters I(i), I(j), I(p), and I(q). In addition, when two data clusters, say, I(i) and I(j) are merged, the compound events in the upper right and bottom left corner regions are added into the merged data cluster. The corner regions are defined byI (i/j) = {xs x | x m(i) / m(j), s = s
j/si} ---(6) I (j/i) = {xs x | x m(j) / m(i), s = s
i/sj} ---(7)
where Wr and Wc are the weights of the samples and the attributes, respectively. If wr + wc = 1, dRC > =1, again, can be used as a natural stopping criterion. The number of matched samples and matched attributes are equally
R (j)
R (p)
important. wr and wc are set to 0.5. One problem of the measure dRC is that it does not consider the variation within the data clusters. The measures, including dT , dG, dR, and dRC, discussed so far are designed to measure the distance among patterns.
This allows us to analyze pattern clusters via their associated data clusters by using standard analysis techniques. A simple technique is introduced for effectively analyzing individual data clusters. On the other hand, knowing which set of patterns induces which adata clusters allows users to use understandable patterns for interpreting and validating the data clusters. In view of this, it is desirable to simultaneously cluster patterns and data and keep their relations explicit. To obtain good data clusters the variations could be minimized.
A common measure of variation/uncertainty for discrete-valued data is entropy:
)
(
log
)
(
)
(
s I x sx
P
x
P
I
H
s
….(8)where P(xs) is the joint probability distribution of xs, and I is the abbreviation of I(1 . . . n).
However, the number of parameters in estimating P(xs) is exponential. For |s| binary variables, it is of order O(2|s|).Hence, it is impractical to estimate P(xs) directly due to the lack of data in most real-world problems. To reduce the number of parameters, this approach adopts a naive assumption that the attributes are conditionally independent, given a data cluster. The joint entropy is then estimated by summing up the entropy of individual attributes:
s
i x x x I
i i s s i
x
P
x
P
I
H
,)
(
log
)
(
)
(
--- (9)where s is the attribute index set of I. P(xi)is the probability of xi in I and is estimated by
I
o
x
P
xii
)
(
--- (10)where i x
o
is the observed frequency of xi in I, and |I| is the number of compound events in I.The computation complexity of H(I) in (9) is O(|I| |S|). Since |s| is usually much smaller than |I|, the complexity could be O(|I|), which is linear. All constant clusters have zero entropy. For example H(I(1)) = 0, and H(I(2)) = 0. When merging patterns x1{3,4,5,8} and x2{10,11,12,13}, the entropy of the merged data cluster increases indicating that the variation / uncertainty of the clusters increases due to the merging. Note that H(I) is bounded as 0 H(I) = is log mi, where mi is the number of possible values of the ith attribute. Hence, H(I) in (9) can be normalized:
s i im
I
H
I
H
log
)
(
--- (11)
Methods can be applied to analyze the data clusters without being heavily affected by noises and the unrelated data. Essentially, once patterns and data are clustered by pattern clustering in the divide phase, any data analysis techniques can be applied to the obtained data clusters in the conquer phase. A simple technique is proposed for discovering subgroups in a data cluster.
To measure the interdependence between attributes, a Normalized Mutual Information measure Rij between attributes Xi and Xj was introduced:
)
,
(
)
,
(
j
i
H
j
i
MI
R
ij
…(12))
,
(
2
)
1
)(
1
(
2
j
i
H
I
m
m
R
ij
I
j
….(13)Otherwise, the two attributes are false.
To account for the overall significant dependence of an attribute Xi with other attributes, the system introduces the sum of normalized interdependency redundancy SR|I| of Xi with other attributes Xj for all j, j ≠ i, in the data cluster.
Thus,
* ) , ( ,
)
(
N j i j
ij
R
i
SR
………. (14)where N* is the set of (i,j) attribute pairs satisfying (13). Based on SR(i), a simple recursive algorithm is proposed. A sub-grouping tree is used to discover subgroups in a data
The major steps in the algorithm are contained in the following procedure, where t is a user-specified threshold, I is an input data cluster, and Di is a partition of I based on the primary event xi of the attribute Xi:
1. Find the attribute Xi with the highest SR(i) in I
2: if SR(i) >= t then
3: Partition the compound events in I into Di based on the different primary events xi. 4: for each xi
5: if Di then call Sub grouping tree(Di, t)
{recursively call the algorithm} 6: end
7: else return I
The algorithm recursively partitions an input data cluster I into Di until the SR(i) of the all attributes is smaller than a prescribed threshold t.
The proposed system is designed to perform Pattern Extraction and Pattern Clustering process. The pattern clustering is done with actual data set clustering process. Maximal frequent item sets are clustered in the initial phase. The K-Means clustering algorithm is used for the clustering process. Pattern Filtering applied before the clustering process. The data clustering is simultaneously performed during the pattern clustering process.
Figure: 2 Proposed System Architecture
The Pattern and Data Clustering system is designed to integrate pattern extraction and clustering operations. The pattern and data clustering techniques are integrated to reduce the process time and memory
Extract Rules
Optimized
Database
Patterns
Pattern Grouping Pattern
Database
Rule
Simultaneous
Patient Cleaning
requirements. The Pattern and Data Clustering system is divided into four major modules: Dataset Management, Pattern Extraction, clustering process and performance analysis.
Dataset Management: The dataset management module is designed to maintain the dataset values. The dataset update and remove operations are handled by the dataset management module. The dataset entry and dataset list of sub modules are connected with the dataset management module. The dataset entry sub module is used to update new data values. The dataset items are displayed in dataset list sub module.
Pattern Extraction: The pattern extraction module is designed to perform rule mining operations. The clustering process module is designed to compute clustering tasks in various types.
Clustering Process: The cluster details show the records arranged in each cluster. The memory and process time factors are monitored during the clustering process. The simultaneous clustering is applied on the patterns and data values simultaneously.
Performance Analysis: The performance analysis module is designed to carry out process time and memory analysis. The process time analysis is evaluated to analyze the process time for each clustering technique. The fitness point is used to find data relevancy for the clusters. The fitness point analysis is done for all clustering process.
6. Hypothesis
The hypothesis describes the analysis factors for the research work. This simultaneous clustering technique is analyzed with three major metrics. They are process time, memory requirement and fitness value. The process time is estimated for each clustering process. The data clustering and pattern clustering process are performed to carry out comparative analysis. The simultaneous clustering metrics are extracted in two stages. They are pattern extraction stage and simultaneous clustering stage. The simultaneous clustering results are compared with the data clustering and pattern clustering techniques.
The memory value is estimated using the required primary memory for the process. The fitness is estimated using the fitness point estimation technique. The fitness point is estimated for all the three clustering techniques. The fitness point reflects the cluster accuracy. The hypothesis factors and its comparative analysis are done for different transaction data counts.
7. Results and Discussion
Table No.9 Data Clusters Vs SP Clusters for Process Time Analysis
S.No Transactions Data Clusters (msec)
SP Clusters (msec)
1 200 162 97
2 400 336 196
3 600 494 281
4 800 658 372
5 1000 825 466
Figure:3 Process Time Analysis – 3
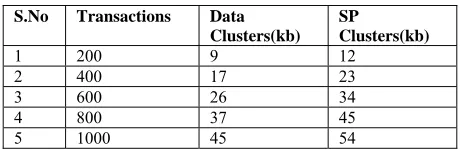
Table No.10 Clusters Data Clusters Vs SP Clusters for MemoryTime Analysis
S.No Transactions Data Clusters(kb)
SP
Clusters(kb)
1 200 9 12
2 400 17 23
3 600 26 34
4 800 37 45
5 1000 45 54
Process Time Analysis - 3 Clusters Data clusters VS SP clusters
0 200 400 600 800 1000
200 600 1000
Transactions
Process
Time(
MSec) Data Clusters
Figure No :4 Memory Usage Analysis – 3
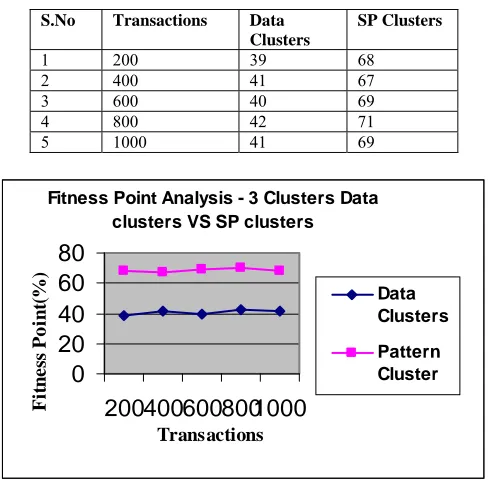
Table No.11 Clusters Data Clusters Vs SP Clusters for Fitness Point Analysis
S.No Transactions Data Clusters
SP Clusters
1 200 39 68
2 400 41 67
3 600 40 69
4 800 42 71
5 1000 41 69
Figure No: 5. Fitness Point Analysis – 3 Clusters
8.Conclusion and Future Direction
Data clustering is a time consuming and complex task for large data sets. Transaction relationship is used in the pattern extraction and clustering process. This concept is applied in the simultaneous pattern extraction and clustering scheme. The pattern extraction is carried out and clustering process is performed with the pattern relationship. Distance measure is the important issue in the clustering process. In the integrated system the distance measure is estimated for the patterns and transaction transfer process is done with the actual transactions. The simultaneous pattern extraction and clustering system is implemented to cluster the breast cancer patient diagnosis records. The symptom details are collected from the UCI machine-learning repository. The system is tested with 1000 records in the interval of 200 records. The redundant records removal and incomplete records are correction
0 10 20 30 40 50 60
200 600 1000
Memo
ry
Usag
e (KB)
Transactions
Memory Usage Analysis - 3 Clusters Data clusters VS SP clusters
Data Clusters SP Clusters
Fitness Point Analysis - 3 Clusters Data clusters VS SP clusters
0
20
40
60
80
2004006008001000
TransactionsFi
tn
e
ss Po
in
t(
%
)
Data Clusters
operations are performed in the preprocessing stage. Pattern extraction, data clustering, pattern clustering and simultaneous clustering operations are tested. The pattern extraction is performed with different support and confidence level.
The system uses three metrics to analyze the performance of the simultaneous clustering scheme. They are memory, process time and fitness point. The simultaneous clustering scheme requires 40% more memory than the data-clustering scheme. The process time reduced 25% than the data clustering process. The fitness values show that the simultaneous clustering scheme produces more accurate clustering than data clustering scheme. The simultaneous pattern extraction and clustering system is implemented to perform the clustering process in minimum time period. The association rule mining techniques are used to fetch frequent items. The pattern extraction process uses the frequent items. The data-clustering scheme is integrated with the pattern clustering mechanism. The system uses the patient diagnosis report for the testing process. The system can be enhanced with the following features: The integrated pattern extraction and clustering scheme is implemented with the K-Means clustering algorithm. The genetic algorithm can be used in the future development. The system can be enhanced to perform the pattern extraction and clustering process on image data collections. The current system is implemented as a stand-alone application. The simultaneous clustering algorithm can be updated for distributed environment.
REFERENCE
[1] Arun K.Pujari, “Data mining Techniques” University Press, First Edition, 2001.
[2] Barry Devlin, "Data Warehouse Architecture to Implementation" Addison-Wesley publications, 1997. [3] Diana Lorentz “Oracle 9i SQL reference” Oracle Corporation, 2001.
[4] Tom Chau and Andrew K.C. “Pattern Discovery by Residual Analysis and Recursive Partitioning ” IEEE 1999,vol. 11(6), DOI: 10.1109/69.824592.
[5] Imielinski, T. Virmani, A. Abdoulghani, A. Datamine “Application Programming Interface and Query Language for Database
mining” KDD System for mining large databases Proceedings,1996,pp.256-261.
[6] M.Thangamani and P.Thangaraj,“Ontology Based Fuzzy Document Clustering Scheme”,Modern Applied Science,vol.4(7),2010,pp.148-153.
[7] M.Thangamani and P.Thangaraj,“Survey on Text Document Clustering”,International Journal of Computer Science and Information Security,vol.8(4),2010.
[8] J.Hyma , Y.Jhansi ,S.Anuradha, A new hybridized approach of PSO & GA for document clustering, International Journal of Engineering Science and Technology, Vol. 2(5), 2010, 1221-1226
[9] Andrew K.C. Wong, Fellow, IEEE, and Gary C.L. Li “Simultaneous Pattern and Data Clustering for Pattern Cluster Analysis ” IEEE
Transactions on Knowledge and Data Engineering, vol. 20, no. 7, July 2008.
[10] D. Chiu and A.K.C. Wong, “Multiple Pattern Associations for Interpreting Structural and Functional Characteristics of
Biomolecules,” Information Science, vol. 167, nos. 1-4, pp. 23-29, 2004.
[11] Yang Wang “High-Order Pattern Discovery and Analysis of Discrete-Valued Data Sets” presented to the University of Waterloo Canada, 1997,vol.9(6), pp.877-893,DOI: 10.1109/69.649314,.
[12] Wai-Ho Au, Keith C.C. Chan “Attribute Clustering for Grouping, Selection, and Classification of Gene Expression Data”
Computational Biology and Bioinformatics,IEEE/ACM Transactions,vol.2(2),pp.83-101, 2005, DOI: 10.1109/TCBB.2005.17. [13] Jiawei Han and Micheline Kamber, “Data Mining: Concepts and Techniques”, Kaufmann Publishers, 2001.
Biographical notes:
G.RajKumar received the B.E.(ECE) and M.E.(APPLIED ELECTRONICS) from Bharathidasan University and Anna University respectively. He is working as an Assistant Professor in Department of ECE in Shanmuga Arts Science Technology and Research Academy,Thanjavur. His areas of interests are Signal Processing, Computer Networks ,Image Processing and data mining.He is a Life Member of Indian Society for Technical Education.
M. Thangamani completed her B.E.,(Electronic and Communication Engineering) from Government College of Technology, Coimbatore. She completed her M.E.,(Computer Science & Engineering) from Anna University , Chennai. Now she is doing research in the field of Clustering algorithms. Currently, she is working as a Lecturer in the School of Computer Technology and Applications, Kongu Engineering College, Tamil Nadu, India. She has published 5 articles in International journals and presented many papers in 35 National and International conferences. She has authored 15 books with reputed publishers and also guided many UG projects.