POLICY STATEMENT
The Teen Driver
Committee on Injury, Violence, and Poison Prevention Committee on Adolescence
ABSTRACT
Motor vehicle–related injuries to adolescents continue to be of paramount impor-tance to society. Since the original policy statement on the teenaged driver was published in 1996, there have been substantial changes in many state laws and much new research on this topic. There is a need to provide pediatricians with up-to-date information and materials to facilitate appropriate counseling and anticipatory guidance. This statement describes why teenagers are at greater risk of motor vehicle–related injuries, suggests topics suitable for office-based counseling, describes innovative programs, and proposes preventive interventions for pedia-tricians, parents, legislators, educators, and other child advocates.
MAGNITUDE OF THE PROBLEM
Motor vehicle crashes continue to be the leading cause of death for 16- to 20-year-olds, accounting for approximately 5500 occupant fatalities annually (27 deaths per 100 000 population).1Each year, approximately 450 000 teenagers are injured, and 27 000 of them require hospitalization.1,2 Of those killed, approxi-mately 63% are drivers and 37% are passengers. Two thirds of the teenagers who die in automobile crashes are male.1
In 2004, 7700 teenaged drivers were involved in a crash in which someone died. Although the 12 million adolescent drivers represent only approximately 6% of total drivers, they account for approximately 14% of the fatal crashes.3In terms of total crashes per million miles driven, 16- to 19-year-olds have a crash rate almost twice that of 20- to 24-year-olds, almost 3 times that of 25- to 29-year-olds, and more than 4 times that of 30- to 69-year olds.4Within the 16- to 19-year age range, the youngest drivers have the highest risk. The crash rate for 16-year-olds (35 crashes per million miles) is much higher than that even for 17-year-olds (20 crashes per million miles) and is almost 9 times greater than that of the general population of drivers (4 crashes per million miles).
ADOLESCENT RISK FACTORS
Inexperience
The adolescent, as a novice driver, lacks the experience and ability to perform many of the complex tasks of ordinary driving. Compared with experienced drivers, the novice adolescent driver is less proficient in detecting and responding to hazards and controlling the vehicle, especially at higher speeds. The risk of having a crash during the learner-permit stage is low, because the teenager is supervised and is generally not driving in high-risk conditions.4In contrast, data from Nova Scotia show that the highest crash rate is seen during the first month after the teenager gets his or her license (120 crashes per 10 000 drivers).5After
www.pediatrics.org/cgi/doi/10.1542/ peds.2006-2830
doi:10.1542/peds.2006-2830 All policy statements from the American Academy of Pediatrics automatically expire 5 years after publication unless reaffirmed, revised, or retired at or before that time.
Key Words
teen driver, graduated driver licensing, adolescent, car
Abbreviations
BAC— blood alcohol concentration ADHD—attention-deficit/hyperactivity disorder
GDL— graduated driver licensing
PEDIATRICS (ISSN Numbers: Print, 0031-4005; Online, 1098-4275). Copyright © 2006 by the American Academy of Pediatrics
the first month, the crash rate decreases rather quickly over the next 5 months (70 crashes per 10 000 drivers) and then shows a slower decline for the next 18 months (50 crashes per 10 000 drivers). Because rapid improve-ment is seen over such a short time period, inexperience appears to be a much more important factor in crash rates than young age. Although these data also show that driver experience improves driving skills, traditional driver education programs usually provide only 6 hours of on-the-road training.
Risk Taking
It is normal for adolescents to take chances, succumb to peer pressures, overestimate their abilities, and have emotional mood swings. These behaviors can all place the teenaged driver at greater risk of having automobile crashes. Males seem to be at especially high risk, possibly as a result of social norms and media images that equate fast driving and ability to perform difficult driving ma-neuvers as masculine.6In 2004, 38% of male and 25% of female drivers 15 to 20 years of age involved in fatal crashes were speeding at the time of the crash.7These rates were higher than for any other age group. It must be stressed, however, that the great majority of nonfatal crashes involving 16-year-old drivers result from inex-perience rather than from speeding or patently risky behavior.8
There is evidence from MRI research that the prefron-tal cortex (the area of the brain responsible for planning, impulse control, and executive decision-making) does not mature fully until the early to mid-20s.9 Although some legislators are using such brain-development re-search to support limits on teenaged driving, no scien-tific data have yet been published that link driving be-havior to neuroimaging findings.
Teenaged Passengers
With adolescent drivers, the chance of being involved in a car crash is directly proportional to the number of teenaged passengers being transported.4,10 Compared with driving alone, 16- to 17-year-olds have a 40% increased risk of crashing when they have 1 friend in the car, double the risk with 2 passengers, and almost 4 times the risk with 3 or more teenaged passengers. This relationship was not seen with adult drivers and is much less marked with 18- to 19-year-old drivers.4
The most dangerous way a teenager can get to and from school is by driving in a car with a teenaged driv-er.11 Open-campus school lunch policies, in which groups of teenagers drive away from school to eat, are also associated with high crash rates.12 The underlying reasons that teenaged passengers increase driving risk are not clear. In addition to general distraction, inten-tional encouragement of risky driving behavior and other social interactions may play a role. For both male and female teenaged drivers, the presence of a male
passenger results in faster speeds and more risky driving behaviors than does the presence of a female passenger.13
Nighttime Driving
Young teenaged drivers (16- and 17-year-olds) have a higher rate of nighttime crashes than do drivers of any other age group. Before nighttime driving curfews were instituted widely, only 14% of the miles driven by 16- to 17-year-old drivers occurred between 9PMand 6AM, yet
this time period accounted for 32% of fatal crashes in this age group. Although nighttime restrictions for teen-agers commonly limit driving after midnight, 58% of the fatal nighttime crashes occur in the 3-hour period before midnight.14For young teenaged drivers, fatal nighttime crashes are more likely to be associated with multiple teenaged passengers, speeding, and alcohol use.15 Al-though it is inherently more difficult to drive in the dark for drivers of all ages, fatigue and lack of practice may play a greater role for teenagers.
Alcohol, Marijuana, and Medications
During the period 1982–2001, fatal alcohol-related crash rates decreased by 60% for 16- to 17-year-old drivers.16 In 1982, 31% of teenagers fatally injured had an espe-cially high blood alcohol concentration (BAC) of 0.10% or greater, but this statistic dropped to 12% by 1995– 2001. Teenagers drink and drive less often than adults, but their crash risks are higher than adults when they do drink, especially at low and moderate BACs.17 In the 2005 Youth Risk Behavior Surveillance Study, 9.9% of 9th- through 12th-graders said that in the last month they had driven after drinking, and 28.5% admitted to riding with a driver who had been drinking.18
The prevalence of acute marijuana use among drivers is estimated to be 1% to 6%.19Of those drivers involved in severe injury crashes, positive cannabis levels or self-reports of recent use have been found in higher numbers (6%–25%),19–21suggesting a relationship between mar-ijuana and crashes. Much, but not all, of this relationship may be the result of other risky driving habits (positive BAC, no seat belt, speeding, sleepy while driving) that often are associated with marijuana use.19,20
In a study of 414 injured drivers (all ages) in Colo-rado, urine toxicology assays detected marijuana more frequently than alcohol (17% vs 14%).22Evidence from experimental studies has demonstrated impaired perfor-mance on various driving skills tests after the use of marijuana.23Furthermore, when just moderate doses of alcohol and marijuana were used together, a dramatic deterioration in driving performance (swerving, slowed reaction time) resulted.
problematic. A single 50-mg dose of diphenhydramine has been shown to have a greater effect on driving performance than a BAC of 0.10%.24 Failure to warn patients about the possibility of driving impairment from medications has resulted in successful lawsuits against physicians.
Safety Belts
As with adults, low safety belt use by teenagers results in preventable injuries and deaths. Approximately 82% of all motorists wear safety belts, but the rate reported by the National Center for Statistics and Analysis for 16- to 24-year-olds is 77%.25 In a study of teenaged drivers who were observed arriving at high school, only 62% were wearing their seat belts.26The passengers of these teenaged drivers wore restraints only 47% of the time. Analysis of fatal crashes with teenaged drivers demon-strates that safety belt use is lower in high-risk situations (driving under the influence of alcohol, nighttime driv-ing, having multiple teenaged passengers, when the car is older, and when the driver is male or unlicensed or has a suspended license). Safety belts were used by only 18% of drivers with a BAC of 0.10% or higher, com-pared with 40% of sober drivers.27
For teenaged occupants, approximately 58% of those who were killed in automobile crashes in 2004 were unbelted.1Because safety belts have been shown to be 45% effective in preventing front-seat fatalities, many of these deaths could have been prevented.28Air bags alone have been found to be only 10% effective in preventing deaths.29The reasons teenagers give for not wearing seat belts include not “cool,” peer pressure, wrinkles clothes, traveling short distance, and feeling that “nothing will happen to me.”30 Almost half of teenagers (47%) say they feel that safety belts are “as likely to cause harm as to help,” 27% said wearing a safety belt makes them “worry more about being in an accident,” and 30% indicated they would feel “self-conscious if they were going against the group norm in wearing safety belts.”31 Only 27% of the actors playing motor vehicle occupants in 25 recent G-rated and PG-rated films were portrayed wearing safety belts.32
Vehicles Driven
There is evidence that adolescents are more likely than adults to drive smaller and older-model cars, especially if the teen is the owner of the car.33,34This is problematic, because smaller cars provide less crash protection than larger cars, and older-model cars often have fewer mod-ern safety features.35When teenagers drive sport utility vehicles, they are significantly more likely to have a rollover than are drivers older than 24 years.36 Sporty cars with high-performance features may encourage speeding.37One survey showed that parents choose cars for their teenagers more on the basis of price and style than on the basis of safety features.33
Distractions Including Cellular Phones
Distractions are contributing factors for motor vehicle crashes for both adolescents and adults. Eating, drinking, and adjusting the radio or the climate controls each cause more crashes than cellular phone use.38 Cellular phone use has been estimated to increase crash rates by fourfold,39 and hands-free models are not associated with significantly less risk.40There is some evidence that distractions may be a greater problem for the inexperi-enced driver. Distracted novice drivers tend to glance away from the road for longer periods of time, during which they have trouble responding to hazards and stay-ing in their lane.41
Unlicensed Drivers
Drivers without valid licenses (unlicensed, revoked, sus-pended) tend to be younger and male, are more apt to have been involved in a fatal nighttime crash or to have a recent conviction for driving while intoxicated, and are more likely to have had multiple license suspensions. Approximately 5% of drivers younger than 20 years who have been involved in a fatal crash were driving with their license suspended or revoked, and 10% had never held a license.42Unlicensed teenaged drivers are 5 times more likely to have had a conviction for driving while intoxicated and 3 times more likely to have had a previous license suspension than are fatally injured teenagers with valid licenses.3
Attention-Deficit/Hyperactivity Disorder
Teenaged drivers with attention-deficit/hyperactivity disorder (ADHD) are 2 to 4 times more likely to be injured in a motor vehicle crash than are their peers without ADHD.43 They are also more likely to have repeat traffic citations and to have their licenses sus-pended or revoked. Driving performance of teenagers with ADHD seems to improve with psychostimulant medication, primarily because of decreased errors of in-attentiveness.44 Compared with 3-times-a-day dosing of methylphenidate, longer-acting, controlled-release medication may result in better driving throughout the day and, particularly, during the evening hours.45
PROPOSED INTERVENTIONS
Graduated Licensing Systems
the teenaged driver passed a road test and obtained an unrestricted license.
In contrast, in a GDL system, there are 3 stages: a learner’s permit, an intermediate or provisional stage, and a regular driver’s license. Each stage has specific components, restrictions, and minimum time require-ments. To graduate to the next stage, the novice must spend the required time at the lower stage, acquire and demonstrate proficiency in driving skills, and not incur a driving violation for a defined period. The provisional stage, with its restrictions, is designed to give the novice a chance to gain extensive driving experience under low-risk conditions. Although currently there are inad-equate research data to determine exactly when the permit and provisional stages should begin and for how long they should last, some consensus of expert opinion does exist.47
Initial evaluations of GDL programs have been en-couraging. In Florida, the first state to pass a GDL law, the number of fatal crashes for 15- to 17-year-olds de-creased by 9% in the year after the law was instituted.48 A Cochrane Databasereview of 13 GDL programs found reductions in total crashes (26%– 41%), crashes result-ing in injuries (4%– 43%), and crashes resultresult-ing in hos-pitalizations (35%) for 16-year-old drivers. Further-more, these crash rates remained decreased for multiple years after the new GDL laws went into effect.49 It is unlikely that safer driving by young teenagers is the main reason for decreased crash rates seen with GDL. Data show that after GDL laws are passed, there are fewer licensed young drivers and they are driving fewer unsupervised miles because of the imposed restrictions.50 Between 1993 and 2003, the percentage of 16-year-olds who became licensed decreased by 26%, and there was a 13% decrease for 17-year-olds and a 5% decrease for 18-year-olds.51Over the same 10-year period, the like-lihood that a 16-year-old license holder would be in-volved in a fatal crash remained unchanged (73–74 crashes per 100 000 license holders). Fatal crash rates per licensed driver were also unchanged for older teen-aged drivers.
In addition to delay in licensure, it appears that the 3 provisions of GDL responsible for the most benefit are (1) limits on nighttime driving, (2) restrictions on the number of passengers during the intermediate stage, and (3) requirements that novice drivers remain crash and violation free for a certain period of time before advanc-ing to the next level.52Unfortunately, many states have not incorporated these components into their laws. As of March 2006, the Insurance Institute for Highway Safe-ty’s evaluation of GDL laws rated 23 states and the District of Columbia as “good,” 15 states as “fair,” 11 states as “marginal,” and 1 state as “poor.”53For 15- to 17-year-old drivers, data from 1992–2002 show that good GDL programs decreased fatal crashes by 19%, fair programs reduced nighttime crashes by 13% (but had no
effect on daytime crashes), and marginal laws had no measured benefit.54
Nighttime and Passenger Restrictions
Although GDL laws are effective, it is difficult to know how much each individual restriction contributes to im-proved crash and injury rates. Historically, when juris-dictions implemented general curfew ordinances for teenagers, crash and injury rates decreased substantial-ly.55In the decade between 1993 and 2003, the percent-age of fatal crashes that occurred between midnight and 5AM remained unchanged (10%) for 16-year-old
driv-ers.51 Recently published evidence shows that in states with a driving restriction that starts before midnight, there has been a 13% decrease in evening crash fatalities for 15- to 17-year-old drivers.54 Although there are no crash data to support the practice, many states exempt school, work, and religious activities from the nighttime driving restriction. The Insurance Institute for Highway Safety supports such an exemption, stating that “the intention is not to deny essential driving at night, but to limit high-risk recreational driving.”47
Driving with fewer teenaged passengers has been proven safer. For 16-year-old drivers from 1993–2003, the proportion of fatal crashes involving teenaged pas-sengers decreased from 53% to 44%.51Data from 1992– 2002 for 15- to 17-year-old drivers show that the de-crease in teenaged fatalities from passenger restrictions was more the result of fewer teenagers being put at risk rather than a substantial reduction in the “distraction factor” associated with teenaged passengers.54 Unfortu-nately, many teenagers do not comply with a passenger restriction, many parents do not support it, and police frequently do not enforce it. As of March 2006, 44 states and the District of Columbia restrict nighttime driving to some degree, but only 21 states have driving curfews that start before midnight. Sixteen states still have not implemented any form of passenger restriction, and only 3 states and the District of Columbia maintain the pas-senger restriction until the driver is 18 years of age.53
Driver Education
2-step approach has been suggested (but not yet widely implemented or evaluated) in which the basic course in vehicle handling and “rules of the road” are taught dur-ing the permit stage. In the second step, the intermediate stage, the student would be required to take a more advanced safety course in which skills such as hazard recognition, avoidance of risk, and adjusting to road and weather conditions are taught.59Courses that teach skid control and advanced maneuvering techniques should be avoided by novice drivers, because they can encour-age overconfidence and a more aggressive driving style, resulting in increased crash rates.60
It has been suggested that driving experience, not training, is the key to becoming a safer driver.61 When permit and provisional stages are shortened and training time is reduced for graduates of formal driver education programs, crash rates increase.62Some states have low-ered the permit age to allow for more supervised prac-tice, but this could potentially lead to early licensure of the youngest, most dangerous drivers.
The American Automobile Association and other or-ganizations sell driver education materials including in-struction manuals, log books, videotapes, and CD-ROMs that are designed to help parents supervise this on-road training.63 Relatively inexpensive driving-simulation programs for use on a home computer may be beneficial in helping students learn to identify road hazards.63,64 Whether practice on such simulators translates into safer driving or decreased crashes remains to be shown.
Alcohol-Related Measures
Two types of alcohol-related regulations exist: minimum drinking-age laws and drunk-driving laws. The latter include “zero-tolerance” alcohol laws and regulations for licensure suspension or revocation. All 50 states cur-rently have minimum drinking-age laws that prohibit the sale of alcohol to anyone younger than 21 years. An analysis of 46 scientific studies on the efficacy of raising the minimum legal drinking age to 21 years showed a 17% median decrease in fatal automobile crashes in adolescents.65 The National Highway Traffic Safety Ad-ministration estimates that minimum legal drinking-age laws have saved the lives of almost 24 000 18- to 20-year-olds since 1975.3Unfortunately, youth can still ob-tain alcohol relatively easily, and underaged drinkers are rarely caught or punished. For example, a study in a metropolitan area of northern California showed that minors were able to purchase alcohol in 39% of at-tempts.66
By 1998, all states had passed zero-tolerance laws that set a maximum BAC of 0.02% or less for young drivers. An offender is faced with administrative (not involving the courts) suspension or revocation of his or her driv-er’s license. Meta-analysis of several studies revealed that fatal crash rates decreased 9% to 24% after zero-tolerance laws were enacted.65These laws work both by
deterring youth through fear of losing their driver’s li-cense if they drive after drinking and by reinforcing the broad community disapproval of drinking and driving. Although underaged drinking is prevalent and often tolerated, drinking and driving has become less socially acceptable among youth.67There is evidence that drunk driving is influenced more by friends’ approval or disap-proval than by fear of arrest and sanction.68
Although youth and community educational pro-grams such as Mothers Against Drunk Driving (MADD) and Students Against Destructive Decisions (SADD) have the potential to change knowledge and attitudes, there is little evidence to prove that they have a direct effect on youth drinking and alcohol-related driving.67 Using a designated driver has become common, but in many instances the designated driver does not abstain from drinking alcoholic beverages.69On the other hand, there is significant evidence that sobriety checkpoints, an aggressive enforcement strategy, can decrease crash rates by approximately 20%.65Sobriety checkpoints are designed to be a deterrent to alcohol-related driving and are most effective when heavily publicized so that driv-ers perceive that there is a significant chance they will be caught and arrested.
Improved Safety Belt Laws
There are 2 types of safety belt laws: primary and sec-ondary. With a primary law, a police officer can issue a citation when he or she simply observes an unbelted occupant. With secondary laws, a safety belt citation can be written only after the officer has stopped the car for another infraction. As of September 2005, 21 states and the District of Columbia have primary laws, but many of those laws are limited to the driver and front-seat pas-sengers.70Safety belt use is approximately 85% in states with primary laws but only 75% in states with second-ary laws.71 Teenaged drivers killed during 1995–2000 were wearing safety belts 47% of the time in states with primary laws but only 30% of the time in states with secondary laws.72
Highly visible strict enforcement is the key to increas-ing use of restraints. People will buckle up if they per-ceive that they are likely to be fined. Selective traffic enforcement programs with intense media publicity and increased police patrols have been shown, at least in the short term, to increase safety belt use by 8% to 24% and decrease fatal and nonfatal injuries by 7% to 15%.29
belt use among teenagers.73,75Economic incentives may also increase safety belt use.76 Technologic solutions, such as electronic safety belt reminders, safety belt use recorders, and interlock systems that do not allow the car stereo to function unless the safety belt is fastened, may be valuable but require further evaluation.73
Parental Interventions
With regard to teenaged driving, parents have several roles: (1) give permission for the teenager to obtain a license, (2) control access to the vehicle, (3) set family restrictions and punishments for infractions, (4) influ-ence selection of the vehicle, (5) be a driving instructor and supervisor, and (6) serve as a role model for safe driving. Unfortunately, parents are often completely un-aware of their teenager’s risky driving habits.77 They tend to place more restrictions on the details of the trip (permission, destination, time home) than on dangerous driving conditions (eg, night driving with teenaged pas-sengers).78
Risky teenaged driving behaviors, traffic violations, and crashes are less common when parents impose strict limitations.79 Although not yet studied in great detail, parent-teenager written driving contracts that clearly delineate rules and consequences may result in better communication, more restrictions, and safer parent and teenager attitudes.78,80,81To date, there is insufficient ev-idence that such contracts improve driver safety or de-crease violations and crashes.
Emerging technologies, such as on-board cameras and computers, allow parents to determine whether their teenager is driving safely, but this approach has not yet been evaluated. Finally, parents must recognize their importance as positive role models in terms of safe driv-ing and safety belt use. Parents with bad drivdriv-ing records are much more likely to have children who get traffic citations and are involved in motor vehicle crashes.82
RECOMMENDATIONS
Because motor vehicle crashes pose a major, continuing threat to the health of teenagers, the American Academy of Pediatrics makes the following recommendations.
Anticipatory Guidance by Pediatricians Pediatricians should:
● Know their state laws regarding teenaged drivers, the teenaged driver-licensing process, and physician re-porting requirements for medical conditions that could impair driving ability.
● Distribute educational materials about local GDL pro-grams and teenaged driver safety to their adolescent patients (see Appendix 1).
● Alert parents and teenagers to high-risk situations for teenaged drivers (Table 1).
● Encourage seat belt use.
● Discourage distractions when driving (eating, drink-ing, music, cellular phones).
● Encourage teenager-parent written contracts (see Ap-pendix 2 for sample) that place restrictions on the teenaged driver. At a minimum, parents should place restrictions on nighttime driving (preferably after 9:00 PM) and limits on the number of teenaged
pas-sengers. Initially, the rules should be fairly strict, but they can be relaxed as the teenager becomes older and gains more driving experience.
● Counsel teenagers about the dangers of driving while impaired (under the influence of alcohol, drugs, or medications or feeling ill, tired, depressed, or angry). Encourage a “safe-ride” agreement in which the teen-ager agrees to call the parent rather than drive while impaired and the parent promises to assist in arrang-ing a ride home in a nonjudgmental manner.
● Encourage parents to require that the vehicle driven by the teenager is safe and in good condition.
● Advise parents that in many states, they have the authority to request that the driver’s license of their minor child be revoked.
● Encourage parents to be positive role models. ● Advise parents about the various driving schools, Web
sites, computer driving simulations, and parent-super-vised driving lessons that are available (Appendix 1).
Community Advocacy by Pediatricians Pediatricians should:
● Support community efforts that encourage safe teen-aged driving.
● Work with schools to encourage safety belt use and discourage alcohol use.
● Discourage school systems from continuing traditional driver education programs that are ineffective and encourage licensure of young teenagers.
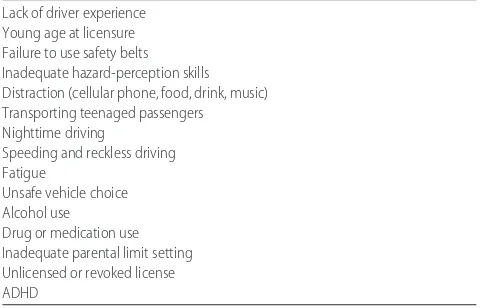
TABLE 1 Contributors to Teenaged Driver Crashes and Injury
Lack of driver experience Young age at licensure Failure to use safety belts Inadequate hazard-perception skills Distraction (cellular phone, food, drink, music) Transporting teenaged passengers Nighttime driving
Speeding and reckless driving Fatigue
Unsafe vehicle choice Alcohol use
● Discourage school policies that allow students to drive off campus for lunch.
● Encourage police to enforce GDL and seat belt laws. ● Collaborate with police and media to promote sobriety
checkpoints and safety belt education and enforce-ment programs.
Legislative Advocacy by Pediatricians Pediatricians should:
● Support strong GDL legislation in their states (Table 2). ● Support improvement and enforcement of laws de-signed to limit the purchase, possession, and con-sumption of alcohol by underage adolescents.
● Support primary enforcement of safety belt laws for all occupants.
Involvement of the Alcoholic Beverage and Entertainment Industries in Encouraging Responsible Behavior
Pediatricians should:
● Encourage the alcoholic beverage industry to elimi-nate advertising aimed at youth.
● Encourage the media to avoid portrayal of speeding and reckless driving in contexts that invite imitation.
● Encourage the media to show universal use of safety belts.
COMMITTEE ON INJURY, VIOLENCE, AND POISON PREVENTION, 2005–2006 Gary A. Smith, MD, DrPH, Chairperson
Carl R. Baum, MD
M. Denise Dowd, MD, MPH Dennis R. Durbin, MD, MSCE H. Garry Gardner, MD Robert D. Sege, MD, PhD Michael S. Turner, MD *Jeffrey C. Weiss, MD Joseph L. Wright, MD, MPH
LIAISONS
Ruth A. Brenner, MD, MPH
National Institute of Child Health and Human Development
Stephanie Bryn, MPH
Health Resources and Services
Administration/Maternal and Child Health Bureau Julie Gilchrist, MD
Centers for Disease Control and Prevention Jonathan D. Midgett, PhD
US Consumer Product Safety Commission Alexander (Sandy) Sinclair
National Highway Traffic Safety Administration Lynne J. Warda, MD
Canadian Paediatric Society
STAFF
Rebecca Levin-Goodman, MPH
COMMITTEE ON ADOLESCENCE, 2005–2006 Joanthan D. Klein, MD, Chairperson Michelle S. Barratt, MD
Margaret J. Blythe, MD Paula K. Braverman, MD Angela Diaz, MD
David S. Rosen, MD Charles J. Wibbelsman, MD
LIAISONS
Miriam Kaufman, MD
Canadian Paediatric Society Marc R. Laufer, MD
American College of Obstetricians and Gynecologists Benjamin Shain, MD
American Academy of Child and Adolescent Psychiatry
STAFF
Karen Smith
*Lead author
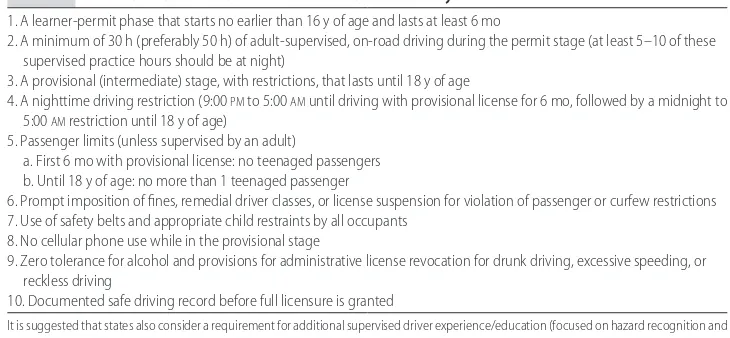
TABLE 2 Essential Features That Should Be Mandated in GDL Systems
1. A learner-permit phase that starts no earlier than 16 y of age and lasts at least 6 mo
2. A minimum of 30 h (preferably 50 h) of adult-supervised, on-road driving during the permit stage (at least 5–10 of these supervised practice hours should be at night)
3. A provisional (intermediate) stage, with restrictions, that lasts until 18 y of age
4. A nighttime driving restriction (9:00PMto 5:00AMuntil driving with provisional license for 6 mo, followed by a midnight to 5:00AMrestriction until 18 y of age)
5. Passenger limits (unless supervised by an adult)
a. First 6 mo with provisional license: no teenaged passengers b. Until 18 y of age: no more than 1 teenaged passenger
6. Prompt imposition of fines, remedial driver classes, or license suspension for violation of passenger or curfew restrictions 7. Use of safety belts and appropriate child restraints by all occupants
8. No cellular phone use while in the provisional stage
9. Zero tolerance for alcohol and provisions for administrative license revocation for drunk driving, excessive speeding, or reckless driving
10. Documented safe driving record before full licensure is granted
REFERENCES
1. National Highway Traffic Safety Administration.Traffic Safety Facts 2004: A Compilation of Motor Vehicle Crash Data From the Fatality Analysis Reporting System and the General Estimates System (Early Edition). Washington, DC: National Highway Traffic Safety Administration; 2005. US Department of Transportation publication HS 809-919
2. Centers for Disease Control and Prevention, National Center for Injury Prevention and Control. Web-based Injury Statistics Query and Reporting System (database). Available at: www. cdc.gov/ncipc/wisqars. Accessed April 25, 2006
3. National Highway Traffic Safety Administration.Traffic Safety Facts: 2004 Data—Young Drivers. Washington, DC: National Highway Traffic Safety Administration; 2005. US Department of Transportation publication HS 809-918
4. Williams AF. Teenage drivers: patterns of risk. J Safety Res.
2003;34:5–15
5. Mayhew DR, Simpson HM, Pak A. Changes in collision rates among novice drivers during the first months of driving.Accid Anal Prev.2003;35:683– 691
6. Arnett JJ. Developmental sources of crash risk in young driv-ers.Inj Prev.2002;8(suppl 2):ii17–ii21; discussion ii21–ii23 7. National Highway Traffic Safety Administration.Traffic Safety
Facts: 2004 Data—Speeding.Washington, DC: National Highway Traffic Safety Administration; 2005. US Department of Trans-portation publication HS 809-915
8. McKnight AJ, McKnight AS. Young novice drivers: careless or clueless?Accid Anal Prev.2003;35:921–925
9. Giedd JN. Structural magnetic resonance imaging of the ado-lescent brain.Ann N Y Acad Sci. 2004;1021:77– 85
10. Chen LH, Baker SP, Braver ER, Li G. Carrying passengers as a risk factor for crashes fatal to 16- and 17-year-old drivers.
JAMA.2000;283:1578 –1582
11. National Research Council, Committee on School Transporta-tion Safety.The Relative Risks of School Travel: A National Perspec-tive and Guidance for Local Community Risk Assessment. Washing-ton, DC: National Academies Press; 2002
12. Stone LM, Runyun CW. High school off-campus lunch policies and adolescent motor vehicle crash risks.J Adolesc Health.2005; 36:5– 8
13. Simons-Morton B, Lerner N, Singer J. The observed effects of teenage passengers on the risky driving behavior of teenage drivers.Accid Anal Prev.2005;37:973–982
14. Williams AF, Ferguson SA. Rationale for graduated licensing and the risks it should address. Inj Prev. 2002;8(suppl 2): ii9 –ii14; discussion ii14 –ii16
15. Williams AF, Preusser DF. Night driving restrictions for youth-ful drivers: a literature review and commentary.J Public Health Policy.1997;18:334 –345
16. Centers for Disease Control and Prevention. Involvement by young drivers in fatal alcohol-related motor vehicle crashes: United States, 1982–2001.MMWR Morb Mortal Wkly Rep.2002; 51:1089 –1091
17. Zador PL, Krawchuk SA, Voas RB. Alcohol-related relative risk of driver fatalities and driver involvement in fatal crashes in relation to driver age and gender: an update using 1996 data.
J Stud Alcohol.2000;61:387–395
18. Centers for Disease Control and Prevention. Youth risk behav-ior surveillance: United States, 2005.MMWR Surveill Summ.
2006;55(5):1–108
19. Blows S, Ivers RQ, Connor J, Ameratunga S, Woodward M, Norton R. Marijuana use and car crash injury.Addiction.2005; 100:605– 611
20. Laumon B, Gadegbeku B, Martin JL, Biecheler MB. Cannabis intoxication and fatal road crashes in France: population based
case-control study [published correction appears inBMJ. 2006; 332:1298].BMJ.2005;331:1371
21. Walsh JM, Flegel R, Atkins R, et al. Drug and alcohol use among drivers admitted to a level-1 trauma center.Accid Anal Prev.2005;37:894 –901
22. Lowenstein SR, Koziol-McLain J. Drugs and traffic crash responsibility: a study of injured motorists in Colorado.
J Trauma.2001;50:313–320
23. National Highway Traffic Safety Administration. Traffic Tech: Marijuana and Alcohol Combined Increase Impairment. Washing-ton, DC: National Highway Traffic Safety Administration; 1999. Available at: www.nhtsa.dot.gov/people/outreach/ traftech/pub/tt201.html. Accessed April 25, 2006
24. National Highway Traffic Safety Administration. Drugs and Human Performance Fact Sheet: Diphenhydramine. Available at: www.nhtsa.dot.gov/people/injury/research/job185drugs/ diphenhydramine.htm. Accessed April 25, 2006
25. National Highway Traffic Safety Administration, National Cen-ter for Statistics and Analysis.Traffic Safety Facts. Research Note: Safety Belt Use in 2004—Demographic Results.Washington, DC: National Highway Traffic Safety Administration; 2005. US De-partment of Transportation publication HS 809-848
26. Williams AF, McCartt AT, Geary L. Seatbelt use by high school students.Inj Prev.2003;9:25–28
27. McCartt AT, Northrup VS. Factors related to seat belt use among fatally injured teenage drivers. J Safety Res.2004;35: 29 –38
28. Evans L. The effectiveness of safety belts in preventing fatali-ties.Accid Anal Prev.1986;18:229 –241
29. Dinh-Zarr TB, Sleet DA, Shults RA, et al. Reviews of evidence regarding interventions to increase the use of safety belts.Am J Prev Med.2001;21(4 suppl);48 – 65
30. Volkswagen of America. Why don’t teens buckle up? VW releases nationwide safety survey of young drivers. Available at: http://media.vw.com/article㛭display.cfm?article㛭id⫽9084. Accessed April 25, 2006
31. Boyle JM, Vanderwolf P; National Highway Traffic Safety Ad-ministration.2003 Motor Vehicle Occupant Safety Survey (MVOSS). Washington, DC: National Highway Traffic Safety Administration; 2004. US Department of Transportation pub-lication HS 809-789
32. Pellitier AR, Quinlan KP, Sacks JJ, Van Gilder TJ, Gilchrist J, Ahluwalia HK. Injury prevention practices as depicted in G-rated and PG-G-rated movies.Arch Pediatr Adolesc Med.2000;154: 283–286
33. Cammisa MX, Williams AF, Leaf WA. Vehicles driven by teen-agers in four states.J Safety Res.1999;30:25–30
34. Williams AF, Leaf WA, Simons-Morton BG, Hartos JL. Vehicles driven by teenagers in their first year of licensure.Traffic Inj Prev.2006;7:23–30
35. Ferguson SA. Other high-risk factors for young drivers: how graduated licensing does, doesn’t, or could address them.J Safety Res.2003;34:71–77
36. National Highway Traffic Safety Administration, National Cen-ter for Statistics and Analysis.Traffic Safety Facts: Research Note—
Younger Drivers and Sport Utility Vehicles.Washington, DC: Na-tional Highway Traffic Safety Administration; 2003. US Department of Transportation publication HS 809-636 37. Insurance Institute for Highway Safety.Does Your Teenager Drive
a Safe Car? Arlington, VA: Insurance Institute for Highway Safety; 1999. Available at: www.hwysafety.org/news/1999/ iihs㛭news㛭092199.pdf. Accessed April 25, 2006
38. Stutts JC, Reinfurt DW, Rodgman EA. The role of driver dis-traction in crashes: an analysis of 1995–1999 Crashworthiness Data System data.Annu Proc Assoc Adv Automot Med.2001;45: 287–301
cellular-telephone calls and motor vehicle collisions.N Engl J Med.
1997;336:453– 458
40. Strayer DL, Drews FA, Johnston WA. Cell-phone-induced fail-ures of visual attention during simulated driving.J Exp Psychol Appl.2003;9:23–32
41. Wikman A, Nieminen T, Summala H. Driving experience and time-sharing during in-car tasks on roads of different width.
Ergonomics.1998;41:358 –372
42. Griffin LI III, DeLaZerda S.Unlicensed to Kill. Washington, DC: AAA Foundation for Traffic Safety; 2000
43. Barkley RA, Murphy KR, Kwasnik MA. Motor vehicle driving competencies and risks in teens and young adults with atten-tion deficit hyperactivity disorder. Pediatrics. 1996;98: 1089 –1095
44. Cox DJ, Humphrey JW, Merkel RL, Penberthy JK, Kovatchev B. Controlled-release methylphenidate improves attention during on-road driving by adolescents with attention-deficit/ hyperactivity disorder.J Am Board Fam Pract.2004;17:235–239 45. Cox DJ, Merkel RL, Penberthy JK, Kovatchev B, Hankin CS. Impact of methylphenidate delivery profiles on driving perfor-mance of adolescents with attention-deficit/hyperactivity dis-order.J Am Acad Child Adolesc Psychiatry.2004;43:269 –275 46. Williams AF, Weinberg K, Fields M, Ferguson SA. Current
requirements for getting a drivers license in the United States.
J Safety Res.1996;27:93–101
47. Williams AF, Mayhew DR.Graduated Licensing: A Blueprint for North America.Arlington, VA: Insurance Institute for Highway Safety (USA) and Traffic Injury Research Foundation (Canada): 2004. Available at: www.hwysafety.org/research/ topics/pdf/blueprint.pdf. Accessed April 25, 2006
48. Ulmer RG, Preusser DF, Williams AF, Ferguson SA, Farmer CM. Effect of Florida’s graduated licensing program on the crashes of teenage drivers.Accid Anal Prev.2000;32:527–532 49. Hartling L, Wiebe N, Russell K, Petruk J, Spinola C, Klassen TP.
Graduated driver licensing for reducing motor vehicle crashes among young drivers. Cochrane Database Syst Rev. 2004;(2): CD003300
50. Shope JT, Molnar LJ. Graduated driver licensing in the United States: evaluation results from the early programs.J Safety Res.
2003;34:63– 69
51. Williams AF, Ferguson SA, Wells JK. Sixteen-year-old drivers in fatal crashes, United States, 2003.Traffic Inj Prev.2005;6: 202–206
52. McKnight AJ, Peck RC. Graduated driver licensing: what works?Inj Prev.2002;8(suppl 2):ii32–ii36; discussion ii36 –ii38 53. Insurance Institute for Highway Safety.US Licensing Systems for Young Drivers. Arlington, VA: Insurance Institute for Highway Safety; 2006. Available at: www.hwysafety.org/laws/state㛭laws/ pdf/us㛭licensing㛭systems.pdf. Accessed April 25, 2006 54. Morrisey MA, Grabowski DC, Dee TS, Campbell C. The
strength of graduated drivers license programs and fatalities among teen drivers and passengers.Accid Anal Prev.2006;38: 135–141
55. Lin ML, Fearn KT. The provisional license: nighttime and passen-ger restrictions—a literature review.J Safety Res.2003;34:51– 61 56. Mayhew DR, Simpson HM. The safety value of driver education
and training.Inj Prev.2002;8(suppl 2):ii3–ii7; discussion ii7–ii8 57. Robertson LS. Crash involvement of teenaged drivers when
driver education is eliminated from high school.Am J Public Health.1980;70:599 – 603
58. Vernick JS, Li G, Ogaitis S, MacKenzie EJ, Baker SP, Gielen AC. Effects of high school driver education on motor vehicle crashes, violations, and licensure.Am J Prev Med. 1999;16(1 suppl):40 – 46
59. National Highway Traffic Safety Administration. Research Agenda for an Improved Novice Driver Education Program: Report to Congress. Washington, DC: National Highway Traffic Safety
Administration; 1994. US Department of Transportation pub-lication HS 808-161
60. Engstrom I, Gregersen NP, Hernetkoski K, Keskinen E, Nyberg A.Young Novice Drivers, Driving Education and Training: Literature Review.Linko¨ping, Sweden: Swedish National Road and Trans-port Research Institute; 2003. VTI rapTrans-port 491A-2003 61. Williams AF, Ferguson SA. Driver education renaissance?Inj
Prev.2004;10:4 –7
62. Mayhew DR, Simpson HM, Desmond K, Williams AF. Specific and long-term effects of Nova Scotia’s graduated licensing pro-gram.Traffic Inj Prev.2003;4:91–97
63. AAA Foundation for Traffic Safety. Driver-ZED. Available at: www.driverzed.org. Accessed April 25, 2006
64. Fisher DL, Laurie NE, Glaser R, et al. Use of a fixed-base driving simulator to evaluate the effects of experience and PC-based risk awareness training on drivers’ decisions. Hum Factors.
2002;44:287–302
65. Shults RA, Elder RW, Sleet DA, et al. Reviews of evidence regarding interventions to reduce alcohol-impaired driving [published correction appears inAm J Prev Med. 2002;23:72].
Am J Prev Med.2001;21(4 suppl):66 – 88
66. Freisthler B, Gruenewald PJ, Treno AJ, Lee J. Evaluating alco-hol access and the alcoalco-hol environment in neighborhood areas.
Alcohol Clin Exp Res.2003;27:477– 484
67. National Highway Traffic Safety Administration.Determine Why There Are Fewer Young Alcohol-Impaired Drivers. Washington, DC: National Highway Traffic Safety Administration; 2001. US Department of Transportation publication HS 809-348 68. Grube JW, Voas RB. Predicting underage drinking and driving
behaviors.Addiction.1996;91:1843–1857
69. Barr A, MacKinnon DP. Designated driving among college students.J Stud Alcohol.1998;59:549 –554
70. National Highway Traffic Safety Administration. Key pro-visions of occupant restraint laws through September 2005. Available at: www.nhtsa.dot.gov/people/injury/airbags/ State㛭laws-belts05/occupantrestraintschart.pdf. Accessed April 25, 2006
71. National Highway Traffic Safety Administration.Traffic Safety Facts. Research Note: Safety Belt Use in 2005—Overall Results.
Washington, DC: National Highway Traffic Safety Admin-istration; 2005. US Department of Transportation publication HS 809-932
72. McCartt AT, Shabanova VI, National Safety Council. Teenage seat belt use: white paper. Available at: www.nsc.org/public/ teen0702.pdf. Accessed April 25, 2006
73. National Highway Traffic Safety Administration.Increasing Teen Safety Belt Use: a Program and Literature Review.Washington, DC: National Highway Traffic Safety Administration; 2005. US De-partment of Transportation publication HS 809-899
74. Goodwin AH, Foss RD. Graduated driver licensing restrictions: awareness, compliance, and enforcement in North Carolina.J Safety Res.2004;35:367–374
75. McCartt AT, Geary LL, Solomon MG. Requiring belt use as part of a school parking permit program: does it increase students’ belt use?Traffic Inj Prev.2005;6:120 –126
76. Campbell BJ, Hunter WW, Stutts JC. The use of economic incentives and education to modify safety belt use behavior of high school students.Health Educ.1984;15:30 –33
77. Beck KH, Shattuck T, Raleigh R. Parental predictors of teen driving risk.Am J Health Behav.2001;25:10 –20
78. Simons-Morton BG, Hartos JL. How well do parents manage young driver crash risk?J Safety Res.2003;34:91–97
79. Hartos J, Eitel P, Simons-Morton B. Parenting practices and adolescent risky driving: a three-month prospective study.
Health Educ Behav.2002;29:194 –206
restric-tions of teen driving privileges.Am J Public Health.2005;95: 447– 452
81. Votta E, MacKay M. Evaluating the acceptability and feasibility of the I Promise Program: a driving program for families with young new drivers.Inj Prev.2005;11:369 –372
82. Ferguson SA, Williams AF, Chapline JF, Reinfurth DW, De-Leonardis DM. Relationship of parent driving records to the driving records of their children. Accid Anal Prev. 2001;33: 229 –234
APPENDIX 1: RESOURCES FOR PEDIATRICIANS
1. American Academy of Pediatrics (www.aap.org): pediatricians can purchase a parent-teen driver agreement and fact sheet for use in their practices.
2. National Highway Traffic Safety Administration (NHTSA) (www.nhtsa.gov): the NHTSA Web site contains a booklet and a downloadable brochure about GDL (go to Traffic Safety: New Drivers). The site also has information about impaired and dis-tracted driving, occupant protection, and other driv-ing issues. Detailed motor vehicle crash statistics are available in the annual traffic safety facts report.
3. Insurance Institute for Highway Safety (IIHS) (www. iihs.org): the IIHS Web site contains a huge amount of information about teenaged driving and GDL pro-grams, including specific information about the laws in each state (go to Laws & Regulations, then State Law Facts). There is also a downloadable brochure about GDL, a list of commonly asked questions about GDL, and an excellent review of the topic (Graduated Licensing: A Blueprint for North Amer-ica).
4. National Safety Council (NSC) (www.nsc.org): the NSC has a publication (available for $10) titledTeen Driver: A Family Guide to Teen Driver Safety. This 68-page publication describes the science behind GDL recommendations and contains easy-to-understand advice for parents about setting limits and develop-ing a teenager-parent contract.
5. AAA Foundation for Traffic Safety (www. aaafoundation.org): the AAA Foundation sells a CD-ROM with an interactive driver-simulation program for use on a personal computer (Driver-Zed, $13). The teenaged driver gets a chance to practice identifying and reacting to a variety of dangerous on-road situations. Similar computer
simulation programs may be available from auto-mobile insurance companies.
6. Safe Young Drivers (www.safeyoungdrivers.com): this Web site is maintained by Phil Berardelli, who wrote the book Safe Young Drivers: A Guide for Parents and Teens. The book (approximately $12–$15) is orga-nized into 10 driving lessons with suggested drills and driving maneuvers to practice. The Web site has a long list of frequently asked questions about driver education.
7. Centers for Disease Control and Prevention (www. cdc.gov/ncipc): this site contains fact sheets and ref-erences about teenaged drivers and GDL. The Web-based Injury Statistics Query and Reporting System (WISQARS) can be used to find motor vehicle–re-lated mortality and injury data according to age, gender, state, and region.
8. Network of Employers for Traffic Safety (www.traf-ficsafety.org): the “Novice Driver Roadmap” (avail-able for $15) is a series of 8 practice drives, each with specific skills to be mastered. The program also con-tains information for the adult driving coach.
9. Substance Abuse and Mental Health Services Ad-ministration (www.samhsa.gov): the Children and Families section of the Web site contains informa-tion for parents about talking to teenagers about underaged drinking and impaired driving.
10. Daimler-Chrysler’s “Road Ready Teens” (www. roadreadyteens.org): the site contains a parent guide, teen quiz, and computerized teenaged driving contract that can be easily personalized and printed.
11. Ford’s “Driving Skills for Life” (www.realworlddriver. com): this Web site contains tips for parents and teen-agers as well as a short program of slides and videos that focuses on hazard recognition, vehicle handling, space management, and speed management.
12. Some individual states have Web sites that contain information about their GDL programs, license-ap-plication requirements, and driver training guides for parents.
DOI: 10.1542/peds.2006-2830
2006;118;2570
Pediatrics
Adolescence
Committee on Injury, Violence, and Poison Prevention and Committee on
The Teen Driver
Services
Updated Information &
http://pediatrics.aappublications.org/content/118/6/2570
including high resolution figures, can be found at:
References
http://pediatrics.aappublications.org/content/118/6/2570#BIBL
This article cites 59 articles, 5 of which you can access for free at:
Subspecialty Collections
icine_sub
http://www.aappublications.org/cgi/collection/adolescent_health:med Adolescent Health/Medicine
violence_and_poison_prevention
http://www.aappublications.org/cgi/collection/committee_on_injury_ Council on Injury, Violence, and Poison Prevention
following collection(s):
This article, along with others on similar topics, appears in the
Permissions & Licensing
http://www.aappublications.org/site/misc/Permissions.xhtml
in its entirety can be found online at:
Information about reproducing this article in parts (figures, tables) or
Reprints
http://www.aappublications.org/site/misc/reprints.xhtml
DOI: 10.1542/peds.2006-2830
2006;118;2570
Pediatrics
Adolescence
Committee on Injury, Violence, and Poison Prevention and Committee on
The Teen Driver
http://pediatrics.aappublications.org/content/118/6/2570
located on the World Wide Web at:
The online version of this article, along with updated information and services, is
by the American Academy of Pediatrics. All rights reserved. Print ISSN: 1073-0397.