Lincoln
University
Digital
Dissertation
Copyright
Statement
The
digital
copy
of
this
dissertation
is
protected
by
the
Copyright
Act
1994
(New
Zealand).
This
dissertation
may
be
consulted
by
you,
provided
you
comply
with
the
provisions
of
the
Act
and
the
following
conditions
of
use:
you
will
use
the
copy
only
for
the
purposes
of
research
or
private
study
you
will
recognise
the
author's
right
to
be
identified
as
the
author
of
the
dissertation
and
due
acknowledgement
will
be
made
to
the
author
where
appropriate
you
will
obtain
the
author's
permission
before
publishing
any
material
from
the
dissertation.
Urination Behaviour of Non-Lactating Dairy Cows in Late Gestation
Offered Fodder Beet and Kale Winter Forages
A Dissertation
submitted in partial fulfilment
of the requirements for the Degree of
Bachelor of Agricultural Science with Honours
at
Lincoln University
by
Lydia Jane Farrell
Abstract of a Dissertation submitted in partial fulfilment of the
requirements for the Degree of Bachelor of Agricultural Science with Honours.
Abstract
Urination Behaviour of Non-Lactating Dairy Cows in Late Gestation
Offered Fodder Beet and Kale Winter Forages
by
Lydia Jane Farrell
Prediction of nitrogen (N) leaching from urine events using modelling tools such as OVERSEER is
important for regulation of dairy farm outputs and practices. Risk of N leaching is greatest during
winter, particularly in systems which adopt high stocking densities such as those grazing fodder beet
and kale crops. However large prediction errors for leaching values from OVERSEER are recognised,
highlighting the need for more quantitative information on urination behaviour of dairy cows grazing
winter forages. The study was conducted at Ashley Dene research farm (-43.65 º North, 172.33 º East)
using 24 high producing Friesian x Jersey dairy cows fed two diets representative of industry practice.
Diet treatments were 10 kg DM of fodder beet with 5.6 kg DM of ryegrass baleage (FB) or 16.4 kg DM
of kale with 6.4kg of oat straw (KA) . All cows were fitted with a urine harness for 24 to 48 hours
which collected data on number, volume, and timing of urine events. Urine patch areas were
estimated using the urine harness data and a calibration curve of urine volume and wetted area in
the paddocks being grazed.
Urine volumes were similar (27.6 L/cow/day, p=0.988) though behaviour was affected by diet
whereby FB cows urinated less frequently (8.42 vs 10.1 events/cow/day for FB and KA respectively,
p=0.128) but with more volume per event than KA (3.58 vs 2.71 L/cow/day for FB and KA
respectively, p=0.04). On their own, similarity in total volumes (FB vs. KA) could not be explained by
intake of water (55 vs. 69 L/cow/day, p<0.001), N (237 vs. 472 g N/cow/day, p<0.001), DM (13.4 vs.
17.1 kg cow/day, p<0.001), potassium (2.7 vs. 2.9 g/cow/day, p=0.055) or sodium (0.53 vs. 0.40
g/cow/day, p<0.001). The urine patch areas on the FB grazing area were smaller at 0.16m2 than the
kale patches at 0.23m2 which is attributed to differences in paddock surface microtopography. The
smaller, more dense deposits of N in urine patches and the stocking rate being three times as great
compared with 82 kg/ha for the kale paddock. The results of this study provide new information
regarding the urination behaviour of the livestock and the N losses from winter grazing in New
Zealand systems. There is a need for more confidence in the measurement techniques used for
future studies.
Keywords: New Zealand, Canterbury, Brassica oleracea, Beta vulgaris, urine depositions, urine
Acknowledgements
I consider myself to be very privileged in having been able to undertake my degree and this project. I
am grateful to many people for these opportunities.
Firstly to Dr. Racheal Bryant for suggesting this project to me which I have found incredibly
interesting and I feel very proud to have been a part of. Also for her patience, guidance, and support
during this past year which has been invaluable to me.
Also to Dr. Grant Edwards and Dr. Keith Cameron for their input into this project.
To the Pastoral 21 program for funding this research.
Thank you to the staff from the Lincoln University Research Dairy Farm Jonathan Curtis and Jeff
Curtis for their help during the practical component of this project.
To the technicians at the Lincoln University Research Dairy Farm Sarah Taylor, Caleb Sixtus, Misato
Iitaka, and Hamish for their help during the planning, resourcing, practical, and sample analysis parts
of this project. Especially to Helen Hague for going the extra mile in ensuring I had everything I
needed to collect my data and for helping to get my samples analysed speedily.
To Khldoun Shatnawi for his help in the day to day tasks during the practical carrying out of this trial
which was incredibly helpful to me.
To Neil Smith for his help with the data loggers which enabled a far greater volume of data to be
collected than would have been otherwise. Also for his patience when teaching me to use them.
To Lincoln University for granting me a scholarship which has provided me with motivation over the
course of my degree as well as setting me up well for my future.
To the Te Hine Rangi Trust for granting me a research scholarship which provided financial security to
me this year.
To my partner Jordan and my friends without which my time at university would not have been
anywhere near as enjoyable and for helping me to keep my sanity during busy times this past year.
Lastly to my family and in particular to my parents Brett and Gayle for teaching me the value of hard
work and perseverance. Also for the opportunities they have given me over the course of my life and
Table of Contents
Abstract ... ii
Acknowledgements ... iv
Table of Contents ... v
List of Tables ... vii
List of Figures ... viii
List of Plates ... ix
Chapter 1 Introduction ... 1
Chapter 2 Literature Review... 3
2.1 Wintering Objectives ...3
2.2 Crop Systems ...3
2.2.1 Yield of Crops ... 4
2.2.2 Composition of Kale and Fodder Beet ... 4
2.3 Requirements of Non-Lactating Dairy Cows in Late Gestation in Winter ...5
2.3.1 Energy Requirement ... 5
2.3.2 Protein Requirement ... 6
2.3.3 Mineral Requirement ... 6
2.3.4 Water Requirement ... 6
2.4 Factors Affecting N Leaching ...7
2.4.1 Urine Patch Dynamics ... 7
2.4.2 Factors Affecting Urine Volume ... 9
2.4.3 Urination N Content ...10
2.4.4 The Volume of Nitrate Leached ...11
2.4.5 Seasonal Changes and Climatic Conditions ...11
2.4.6 Soil Profile and drainage ...12
2.4.7 Land Use ...12
2.5 Regulation of N Losses from Dairy Farms ... 13
2.5.1 Consequences of Nitrate Leaching...13
2.5.2 Regulations and Use of OVERSEER ...13
2.6 Current Data on Urine Volumes ... 14
2.6.1 Urination Volume and Frequency ...15
Chapter 3 Materials and Methods ... 16
3.1 Experimental site and design ... 16
3.2 Animals and Management ... 17
3.3 Sample Analysis ... 19
3.3.1 Dietary Composition Analysis ...19
3.3.2 Urine Composition Analysis ...19
3.3.3 Faecal Measurements and Composition Analysis ...20
3.4 Urine Volume and Frequency ... 20
3.4.1 Harness Validation Measurements ...21
3.5 Urine Patch Area ... 21
3.6 Calculations of Leaching Loss ... 22
Chapter 4 Results ... 25
4.1 Climatic Conditions ... 25
4.2 Diet Composition ... 26
4.3 Apparent Animal Dietary Intake ... 26
4.4 Urinary Behaviour ... 27
4.5 Animal Samples ... 28
4.6 Water and N Balance ... 28
4.7 Urine Patch Coverage ... 29
4.8 Estimation of Paddock N Losses ... 30
Chapter 5 Discussion ... 32
5.1 Total Urine Output ... 32
5.2 Soil N loading ... 34
5.3 Conclusions ... 39
Appendices ... 40
Appendix A Urination Behaviour of non-lactating dairy cows grazing winter forages fodder beet and kale in situ ... 40
List of Tables
Table 2.1 Nutritional composition of fodder beet and kale obtained from various trials at Ashley Dene Research Farm from 2010 to 2013. ... 5 Table 4.1 Nutrient and mineral composition (g/kg dry matter unless otherwise stated) of kale and
fodder beet and supplements ...26 Table 4.2 Apparent dietary intake of non-lactating dairy cows in late gestation (per cow per
day) ...27 Table 4.3 Urination behaviour of non-lactating dairy cows in late gestation fed fodder beet and
kale based diets obtained using a urine harness ...27 Table 4.4 Composition of dung and urine of non-lactating dairy cows in late gestation with winter
diets based on fodder beet and kale forages ...28 Table 4.5 N balance of non-lactating dairy cows in late gestation fed winter diets based on fodder
beet and kale forages. All values in grams ...29 Table 4.6 Water balance of non-lactating dairy cows in late gestation fed winter diets based on
fodder beet and kale forages. All values in litres ...29 Table 4.7 Winter forage fodder beet and kale paddock urine patch coverage grazed in situ by
non-lactating dairy cows in late gestation ...30 Table 4.8 Estimated paddock N (nitrogen) leaching losses from fodder beet and kale winter forage
List of Figures
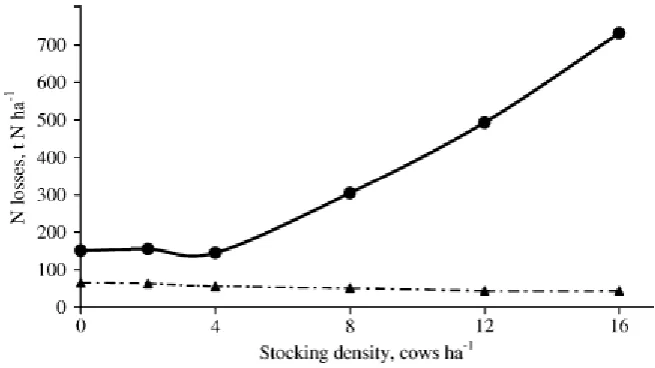
Figure 2.1 Annual losses per hectare of pasture with increasing stocking rate of dairy cows.
Modelling by McGechan & Topp (2004). ... 8 Figure 2.2 The incidence of single and double urine patch areas with increasing stocking rate of
dairy cows on pasture (Pleasants et al., 2007). ... 8 Figure 2.3 Annual dairy cow grazing hours on paddock vs. proportion of paddock covered in
patches r2=0.77 (Moir et al., 2011). ... 9 Figure 2.4 Conceptual model of N inputs and outputs for the potentially leachable N pool (Di &
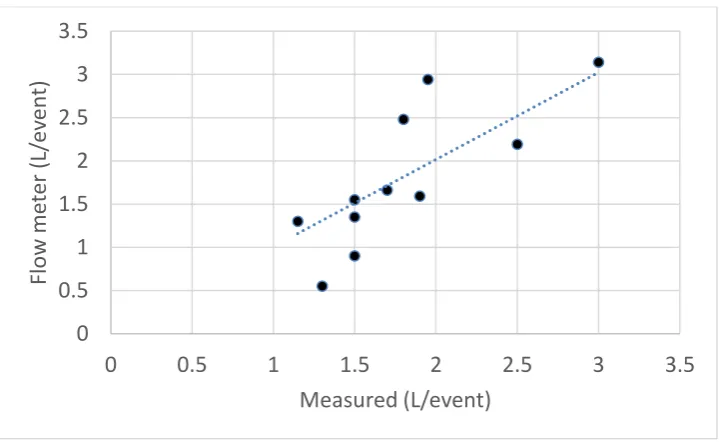
Cameron, 2000). ...11 Figure 2.5 Modelled N leaching losses from various farm blocks (Chrystal et al., 2012). ...13 Figure 3.1 Quadratic regression of measured versus flow meter volumes from urine events.
Regression y = 1.0075x, r-sq = 0.61, standard error of the estimate = 0.512……….. 21 Figure 4.1 Maximum and minimum temperatures during the experimental period ...25 Figure 4.2 Rainfall and wind speed during the experimental period ...25 Figure 4.3 Calibration of urine volumes and wetted patch area for urine volumes deposited on
areas in paddocks of fodder beet and kale grazed in situ………. 30 Figure 5.1 Factors influencing N leaching from grazed agricultural systems. (Li et al., 2012). ...35 Figure 5.2 Variation in urine nitrogen content of dairy cows (Betteridge et al., 2013) ...36 Figure 5.3 Area and volume of soil affected by a urine event. Solid lines indicate wetted area
(radius=rw) and and dashed lines represent the area of pasture responding (radius=rp).
List of Plates
Plate 3.1 Site Map ...17 Plate 3.2 Cows in kale treatment wearing urine harnesses consuming supplemented oat straw…18 Plate 3.3 Cows in fodder beet treatment consuming forage ration. ...18 Plate 3.4 Diagram of trial pen set up ...19 Plate 3.5 Urine harness attached to a cow (Ravera et al., 2015). ...20 Plate 3.6 Urine patches of dairy cows grazing winter forages in situ. A and B in the fodder beet
Chapter 1
Introduction
New Zealand dairy farmers, especially those in cooler regions such as the South Island, face a major
challenge over winter in growing sufficient pasture to meet the energy requirement of the livestock
in late gestation (Dalley, 2011). Farmers aim to put body condition on livestock during the period
before calving to maximise reproductive performance and therefore overall farm productivity
(Edwards et al., 2014). Pasture growth rates in Canterbury over this period range from 0 to 15 kg of
dry matter (DM) per day (DairyNZ, 2010) which does not provide adequate nutrition for the typical
stocking rates and energy requirements of cows (DairyNZ, 2014; Mandok et al., 2013). It is common
practice for dairy cows to graze winter forages such as kale (Brassica oleracea) and fodder beet (Beta
vulgaris) in situ off the milking platform as these crops provide high quality and quantity of feed over
the entire winter period (Brown et al., 2007; Rugoho et al., 2014).
The low nitrogen (N) requirement of dairy cows in winter relative to the dietary N intake results in
excess N being excreted largely in the cow urine which is deposited onto the soil surface at N rates
equivalent to 800 - 1300 kg/ha(Eckard et al., 2010; Laubach et al., 2014). The urine from grazing
livestock is the main driver of N leaching on dairy farms (de klein et al., 2010) and grazing of winter
forages in situ results in a high density of urine patches across the paddock due to the high stocking
rates able to be fed on this area (Judson & Edwards, 2008; Pleasants et al., 2007). Consequently the
leaching from winter forage grazing by dairy cows accounts for up to 24% of the whole farms annual
leaching losses despite representing only up to 9% of the farm area (Chrystal et al., 2012).
N from agriculture leached in the form of nitrate into ground and surface water has negative
implications for the environment and human and livestock health (Cameron et al., 2002). Current
and forthcoming policies seek to regulate and limit the nutrient losses from farms particularly
leached N (Williams et al., 2014). This will be achieved with use of modelling software such as
OVERSEER which use knowledge of farm inputs and systems processes to predict N losses on an area
basis. However incomplete knowledge regarding the processes in grazing systems results in
assumptions being used in the models which limits their ability to accurately predict N leaching
losses (Cichota & Snow, 2009). Therefore further data is needed regarding N leaching from pastoral
farming including from wintering platforms.
For a given soil type and climate it is the N content of urine, the volume of urine deposited, and the
al., 2012). There is a need for further knowledge regarding the urination behaviour of dairy cattle as
models currently use average values (Cichota & Snow, 2009) of which there are few from dairy cows
in New Zealand pastoral systems. The daily urination volume is highly variable ranging from 8.7 to
54.7L (Ravera et al., 2015; Betteridge et al., 1986). Average volumes for urine events have averaged
2-3L (Ravera et al., 2015; Betteridge et al., 2013) and frequency of urination has a large range of 2 to
73 daily events (Betteridge et al., 1986; Betteridge et al., 2013; Ravera et al., 2015; Jenkinson et al.,
2014). The wetted area of the paddock surface resulting from a given volume of urine has been
found to differ when falling on the surface of the grazing area of dairy cows grazing kale and fodder
beet winter forages influencing the concentration of N deposited (Ravera et al., 2015). The volume
of urination from dairy cows is influenced by diet DM and crude protein (CP) levels as well as intake
of water, sodium (Na), and potassium (K) (Bannick et al., 1999; Khelil-Arfa et al., 2012; Holter &
Urban, 1992). The objective of the current research was to provide quantitative information on
Chapter 2
Literature Review
2.1
Wintering Objectives
New Zealand dairy farmers, especially those in cooler regions such as the South Island, face a major
challenge over winter in growing sufficient pasture to meet the energy requirement of the livestock
in late gestation (Dalley, 2011). Farmers aim to put condition on their livestock during the period
before calving (Edwards et al., 2014). A lower body condition score (BCS) at calving by 1 unit has
been found to extend the post calving anoestrus interval by 7 to 10 days (McDougall et al., 1995)
which would have an effect on the animals’ reproductive performance and therefore overall farm
productivity. A BCS of 5 at calving is desirable (Judson & Edwards, 2008) thus the energy
requirement of dry, pregnant cows putting on condition is 75 MJ ME/day (ARC, 1980) which results
in a minimum daily DM requirement of 7 kg DM. Mandok et al. (2013) argued that in New Zealand’s
outdoor grazing systems, ME requirement were greater than those reported by ARC and that winter
requirement are likely to be closer to 100 MJ ME/d. Given that the average stocking rate in the
South Island is 3.04 cows per hectare (DairyNZ, 2014) this would require a pasture growth rate of at
least 21 kg DM/ha/day. Pasture growth rates range between 0 and 15 kg DM/ha (DairyNZ, 2010)
during this period and grazing cows on heavy soils results in pugging and reduced long-term pasture
growth rates. Subsequently in situ grazing of brassica crops over winter off of the milking platform is
a common strategy to mitigate this problem though housing cows over winter is has increased in
frequency of use in the South Island to mitigate the environmental effects of wintering cows
(Chrystal et al., 2012).
2.2
Crop Systems
Kale has been widely used in Canterbury as a winter forage crop for dairy systems due to its high DM
yield and quality relative to that of pasture (Brown et al., 2007; Rugoho et al., 2014). Brassica crops
have the advantage of growing and accumulating DM with a base temperature of 0⁰C (de Ruiter et
al., 2009). Kale crops have been identified to supply 12 MJ ME/kg DM where the quality does not
experience much decline over the winter period as the plant matures (Judson & Edwards, 2008).
Alternative forages have been proposed, such as fodder beet, with the aim of better aiding the cows
to regain their body condition than kale (Greenwood et al. 2011; Rugoho et al. 2014). A suggested
major factor in the varying ability of kale to put sufficient condition on dairy cows is the utilisation of
to vary from 40 to 90% on commercial farms in the South Island which affected the cows’ ability to
consume the target mass of feed and was likely due to inaccuracies in crop allocation. The winter
forage crops are often break fed and supplemented with a conserved feed such as straw and baleage
to maintain the fibre level in the feed and to modify feed intake rate and behaviour (Judson &
Edwards, 2008).
2.2.1
Yield of Crops
Fodder beet is a high yielding crop which produces between 11 and 32.8 t DM/ha (Goh & Magat
1989; Chakwizira et al., 2012). The fodder beet cultivar ‘Rivage’ was grown at the Ashley Dene
Research Farm in 2012 and 2013 yielding 18.5 and 21.8 t DM/ha respectively (Edwards et al., 2014).
At the same time, kale was also grown on Ashley Dene Research Farm and yielded an average of
14.6 t DM/ha which is in the expected range for the majority of kale grown in Canterbury of 10 to 16
t DM/ha (Judson & Edwards, 2008). Major factors determining the yield of the crop are the sowing
date, cultivar, and location (soil and climate). Edwards et al. (2014) showed fodder beet to be more
efficient in its use of N fertiliser with more than double the yield of feed per kg of N fertiliser applied
compared with kale at 99 and 44.9 kg DM/kg N respectively. Fodder beet was effectively eaten by
cows achieving 99.5% utilisation, 10% higher than was achieved for kale in the same study. Both kale
and fodder beet are relatively low cost feeds to grow at 9-11 c/kg DM for fodder beet and 12.6 c/kg
DM for kale (de Ruiter et al 2007; DLF Seeds, n.d.; Gibbs, 2011).
2.2.2
Composition of Kale and Fodder Beet
The two crops have similar energy content at 12.2-13.5 MJ ME/kg DM (table 2.1), though the CP and
fibre content of kale is greater than that of fodder beet. The forages have similar digestibility at
80-85 g/100g DM. Fodder beet mineral content was analysed across sites in the South Island and
seasons by Gibbs (2011) where calcium (Ca) content was determined to be 0.35% DM. K content has
been identified at 9.7 g/kg DM and Na at 1.1 g/kg DM (Chakwizira et al., 2013). Kale Ca levels are in
the range of 20 to 40 g/kg DM, magnesium (Mg) at 1-7 g/kg DM, Na at 1 g/kg DM, and K at 17-50
g/kg DM (Nutrimix, n.d.; de Ruiter et al., 2009). Water content is greater in kale though the variation
in DM content, CP and fibre are often compensated for by the type and amount of supplement fed,
Table 2.1 Nutritional composition of fodder beet and kale obtained from various trials at Ashley Dene Research Farm from 2010 to 2013.
Fodder Beet Kale
Edwards et al., (2014)
Jenkinson et al., (2014)
Edwards et al., (2014)
Miller et al., (2012)
Jenkinson et al., (2014)
Rugoho et al. (2010)
DM% 16.5 14.0 14 11.5 11.1
ME (MJ/kg DM) 12.2 12.8 12.8 13.5 13.1 12.3
N (%DM) 1.7 1.7 2.0 2.2 2.2 -
CP %DM 10.6 10.9 12.6 - 13.8 19.1
NDF (%DM) 20.6 17.1 26.3 26.0 26.7 28.6
ADF (%DM) - 10.4 - 21.0 20.9 22.5
DOMD (g/100g DM) - 80.3 - 85.1 81.7 -
DM=dry matter, ME= metabolisable energy, N=nitrogen, CP=crude protein, NDF=neutral detergent fibre, ADF=acid detergent fibre, DOMD=digestible organic matter.
2.3
Requirements of Non-Lactating Dairy Cows in Late Gestation in Winter
2.3.1
Energy Requirement
Non-lactating dairy cows in late gestation grazing winter forages require energy from their diet to
meet their needs for maintenance with a low activity level, for the gain in liveweight associated with
their increasing BCS, and to support gestation. Roche et al. (2005) determined the energy
requirement of cows in late gestation to be 1.05 MJ ME/kg LWT0.75/daywhich for a 510 kg cow
gaining condition during the winter period resulted in a daily energy requirement of 127 and 129 MJ
ME for cows grazing kale and fodder beet respectively. Studies have highlighted the disparity
between the energy requirement of non-lactating dairy cows in late gestation, their energy intakes,
and their performance (Edwards et al., 2014; Greenwood et al., 2011). Where the estimated daily
energy requirement to enable cows to reach performance targets have been up to 44 MJME lower
than their apparent intakes. This could be due to underestimations in energy requirement for
maintenance and liveweight gain (Roche et al., 2005; Mandok et al., 2013), higher intake to meet
metabolisable protein demands on forages with low CP content (Westwood & Mulcock, 2012) at
12.6 and 10.6% DM for kale and fodder beet respectively (Edwards et al., 2014), and/or the
consumption of anti-nutritional compounds such as S-methylcysteine sulphoxide in the kale which
can limit performance (Barry & Manley, 1985). It is also possible that the energy supply of the feed is
overestimated due to the negative effect that high intake and the cold environment can have on the
digestibility of the feed not having been taken into account (Mairon & Christopherson, 1992).
Edwards et al. (2014) determined apparent intake of non-lactating dairy cows in late gestation to be
13.1 kg DM for cows fed fodder beet and ryegrass baleage and 14.2 kg DM for cows fed kale and oat
straw. The daily intake of cows fed kale and oat straw was similar to that determined by Miller et al.
content of the forages at 26.3% DM for the kale crop and 20.6% DM for the fodder beet crop. The
relatively low fibre content of the forages increased the intake as there was less physical limitation
due to gut fill (Mertens, 1994). This intake led to energy intakes of 168 and 155 MJ ME/kg DM for
cows in the kale and fodder beet treatments respectively.
2.3.2
Protein Requirement
A major inefficiency regarding N in pastoral dairy systems is the greater N requirement of plants for
optimum growth relative to the lower dietary N requirement of grazing livestock (Ledgard et al.,
2000). Dairy cattle have a minimum requirement for N in their diet which, if not met, can limit
production which is 1.8% of DM and is greater for young/lactating or growing cattle at 3 and 2.2% of
DM respectively (Pacheco & Waghorn, 2008). A large (675kg) non-lactating dairy cow in late
gestation requires CP in her diet as 12% of DM (Merck Manuals, 2014) equating to 1.92% DM as N.
Kale forage supplies 2 to 2.2% DM as N (Miller et al., 2012) and fodder beet supplies 1.7% DM as N
(Edwards et al., 2014; Jenkinson et al., 2014). Any imbalance between the animal requirement and
forage content of N causes large amounts of N to be excreted (Eckard et al., 2010). Laubach et al.
(2013) identified that 88.5% of the ingested N was excreted of which 68.8% of that was in urine. N
intake of 400 g/day is the critical point above which the urinary N output increases exponentially
with increasing N intake (Castillo et al., 2000). Kebreab et al. (2001) identified that increasing N
content in the feed results in greater N concentrations in urine. Faecal N output increases with a
constant gradient of around 7.5 g N per 1kg DM of feed ingested (Castillo et al., 2000).
2.3.3
Mineral Requirement
The demands of livestock for minerals are greater for higher producing animals however they are
fairly consistent on a per kg DM of feed basis where changes in feed intake provide the correct level
of minerals in the diet (Sykes, n.d.). Lactating 500 kg dairy cows producing 10 to 30L of milk daily
require Ca and Mg in the order of 3.2 and 0.8-1.4 g/kg DM respectively (Grace, Knowles, & Sykes,
2010). The mineral requirement of a large (675 kg) dairy cow in late gestation are 0.48, 0.40, 0.14,
and 0.62% DM for Ca, Mg, Na, and K respectively (Merck Manuals, 2014). Dairy cattle in late
gestation have a requirement for Ca in the diet of less than 60 g/kg DM where a greater supply can
restrict the cows’ ability to mobilise Ca reserves post calving (de Ruiter et al., 2009).
2.3.4
Water Requirement
Although water provides no energy to an animal, it is a vital part of their diet and makes up 60% of
their mass (Keenan, 1988). Water is essential to dairy cows for all of their life processes including
pressure in cells and tissues (Khelil-Arfa et al., 2012). Water is constantly lost from the body and
must be replenished in order to maintain hydration. Water enters the body through direct
consumption during drinking from a water source such as troughs, as well as indirectly through
water in feed and water produced during metabolic processes and the oxidation of nutrients. Daily
water intake is highly variable in dry cows and was found by Paquay et al., (1970a) to range from
8-64 L. Water intake has been found to be affected by ambient temperature as a behavioural regulator
of water consumption when it exceeds 27⁰C (Senn et al., 1996). It is expected that at ambient
temperatures outside cows thermal neutral zone of -5 to 21⁰C (Meyer et al., 2004) thermoregulatory
processes such as shivering and sweating would be activated which would alter the body’s water
usage. Feed moisture content is well correlated with daily water intake (r2=0.87) and intake of a diet
with 13.5-20% DM will result in a water intake of 5.5 kg for each additional kg of DM consumed
(Parquay et al., 1970b).
2.4
Factors Affecting N Leaching
2.4.1
Urine Patch Dynamics
It is the excess dietary N supplied to livestock which results in urine patches depositing N in
concentrations of 800-1300 kg/ha (Eckard et al., 2010) of which 8 to 20% is leached (Cameron et al.,
2002). Typically the major driver of N leaching on dairy forms is urine from grazing animals rather
than applications of fertiliser or effluent (de Klein et al., 2010). The effects of N fertiliser use on N
losses are indirect in that increased use of N fertiliser results in greater pasture production and
therefore stocking rates incurring greater deposits of N in concentrated form (figure 2.1). It has been
proposed that grazing forages with elevated levels of condensed tannins and water soluble
carbohydrates to lower urinary N concentration (Waghorn et al., 2007; Woodward et al., 2004).
However species which would achieve this such as Lotus corniculatus and Lotus pedunculatus are not
suitable as winter forages as they do not yield the same quantity of feed as currently used crops
such as kale (Miller et al., 2012). There is potential to supplement a winter forage diet based on
grazing kale with conserved feed with elevated levels of condensed tannins (Miller et al., 2012;
Figure 2.1 Annual losses per hectare of pasture with increasing stocking rate of dairy cows. Modelling by McGechan & Topp (2004).
For a given soil type and climate it is the N content of urine, the volume of urine deposited, and the
timing of urine deposit that determines the level of nitrate leached from pastoral dairy farms
(Romera et al., 2012). Urine is deposited unevenly across a paddock in patches (Di & Cameron, 2002)
with frequencies of deposition which are greater in some areas such as gateways in pastoral dairy
farming (Matthew et al., 1988; McDowell, 2006). The patches have been found to overlap (figure
2.2) which has been suggested by modelling to have the effect such that a double urine patch would
leach three times the N as a single patch (Shorten & Pleasants, 2007).
The paddock coverage of urine patches depends on the type of animal grazing and the stocking rate
(Pleasants et al., 2007). Cattle urine patches of a 2 L volume covering an area of 0.38 - 0.42 m2 have
been found to penetrate to a depth of 400 mm where 11% of the N applied in the urine patch was
leached (Williams & Haynes, 1994). Romera et al. (2012) determined that 8% of a pasture paddock
area grazed by dairy cattle was covered in multiple urine patches where 39% of the total urine
volume was deposited on overlapping patch areas. On a typical pastoral dairy farm 85% of the urine
patches are deposited in the paddock with the remainder on raceways and cattle yards (Draganova
et al., 2012). Moir et al. (2011) identified that an increase of 10,000 grazing hours/ha/year results in
a 33% increase in the surface area of the paddock covered in urine patches annually (figure 2.3).
Where 5 days of 300 to 400 cows grazing a paddock equates to more than 6000 grazing hours.
Figure 2.3 Annual dairy cow grazing hours on paddock vs. proportion of paddock covered in patches r2=0.77 (Moir et al., 2011).
2.4.2
Factors Affecting Urine Volume
2.4.2.1 Water Loss
In dry dairy cows the majority of water loss from the body is in the form of urine as well as being
excreted in faeces and evaporated from body surfaces including the skin and respiratory passages
(Frandson et al., 2006). Losses in faecal matter have been found to be between 4 and 30 kg/day
which can be affected by dietary crude fibre (r=0.50) (Parquay et al., 1970b). It was also found that
the water loss in the form of faeces is also influenced by the water content of feed (r=0.52),
congruous with the findings of Holter and Urban (1992). Moisture losses through saliva and sweat
Holter and Urban (1992). Church et al. (1988) observed that losses of water from respiratory
passages as a result of inspired oxygen is influenced by ambient temperature.
2.4.2.2 Urine in Cows
The kidneys regulate the body’s water, PH, and electrolyte balance through adjusting the
composition and volume of urine which is formed there. This occurs in response to changes in
metabolism or intake of feed and water (Frandson et al., 2006). Therefore the volume of urine
excreted depends on the level of fluid and minerals needing to be expelled from the body. Animals
fed a diet with a greater CP content consume more water and therefore will excrete a greater
volume of water in their urine (Bannik et al., 1999). Khelil-Arfa et al. (2012) found that the feed CP
content was well correlated to urine output (r2=0.77) were is was the major determining factor in
the volume of urine excreted. Holter and Urban (1992) found that dietary CP was very strongly
correlated to urinary output volume (r2=0.92) with DM intake and feed DM content also being
significant factors. Urine production is also affected by the levels of Na and K that are ingested
(Bannick et al., 1999). The volume of urinary output has been found to vary from 1.1 to 32.8 kg per
day in non-lactating dairy cows and is the greatest contributor to urea excretion (Parquay et al.,
1970b) and to daily water loss (Parquay et al., 1970a).
2.4.3
Urination N Content
The urine N concentrations have been identified to be lower for cows grazing kale and fodder beet
as a winter forage crop at 2.3 to 4.0 g N/L (Miller et al., 2012; Ravera et al., 2015) than
concentrations measured for cows grazing traditional pastures of ryegrass and white clover at 5.7 g
N/L (Totty et al., 2013) and 6.1 g N/L (Edwards et al., 2015). The lower N content in the urine is
suggested to be due to the greater water content of the kale diet resulting in a diluting effect
(Ledgard et al., 2007) and the lower N content of the diet. Urinary N levels of grazing dairy cows
were found to average 9.5 g N/L ranging between 1.2 and 24.7 g N/L (Betteridege et al., 2013).
Jenkinson et al. (2014) identified that although the total N intakes of non-lactating dairy cows in late
gestation were significantly different at 289 g/kg DM for those fed kale and 228 g/kg DM for those
fed fodder beet winter forages where total DM intake was similar, the urinary (at 2.2 g N/L for both
treatments) and faecal (at 2.1% of DM for both treatments) N contents were not significantly
different. This agrees with the findings of Edwards et al. (2014) that urinary N content did not
2.4.4
The Volume of Nitrate Leached
The conditions most favouring heavy N leaching are a high level of N in the form of nitrate in the soil
followed by or coinciding with a period of heavy drainage through the soil. Nitrate is readily leached
when there is drainage as it is negatively charged so is repelled by the clay content of soils in
temperate regions (Di and Cameron, 2002). Therefore the major determinants of the degree of N
leaching are the level of N accumulated in the soil which is a result of numerous factors (figure 2.4)
and the degree of drainage through the soil occurring (Cameron, Di, & Moir, 2013). Major factors
contributing to the level of N leaching include land use season, climate, and the soil properties.
Figure 2.4 Conceptual model of N inputs and outputs for the potentially leachable N pool (Di & Cameron, 2000).
2.4.5
Seasonal Changes and Climatic Conditions
The majority of nitrate leaching occurs during late autumn, winter, and early spring for many areas
of New Zealand largely due to the rate of evapotranspiration being exceeded by the rate of moisture
deposition due to rainfall. This results in nitrate being leached when coinciding with the soil being at
or near field capacity (McLaren and Cameron, 1996). These times of year are generally when the
temperatures and therefore plant growth are low leading to reduced nitrate uptake by plants. The
nitrate levels then build up in the soil which, in conjunction with high rainfall and drainage, causes
2.4.6
Soil Profile and drainage
The rate at which water drains through the soil directly is determined by the soil’s texture and
structure and affects the level of N leached which is greater in soils with more drainage (McLaren
and Cameron, 1996). At greater rates of drainage less Nis removed from the soil solution through
denitrification, immobilisation, and plant uptake (Cameron et al., 2002). N leaching occurs more
quickly in lighter sandy soils as they have a lower field capacity than clay and silt loam soils (Cameron
et al., 2002). Drainage is also influenced by the soils’ porosity which is increased by earthworms,
plant roots, or wetting and drying cycles (Cameron et al., 2013). Water movement through the soil
profile is also increased by artificial agricultural drainage systems which have been found to increase
N leaching. For example a paddock with molepipe drainage in a continuously grazed beef system had
consistently 70 kg N/ha/yr greater leaching than a similar paddock without artificial drainage
(Schofield et al., 1993).
2.4.7
Land Use
Land use intensification typically increases N leaching (McLaren and Cameron, 1996) as the total
level of N inputs increases the risk of N leaching increases exponentially regardless of the type of N
input (de Klein et al., 2010). Intensively grazed systems such as New Zealand pastoral dairy farms
have relatively high N leaching levels due to high stocking rates and large N fertiliser inputs. Dairying
systems with fertiliser inputs of 360 kg N/ha/yr are highly intensive uses of land which can leach up
to 110 kg N/ha/yr. Grazing winter forages in situ contributes a disproportionate amount to the
farm’s total N leaching profile. The high level of N leaching over winter is due to high stocking rates
causing a dense deposition of urine patches, low temperatures leading to low plant growth rates,
and the use of intense soil drainage systems (Dalley, 2011). The high yielding forage crops such as
kale and fodder beet are typically break fed with high stock numbers to harvest the forage resulting
in dense stock numbers on small area (Judson & Edwards, 2008). Although winter grazing represents
only 4 to 9% of the total farm system area, it is responsible for 11 to 24% of the farm’s total N losses
through leaching as displayed in figure 2.5 (Chrystal et al., 2012). A trial (Chrystal et al., 2012)
modelled six farm systems determining that the nitrate leaching losses for a typical farm system in
which stock graze winter forages over the entire dry period are the greatest. It was identified that
the winter grazing leached around 58 kg N/ha/year which was more than twice the level of the 23 kg
N/ha/year leached from main farm block. All of the systems in which stock grazed winter forages
followed the same pattern in that the leaching during the winter period was twice that of the home
Figure 2.5 Modelled N leaching losses from various farm blocks (Chrystal et al., 2012).
2.5
Regulation of N Losses from Dairy Farms
2.5.1
Consequences of Nitrate Leaching
N leaching in the form of nitrate (N03-)from agricultural systems increases the nitrate levels in
ground and surface waters which poses a threat to its quality for wildlife, recreation, and human
consumption (Cameron et al., 2002). Elevated nitrate levels in drinking water are considered to be
especially harmful to the health of infants as it can lead to the disorder methaemoglobinaemia
which interferes with the oxygen carrying capacity of the blood (Cameron et al., 2002). Levels of
greater than 40-100 mg NO3- /L are considered to the potentially dangerous to livestock for which it
can cause abortions and methaemoglobinaemia in cattle (Di and Cameron, 2002). Nitrate leached
into waterways such as rivers, estuaries, and lakes can cause environmental damage due largely to
its contribution to eutrophication where algae blooms excessively at the expense of aquatic life (Di
and Cameron, 2002).
2.5.2
Regulations and Use of OVERSEER
The National Policy Statement for Freshwater Management came into effect July 1st 2011 mandating
This was in response to agricultural N leaching losses hence these regional authorities are
developing plans to manage water quality and reduce nutrient levels in surface and groundwater
with particular focus on N and leaching from agricultural sources (Williams et al., 2013). The plans
aim to regulate nutrient losses rather than limiting inputs which presents a challenge as losses are
more difficult to monitor and quantify (Williams et al., 2013). Environment Canterbury, Otago
Regional Council, Environment Southland, Waikato Regional Council, and Environment Bay of Plenty
currently specify using OVERSEER to estimate nutrient losses from agricultural properties (Williams
et al., 2013). The initial purpose of OVERSEER was to aid fertiliser and nutrient management on
pastoral farms (Cichota & Snow, 2009; Williams et al., 2013) however it has undergone further
development to evaluate farming systems, their nutrient losses, and environmental effects (Cichota
& Snow, 2009). Empirical relationships, readily available data from “existing” farms, and internal
databases are used in the OVERSEER model to estimate paddock nutrient inputs and outputs and
present them as a nutrient budget (Cichota & Snow, 2009). It is therefore well suited to New Zealand
environmental conditions and management practices and requires minimal inputs of data that are
easily obtained by the farmer and are significant aspects of a farming system (Cichota & Snow, 2009;
Williams et al., 2013). Incomplete knowledge of how natural processes and systems occur produces
the need for assumptions to be used in models which results in them having limitations hence
models should be considered as only simplified descriptions of natural processes. Although models
have a large degree of uncertainty, they are continually updated with improving knowledge of the
processes and systems involved which improves reliability (Cichota & Snow, 2009). There is a need
for further knowledge regarding the urination behaviour of dairy cattle as models currently use
average values (Cichota & Snow, 2009) of which there are few from dairy cows in New Zealand
pastoral systems and grazing winter forages in situ.
2.6
Current Data on Urine Volumes
There is a large degree of variability of the urination behaviour of dairy cows hence most of the
models used to describe N cycling in a farming system use average values (Cichota & Snow, 2009).
The urination events of dairy cows varies greatly in terms of their frequency, volume, and
concentration of N and there is currently limited data available to quantify the frequency and
volume variables. The majority of the published information on urination behaviour has been
2.6.1
Urination Volume and Frequency
A study conducted on grazing steers (Betteridge et al., 1986) found that urination behaviour over a
24 hr period varied greatly. Frequency varied from 13 to 73 times and total daily urination volume
ranged from 5.8 to 54.7 L. Betteridge et al., (2013) found that the average volume of a single
urination of a grazing dairy cow was 2.1 L ranging from 0.3 to 7.83 L per urination. Villettaz
Robichaud et al., (2011) and Aland et al. (2002) found the number of urination events over 24 hrs for
housed dairy cows to have a large range of 7 and 3 to 19 averaging 9.3 events per day. Similarly
Castle et al. (1950) reported urination frequency to be 9.8 for grazing dairy cows. Other studies have
found the number of urination events per cow per day to average around 14 (McLeod et al., 2009;
Draganova et al., 2010). Jenkinson et al. (2014) determined grazing dry cows in late gestation
grazing either kale or fodder beet to not have significantly different urination behaviour with similar
urination frequency per cow in a six hour period (an equivalent of 10.2 and 11.6 events/day
respectively) and duration of each event (9.3 and 8.9 seconds respectively).
Ravera et al. (2015) studied the urination behaviour of pregnant dry dairy cows grazing kale and
fodder beet over winter using a urine harness. The frequency of urination events ranged from 8 to
21 events per day for cows grazing kale where cows grazing fodder beet was lower ranging from 3 to
11 events. The total daily urine output for cows grazing kale was greater ranging from 19.2 to 47.3 L
and ranging from 8.7 to 25.2 L for cows grazing fodder beet. The average volume for a single urine
event was similar for both treatments at 2.37 L and this varied from events less than 0.5 L and those
up to 8.6L. The events of larger volume (above 5 L) were found to occur between 0600 and 0730 hrs
or between 2200 and 0000 hrs. There was great variability between individual cows in the groups
grazing each treatment with low replicate numbers (5 for kale and 8 for fodder beet) hence
identifying significant differences between the urinary behaviour of cows in each group was difficult.
The urine patch area in the paddock was investigated for each forage crop where patches were
smaller for fodder beet (area=0.109*volume) for a given urine volume compared with patches in the
kale paddock (area=0.190*volume). The trial found the average volume for a single urine event to be
2.37 L for both treatments which would result in a urine patch area of 0.47 m2 on a kale paddock and
0.25 m2 on the fodder beet paddock. The paddock leaching loss estimations were 77.82 kg/ha/yr for
the fodder beet paddock and 53.79 kg/ha/yr for the kale paddock. However, the study by Ravera et
al. (2015) represents only a single year and a small sample size. More data is required to gain
Chapter 3
Materials and Methods
3.1
Experimental site and design
The experiment was conducted at the Lincoln University Ashley Dene research farm (-43.65 º North,
172.33 º East) with the approval of the Lincoln University Animal Ethics committee (#620) from the
23rd of June to the 18th of July 2015. The soil type was Lismore/ Balmoral shallow stony loam soil
structure. The site was converted from dryland pasture to irrigated dairy support land in 2011.
The experiment was a cross-sectional study in a randomised complete block design to determine the
effect of diet on urine volume and frequency of dairy cows in late gestation. The trial was repeated
over 4 weeks with each week acting as a temporal block and 8 animals used each time totalling 32
cows. Animals for this trial were selected from an existing winter feed trial where cows had already
adjusted to the treatment diet for over a month. The winter feed trial had 50 pregnant,
non-lactating, spring calving, Friesian x Jersey cows from the Lincoln University Research Dairy Farm in
each treatment which were blocked according to calving date, BCS, liveweight, age, and breeding
value. The two treatments in this study were either a kale or fodder beet winter system. These
treatments were chosen as representative of current industry practices. Cows for the trial in this
study were selected (from cows in paddocks 1, 3, 7, and 10) using restricted randomisation as the
sample size was relatively small (n = 12) and urine volumes are known to have large between-cow
variability (Ravera et al. 2015). Consequently animals of similar liveweight and days since
conception were used.
For each block the pen layout was the same but a new area in the paddock was set up at the end of
each week. The dates during which each repetition was completed were: the 23rd to the 26th of
June, 31st of June to 3rd of July, the 6th to the 10th of July, and the 15th to the 18th of July. These dates
were chosen due to being largely during the week when various technicians and resources were
available. They also best afforded the opportunity to obtain 48 hrs of data from each subject. The
first 3 weeks used 4 animals of each treatment and the 4th used 5 cows of the fodder beet treatment
and 3 of the kale treatment. Hence a total of 17 cows were used in the fodder beet treatment and
15 in the kale treatment.
There were 2 diets based on kale (cultivar, Regal) and fodder beet (cultivar, Rivage) winter forage crops.
the 17th October at a rate of 5 kg/ha. Applied to the crop was 200 and 15 kg/ha of diammonium
phosphate and boron (10% B) at sowing, and 102 kg N/ha urea was applied to the crop as it grew.
The fodder beet was taken from paddock 3a-c which was sprayed on the 15th of September with
Norton + Bentanal Forte + Goltix then ploughed on the 25th. On the 7th of October the paddock was
sprayed with the same mix of herbicides before being cut and rolled. The seed was then sown on the
20th of October at a rate of 100,000 seeds per hectare and 250, 350, 200 and 15 kg/ ha respectively
of CropMaster 20, Na chloride, K chloride and boron (10% B) were applied at sowing. At two points
during the growing season 85 kg/ha. During the growing season the crops were maintained under a
lateral irrigator. Plate 3.1 indicates the area at Ashley Dene Research Farm where the trial was
conducted which is in paddock 4 in the purple area. Forage was taken from the northern ends of
paddocks 1 and 3a.
Plate 3.1 Site Map
3.2
Animals and Management
All cows were selected from cows from the Lincoln University Research Dairy Farm which were
already transitioned onto the forages. 32 crossbreed Friesian x Jersey cows in total were included in
the study. Cows used in the trial were 6 ± 0.46 years of age with a liveweight of 513 ± 8.6kg, a BCS of
5 ± 0.09, and a breeding worth of 120 ± 8.3. The milk production during the 2014/15 season
averaged 353 ± 14.2 kg milk solids and their calving due date ranged from the 30th of July to the 5th
of September.
Cows were kept in pens formed of temporary electrical fencing which measured 48m2 with water
kg DM of oat straw or 10.04 kg DM of fodder beet supplemented with 5.59 kg DM of ryegrass
baleage. The supplement was fed at 0800 h and the forage at 1000 h which was cut and carried to
the cows. All feed offered and refused was weighed using a trailer with inbuilt scales.
Plate 3.2 Cows in kale treatment wearing urine harnesses consuming supplemented oat straw. Plate 3.3 Cows in fodder beet treatment consuming forage ration.
Plate 3.4 is a representative diagram displaying the penned area of the trial which is located at the
southern end of paddock 4 at Ashley Dene Research Farm. Each pink or purple square represents to
48m2 pen in which a cow lived during her time in the trial. The pink pens housed cows in the kale
treatment and the purple housed cows in the fodder beet treatment. Each pen had a water trough
and a gate which opened into the alley between the rows of pens for each treatment. Supplement
and forage were fed along opposite fence lines for each pen i.e. along the east or west side. Water
intake from troughs was measured through the use of a ruler where the height of each trough was
Plate 3.4 Diagram of trial pen set up
3.3
Sample Analysis
3.3.1
Dietary Composition Analysis
Representative samples were taken from the diet offered each week and refusals each day for both
treatments. Forage samples were washed and divided into leaf (including petiole) and stem/bulb.
The components were then weighed to determine the leaf:stem/bulb ratio of the offered and
refused diet. One set of sub samples of all forage components and supplement was oven dried at
60⁰C for 48 hours and reweighed to determine DM content. Another set of sub samples were frozen
and freeze dried. The freeze-dried samples were then ground through a 1-mm sieve, and scanned by
near infra-red spectrophotometer (NIRS, NIRSystems 5000, Foss, Maryland, USA) to determine
forage digestibility, fibre, and CP content. Remaining freeze-dried samples were analysed by an
Elementar (Variomax CN Analyser. Analysensysteme GmbH, Hanau, Germany) to determine the
content of minerals: Ca, Mg, K, and Na.
3.3.2
Urine Composition Analysis
Urine samples were collected from 7 cows in each crop treatment during the trial period. Urine
samples were taken mid-stream after manual stimulation of the vulva, acidified below a pH of 4.0
using concentrated sulphuric acid to prevent volatilization, and then stored at -20°C. Thawed
samples were assessed for urine N% using an N-analyser (Vario MAX CN, Elementar
Analysensysteme, Hanau, Germany). Urea, ammonia, and creatinine contents were also determined
3.3.3
Faecal Measurements and Composition Analysis
To determine moisture and N losses from faecal events the number of faecal events were recorded
and faecal samples were taken from defecations in the cows’ pens after their first 24 hours there.
Representative samples were taken into a 400 ml container from beneath the surface crust of each
faecal patch. Each sample was stirred before subsampling into a smaller 60 ml container. Sub
samples were either dried at 100⁰C for 48 hours to determine DM content or frozen then freeze
dried and ground through a 1mm sieve for composition analysis. The N% was determined through
the use of an Elementar (Vario MAX CN, Elementar Analysensysteme, Hanau, Germany) and the
OM% through furnace combustion at 550⁰C for 4 hours.
3.4
Urine Volume and Frequency
Urine volume and frequency was determined using the urine harness developed by Ravera et al.
(2015). In this system a flow meter connected to a glove through which the cow urinated sent
information to the data logger which was carried by the cow in the pocket of a cow cover (plate 3.5).
The data logger automatically recorded the time, duration, and volume of urine flow through the
meter.
Plate 3.5 Urine harness attached to cows (Ravera et al., 2015).
Urine event recordings with flow rates of less than 80 mL per second were removed to produce a
been due to movement of urine through the meter due to shaking of the meter as the cows moved.
Incomplete data sets without a minimum of 24 hours of recorded urinations were removed as were
sets with numerous unusually high values i.e. above 40 L. On occasion the urine harnesses failed
either due to equipment failure or cows breaking the equipment. This resulted in 12 cows from the
fodder beet and 14 from the kale treatment with at least 24 hours of usable data.
3.4.1
Harness Validation Measurements
Urination was stimulated for cows wearing the harness and the urine event was collected in a
measuring jug with the time of event recorded. Observed urine events of cows wearing the harness
also had their time recorded. This data was then compared to the data logger output. Figure 3.1
displays the relationship between measured and flow meter values to be close to 1.0 the goodness
of fit was lower than expected resulting in a standard error of the estimate of 500 ml.
Figure 3.1 Quadratic regression of measured versus flow meter volumes from urine events. Regression y = 1.0075x, r-sq = 0.61, standard error of the estimate = 0.512.
3.5
Urine Patch Area
To determine ground coverage of urine events on kale and fodder beet areas, a calibration curve
was produced by pouring measured quantities of water from the average height of cow vulva onto
the grazing areas of each treatment. Volumes poured were 1000, 1500, 2000, 2500, 3000, 3500,
4000, 4500, and 5000 ml with 4 measurements taken for each volume. Fluorescent paint was
sprayed around the perimeter of the wetted area and a photo was taken including a fencing
standard for scaling (plate 3.6). Care was taken to ensure the entire patch was included in the
photos which were analysed using the software SketchandCalc to calculate the patch area.
0
0.5
1
1.5
2
2.5
3
3.5
0
0.5
1
1.5
2
2.5
3
3.5
Flo
w
me
ter
(L/
ev
en
t)
Plate 3.6 Urine patches of dairy cows grazing winter forages in situ. A and B in the fodder beet paddock. C and D in the kale paddock
3.6
Calculations of Leaching Loss
Paddock leaching losses were calculated using the following equation:
NL = (NL1 x P1) + (NL2 x P2)
NL = annual average NO3-N leaching losses from a grazed field
NL1 = N leaching losses at the urine patch
NL2 = N leaching losses at non-urine patch areas
P2 = proportion of area covered by non-urine patch areas
Lysimeter data from the site was collected in 2014 which was used for the leaching loss estimations
(Cameron, unpublished). From that data the N leaching losses used for non-urine patch areas were
estimated to be 16 kg N/hafor the fodder beet treatment, and 17 kg N/hafor the kale treatment. In
order to estimate leaching losses for urine patches the N load per average urination was multiplied
by the percentage of N load leached.
The urine patch N load = 𝑢𝑟𝑖𝑛𝑒 𝑁 𝑐𝑜𝑛𝑐 𝑥 𝑎𝑣𝑒𝑟𝑎𝑔𝑒 𝑢𝑟𝑖𝑛𝑎𝑡𝑖𝑜𝑛 𝑒𝑣𝑒𝑛𝑡 𝑣𝑜𝑙𝑢𝑚𝑒𝑎𝑣𝑒𝑟𝑎𝑔𝑒 𝑢𝑟𝑖𝑛𝑒 𝑝𝑎𝑡𝑐ℎ 𝑎𝑟𝑒𝑎 . The percentage of N load being
leached was taken from the 2014 lysimeter data (Cameron, unpublished) and was estimated to be
34% of the fodder beet treatment and 55% for the kale treatment. The proportion of paddock area
covered by urine patches was calculated as:
Covered in Urine Patch (%)= (𝑎𝑣𝑒𝑟𝑎𝑔𝑒 𝑛𝑢𝑚𝑏𝑒𝑟 𝑢𝑟𝑖𝑛𝑎𝑡𝑖𝑜𝑛𝑠 𝑝𝑒𝑟 24ℎ𝑟𝑠)𝑥(𝑛𝑢𝑚𝑏𝑒𝑟 𝑐𝑜𝑤𝑠)𝑥(𝑑𝑎𝑦𝑠 𝑜𝑛 𝑝𝑎𝑑𝑑𝑜𝑐𝑘)𝑡𝑜𝑡𝑎𝑙 𝑎𝑟𝑒𝑎 𝑔𝑟𝑎𝑧𝑒𝑑 .
The area not covered in urine patches could then be estimated through subtracting the obtained
value from 1. The values for these areas could then be inserted into the equation to estimate
paddock leaching losses.
3.7
Statistical Analysis
All data was processed using Microsoft Excel 2013. All diagrams and graphs were produced using
Microsoft Excel 2013. The intake of minerals, water, CP, fibre, etc and the composition of animal
samples were assessed between treatments using one-way ANOVA and Minitab 16. A regression
model was used to calculate the slope coefficient and its standard error of equations for the urine
patch calibration for each treatment.
The urination data was analysed using Minitab 17 with a General Linear Model. Ten cows of each
treatment had 48 hours of urination data from the harness logger and another 6 cows in total had
only 24 hours of data. There were unequal numbers of data sets from each temporal block e.g. 8 for
kale and 4 for fodder beet. One-way ANOVA was performed to assess any differences between the
urination behaviour for cows with 24 hours or 48 hours of data which yielded no significant results.
In order to use all of the data obtained each set of 24 hours of data was treated as independent
regardless of some sets coming from the same cow. The non-independence of samples and the
small, unequal sample sizes resulted in urination behaviour data which breached ANOVA
assumptions. A general linear model was used to incorporate a number of statistical tests including
included in each week and several statistically significant differences were found hence the temporal
blocks were included as fixed factors in the general linear model analysis of urination behaviour
Chapter 4
Results
4.1
Climatic Conditions
Climatic conditions during the experiment are presented in figures 4.1 and 4.2. The mean maximum
temperature was 11.5°C and the mean minimum temperature 0.8°C. Minimum temperatures fell
below zero on 11 of the days and total accumulated rainfall was 36 mm over the experiment.
Figure 4.6 Maximum and minimum temperatures during the experimental period
Figure 4.7 Rainfall and wind speed during the experimental period
-10 -5 0 5 10 15 20 Te m p era tu re (C ) Min Max 0 1 2 3 4 5 6 7 8 9 10 0 2 4 6 8 10 12 14 16 Win d SPee d (m /s ) Rain (mm )
4.2
Diet Composition
Table 4.1 displays the composition of the diet components for cows in each treatment. At time of
study the crop yields from paddocks being sampled were 24.8 ± 2.54 t DM/ha for fodder beet and
14.3 ± 1.44 t DM/ha for kale (de Ruiter, unpublished). Compared with fodder beet, the leaf
constituted a greater proportion of the forage DM for the kale plants and the DM% was similar for
each of the diet components i.e. supplement, leaf, and stem/bulb. The fibre content was greatest in
the supplement which had lower DM digestibility. The CP content of fodder beet bulb and kale stem
were similar at 15% of the DM. However CP in leaf of kale was nearly three times that of fodder beet
leaf. Apart from N, mineral concentrations tended to be greater in the stem or bulb of both crops. K
and Na were higher in fodder beet while Mg was relatively low in both crops.
Table 4.1 Nutrient and mineral composition (g/kg dry matter unless otherwise stated) of kale and fodder beet and supplements
4.3
Apparent Animal Dietary Intake
Apparent intake of DM and nutritive components are presented in table 4.2. The cows in the kale
treatment consumed 3.7 kg more DM than those in the fodder beet treatment (p<0.001). Due to
increased apparent DM intake and high N and Ca the apparent intake of these minerals was also
greater for cows on kale (p<0.001). The fibre intake was more than 1 kg greater for cows in the kale
treatment for both neutral detergent fibre and acid detergent fibre. The CP and N intakes were
significantly higher at almost double the intake for cows consuming the kale diet relative to those in
the fodder beet treatment. The mineral intake of K and Mg were also greater for those in the kale
treatment however the Ca and Na intakes were greater for cows in the fodder beet treatment
Fodder Beet Kale
Leaf Bulb Ryegrass silage Leaf Stem Oat Straw
% of Plant
0.177 0.823 - 0.286 0.714 -Dry Matter%
23.4 18.7 43.2 23.0 14.6 58.0Neutral Detergent Fibre
118 355 535 150 275 638Acid Detergent Fibre
128 256 310 148 230 355Dry Matter Digestibility %
93.5 74.4 69.2 89.7 82.1 60.6Crude Protein
73.0 146 141 228 149 118Nitrogen
2.33 1.17 2.25 3.65 2.38 1.88Calcium
1.62 8.37 5.14 2.16 9.95 3.28Potassium
16.5 31.4 20.0 11.0 14.5 26.2Magnesium
1.39 2.81 1.66 1.74 1.85 1.41Table 4.2 Apparent dietary intake of non-lactating dairy cows in late gestation (per cow per day)
Intake Fodder Beet Kale P-Value
Dry Matter of crop (kg) 7.3 ± 2.1 11.2 ± 1.5 -
Dry Matter of Supplement (kg) 5.6 6.4 -
Total Dry Matter (kg) 13.4 ± 0.3 17.1 ± 0.5 <0.001
Acid Detergent Fibre (kg) 2.93 ± 0.6 3.87 ± 0.1 <0.001
Neutral Detergent Fibre (kg) 4.27± 0.07 5.71 ± 0.2 <0.001
Crude Protein (kg) 1.48 ± 0.03 2.95 ± 0.09 <0.001
Calcium (g) 0.309 ± 0.002 1.80 ± 0.983 <0.001
Potassium (g) 2.662 ± 0.06 2.884 ± 0.08 0.055
Magnesium (g) 0.222 ± 0.006 0.262 ± 0.01 0.004
Sodium (g) 0.534 ± 0.01 0.403 ± 0.02 <0.001
4.4
Urinary Behaviour
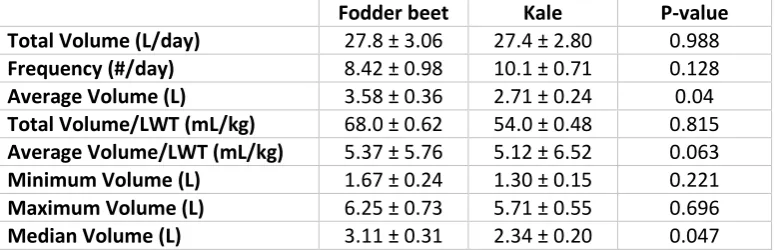
Cows showed similar urine behaviour for both treatments resulting in a total daily urine volume of
27 L/cow/day for kale and fodder beet (Table 4.3, Appendix A). Urine frequency, the minimum and
maximum urine event volumes, and the total daily volume adjusted for liveweight did not differ
between treatments. The average and median urine event volumes were significantly different
where the volumes for cows in the fodder beet treatment were greater than those in the kale
treatment by 87 mL for the average volume and 77 mL for the median volume. The average volume
per kg of liveweight trended towards being significant with cows in the fodder beet treatment again
having greater values. Numerous urination behaviour variables were significantly affected by their
temporal block including total daily volume, average urine event volume, and total daily volume per
kg of liveweight.
Table 4.3 Urination behaviour of non-lactating dairy cows in late gestation fed fodder beet and kale based diets obtained using a urine harness
Fodder beet Kale P-value Total Volume (L/day) 27.8 ± 3.06 27.4 ± 2.80 0.988
Frequency (#/day) 8.42 ± 0.98 10.1 ± 0.71 0.128
Average Volume (L) 3.58 ± 0.36 2.71 ± 0.24 0.04
Total Volume/LWT (mL/kg) 68.0 ± 0.62 54.0 ± 0.48 0.815
Average Volume/LWT (mL/kg) 5.37 ± 5.76 5.12 ± 6.52 0.063
Minimum Volume (L) 1.67 ± 0.24 1.30 ± 0.15 0.221
Maximum Volume (L) 6.25 ± 0.73 5.71 ± 0.55 0.696