DEVELOPMENT AND VALIDATION OF RP-HPLC METHOD FOR THE ESTIMATION OF PRASUGREL IN BULK AS WELL IN PHARMACEUTICAL DOSAGES FORM
7
0
0
Full text
(2) S. Ashutosh Kumar et al. Int. Res. J. Pharm. 2013, 4 (3) Sample Solution Preparation: The Sample Stock Solution has been prepared by weighing 5 Prasugral Tablets and calculated the average weight. Then the powders accurately weighed and transferred the sample equivalent to 10 mg of Prasugral into a 10 mL volumetric flask. Added about 7 mL of diluent and sonicated to dissolve it completely and make volume up to the mark with diluent. Mixed well and then it was filtered through 0.45µm filter. Further from the Sample Stock Solution pipette out 0.4 ml into a 10ml volumetric flask and diluted up to the mark with diluent. Mixed well and then it was filtered through 0.45µm filter. Procedure for Injecting the Sample & Standard Solutions: Injected 20 mL of the standard, sample into the chromatographic system and measured the area for the Prasugral peak and calculated the %Assay by using suitable formulae. System Suitability: The Tailing factor for the peak due to Prasugral in Standard solution should not be more than 2.0. The theoretical plates for the Prasugral peak in Standard solution should not less than 2000. Calculation for Assay: Assay % = Where: AT = Peak Area of Prasugral obtained with test preparation AS = Peak Area of Prasugral obtained with standard preparation WS = Weight of working standard taken in mg WT = Weight of sample taken in mg DS = Dilution of Standard solution DT = Dilution of sample solution P = Percentage purity of working standard Assay Results. Validation Development Precision: Precision has been done as follows: Preparation of stock solution: The Stock Solution has been prepared by weighing accurately and transferred 10 mg of Prasugral Working standard into a 10 mL volumetric flask added about 7 mL of Diluent and sonicated to dissolve it completely and make volume up to the mark with the same solvent. Preparation of 40 µg/ml solution: Further from the above Stock Solution pipette out 0.4 ml into a 10ml volumetric flask and dilute up to the mark with diluent. Mixed well and then it was filtered through 0.45µm filter. Procedure for Injecting the Standard Solution: The standard solution was injected for five times and measured the area for all five injections in HPLC. The %RSD for the area of five replicate injections was found to be within the specified limits. The data are represented in Table 1 Intermediate Precision: To evaluate the intermediate precision (also known as Ruggedness) of the method, Precision was performed on different day by using different make column of same dimensions.. Preparation of stock solution: The Stock Solution has been prepared by weighing accurately and transferred 10 mg of Prasugral Working standard into a 10 mL volumetric flask added about 7 mL of Diluent and sonicated to dissolve it completely and make volume up to the mark with the same solvent. Preparation of 40 µg/ml solution: Further from the above Stock Solution pipette out 0.4 ml of into a 10ml volumetric flask and diluted up to the mark with diluent. Mixed well and filtered through 0.45µm filter. Procedure for Injecting the Standard Solutions: The standard solution was injected for five times and measured the area for all five injections in HPLC. The %RSD for the area of five replicate injections was found to be within the specified limits. The Data are represented in Table 2. Accuracy: The accuracy of an analytical procedure has been done as follows: Preparation of stock Solution: The Stock Solution has been prepared by weighing accurately and transferred 10 mg of Prasugral Working standard into a 10 mL volumetric flask added about 7 mL of Diluent and sonicated to dissolve it completely and make volume up to the mark with the same solvent. Preparation of 40 µg/ml solution: Further from the above Stock Solution pipette out 0.4 ml into a 10ml volumetric flask and diluted up to the mark with diluent. Mixed well and then it was filter through 0.45µm filter. Preparation Sample solutions: The Sample Solution has been prepared as follows: For preparation of 50% solution (With respect to target Assay concentration) The Stock Solution has been prepared by weighing accurately and transferred 5.0 mg of Prasugral API sample into a 10 mL volumetric flask added about 7.o mL of Diluent and sonicated to dissolve it completely and make volume up to the mark with the same solvent. Further the above Stock Solution pipette out 0.4 ml into a 10ml volumetric flask and diluted up to the mark with diluent. Mixed well and then it was filtered through 0.45µm filter. For preparation of 100% solution (With respect to target Assay concentration): The Stock Solution has been prepared by weighing accurately and transferred 10.0mg of Prasugral API sample into a 10 mL volumetric flask add about 7 mL of Diluent and sonicated to dissolved it completely and make volume up to the mark with the same solvent. Further from the above Stock Solution pipette out 0.4 ml into a 10ml volumetric flask and diluted up to the mark with diluent. Mixed well and then it was filter through 0.45µm filter. For preparation of 150% solution (With respect to target Assay concentration): The Stock Solution has been prepared by accurately weighing and transferred 15.0mg of Prasugral API sample into a 10 mL volumetric flask added about 7 mL of Diluent and sonicated to dissolved it completely and make volume up to the mark with the same solvent. Further from the above Stock Solution Page 255.
(3) S. Ashutosh Kumar et al. Int. Res. J. Pharm. 2013, 4 (3) pipette out 0.4 ml into a 10ml volumetric flask and diluted up to the mark with diluent. Mixed well and then it was filter through 0.45µm filter. Procedure for Injecting the Solutions: Injected the standard solution, Accuracy -50%, Accuracy -100% and Accuracy -150% solutions. Calculated the Amount found and Amount added for the drug estimation and calculated for the individual recovery and mean recovery values. The data are represented in Table no. 3. Linearity: The linearity of the analytical procedure has been done as follows: Preparation of stock solution: The Stock Solution has been prepared by weighing accurately and transferred 10mg of Prasugral API sample into a 10 mL volumetric flask added about 7 mL of Diluent and sonicated to dissolved it completely and make volume up to the mark with the same solvent. The preparation has been done as follows: Preparation of Level – I (20µg/ml):0.2ml of stock solution has taken in 10 ml of volumetric flask dilute up to the mark with diluent Preparation of Level – I (30µg/ml):0.3ml of stock solution has taken in 10 ml of volumetric flask dilute up to the mark with diluent. Preparation of Level – II (40µg/ml):0.4ml of stock solution taken in 10 ml of volumetric flask dilute up to the mark with diluent. Preparation of Level – III (50µg/ml):0.5ml of stock solution taken in 10 ml of volumetric flask dilute up to the mark with diluent. Preparation of Level – IV (60µg/ml):0.6ml of stock solution taken in 10 ml of volumetric flask dilute up to the mark with diluent. Procedure for Injecting the Solutions: Injected each level into the chromatographic system and measured the peak area. Plotted the graph of peak area versus concentration (on Xaxis concentration and on Y-axis Peak area) and calculated the correlation coefficient. The data are represented in Table 4. Limit of Detection: The detection limit of an individual analytical procedure is the lowest amount of analyte in a sample which can be detected but not necessarily quantities as an exact value. Preparation of 40µg/ml solution: The Stock Solution has been prepared by weighing accurately and transferred 10mg of Prasugral Working standard into a10 ml volumetric flask added about 7 mL of Diluent and sonicated to dissolved it completely and make volume up to the mark with the same solvent. Further from the above Stock Solution pipette out 0.4 ml into a 10ml volumetric flask and diluted up to the mark with diluent. Mixed well and then it was filtered through 0.45µm filter. Preparation of 1.8% solutions At Specification level (0.07µg/ml solution): Pipette out 1mL of 10µg/ml solution. into a 10 ml of volumetric flask and diluted up to the mark with diluent. Pipette 1mL of 10µg/ml solution into a 10 ml of volumetric flask and diluted up to the mark with diluent. Further pipette 1.8mL of above diluted solution into a 10 ml of volumetric flask and dilute up to the mark with diluent. Calculation of S/N Ratio: Average Baseline Noise obtained from Blank: 49µV Signal Obtained from LOD solution (1.5% of target assay concentration): 148 µV S/N = 148/49= 3.01 Acceptance Criteria: S/N Ratio value shall be 3 for LOD solution. Limit of Quantification: The Quantification limit of an individual analytical procedure is the lowest amount of analyte in a sample which can be quantitatively determined with suitable precision and accuracy. Preparation of 40µg/ml solution: The Stock Solution has been prepared by weighing accurately weigh and transferred 10mg of Prasugral Working standard into 10 mL volumetric flasks. Added about 7 mL of Diluent and sonicated to dissolved it completely and make volume up to the mark with the same solvent. Further from the above Stock Solution pipette out 0.4 ml into a 10ml volumetric flask and diluted up to the mark with diluent. Mixed well and then it was filter through 0.45µm filter. Preparation of 5.4%solution At Specification level (0.2µg/ml solution): Pipette out 1mL of solution into a 10 ml of volumetric flask and dilute up to the mark with diluent. Pipette out 1mL of solution into a 10 ml of volumetric flask and dilute up to the mark with diluent. Further pipette out 5.4 mL of above diluted solution into a 10 ml of volumetric flask and diluted up to the mark with diluent. Calculation of S/N Ratio: Average Baseline Noise obtained from Blank: 49µV Signal Obtained from LOD solution (5.0% of target assay concentration): 499 µV S/N = 499/49 = 10.1 Acceptance Criteria: S/N Ratio value shall be 10 for LOQ solution. Robustness: As part of the Robustness, deliberate change in the Flow rate, Mobile Phase composition, Temperature Variation was made to evaluate the impact on the method. The flow rate was varied at 0.9 to1.1 ml/min. The Standard solution 40 µg/ml was prepared and analysed using the varied flow rates along with method flow rate. On evaluation of the above results, it can be concluded that the variation in flow rate do not affect the method significantly. Hence it indicates that the method is robust even by change in the flow rate ±10%. The data are represented in Table 5. The Organic composition in the Mobile phase was varied from70% to 50%: The Standard solution 40 µg/ml was prepared and analysed using the varied Mobile phase composition along with the actual mobile phase composition in the method. On evaluation of the above results, it can be concluded that the variation in 10% Organic composition in the mobile phase do not affect the method significantly. Page 256.
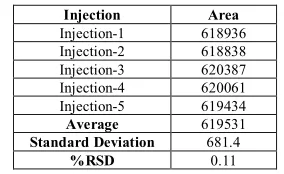
(4) S. Ashutosh Kumar et al. Int. Res. J. Pharm. 2013, 4 (3) Hence it indicates that the method is robust even by change. in the Mobile phase ±10%. The data are represented in Table 6.. Table 1: The results are summarized for Precision. Table 2: The results for Ruggedness are summarized. Injection Area Injection-1 616550 Injection-2 616002 Injection-3 614198 Injection-4 614670 Injection-5 614644 Average 615213 1007.7 Standard Deviation %RSD 0.16 Acceptance Criteria: The % RSD for the area of five standard injections results should not be more than 2%.. Injection Injection-1 Injection-2 Injection-3 Injection-4 Injection-5 Average Standard Deviation %RSD. Area 618936 618838 620387 620061 619434 619531 681.4 0.11. Acceptance Criteria: The % RSD for the area of five standard injections results should not be more than 2%.. Table 3: The results for Accuracy are summarized %Concentration (at specification Level) 50% 100% 150%. Area 612287 1220663 1811336. Amount Added (mg) 5.0 10.0 15.0. Amount Found (mg) 4.9 9.9 14.9. % Recovery 99% 99.4% 101.8%. Mean Recovery 99.6%. Acceptance Criteria: The % Recovery for each level should be between 98.0 to 102.0%. Table 4: The results are summarized for Linearity Linearity Level Concentration Area I 20µg/ml 295857 II 30µg/ml 463117 III 40µg/ml 612270 IV 50µg/ml 759987 V 60µg/ml 924317 Correlation Coefficient 0.999 Acceptance Criteria: Correlation coefficient should be not less than 0.999. S.No 1 2 3 4 5. Table 5: The results are summarized for Robustness with change in flow rate Flow Rate (ml/min) 0.9 1.0 1.1. System Suitability Results USP Plate Count USP Tailing 2544 1.5 2542 1.5 2234 1.5. Table 6: The results are summarized for Robustness with change in the composition of the Organic Phase Change in Organic Composition in the Mobile Phase 10% less Actual 10% more. System Suitability Results USP Plate Count USP Tailing 2488 1.7 2542 1.5 2276 1.5. Figure 1: Chemical structure of Prasugrel. Page 257.
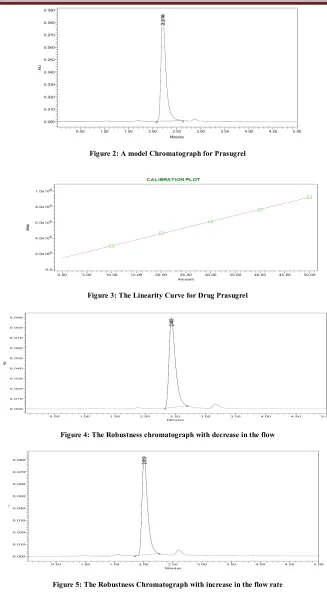
(5) S. Ashutosh Kumar et al. Int. Res. J. Pharm. 2013, 4 (3). Figure 2: A model Chromatograph for Prasugrel. Figure 3: The Linearity Curve for Drug Prasugrel. Figure 4: The Robustness chromatograph with decrease in the flow. Figure 5: The Robustness Chromatograph with increase in the flow rate. Page 258.
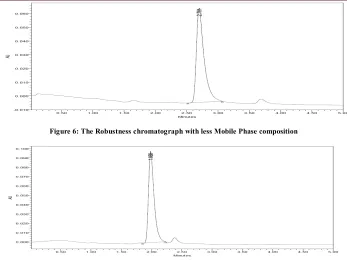
(6) S. Ashutosh Kumar et al. Int. Res. J. Pharm. 2013, 4 (3). Figure 6: The Robustness chromatograph with less Mobile Phase composition. Figure 7: The Robustness chromatograph with more Mobile Phase Composition. RESULT & DISCUSSION The present study was carried out to develop a sensitive, precise and accurate HPLC method for the analysis of in pharmaceutical dosage forms. In order to method development under isocratic conditions, mixtures of Phosphate Buffer with pH 3 adjusted with Orthophosphoric acid and Acetonitrile HPLC grade in different combinations were tested as mobile phase on a Symmetry C18 (4.6 x 150mm, 5 mm, Make: XTerra) column. A binary mixture of Phosphate Buffer pH 3.0 and Acetonitrile in 30:70 v/v proportion was proved to be the most suitable of all combinations since the chromatographic peaks were better defined and resolved and almost free from tailing. The retention times obtained for Prasugral were around 2.216 min. A model chromatogram is shown as Figure 2. The Precision data has been represented by Table 1. When Prasugrel was analyzed by the proposed method in the intra and inter-day (Ruggedness) variation results, a low coefficient of variation was observed it has been represented in Table 2. This shows that the present HPLC method is highly precise and it has been represented by Figure 4. The Accuracy data has been summarized in Table 3. In order to test the linearity of the method, five dilutions of the working standard solutions of the drug in the range of 20 to 60µg per mL for the drug were prepared. The data has been represented in Table 4. Each of the dilutions was injected into the column and the graph for the Linearity Curve has been represented in Figure 3. The method was duly validated by evaluation of the required parameters. Robustness of the method was found out by testing the effect of small deliberate changes in the chromatographic conditions in the chromatographic conditions and the corresponding peak areas. The factors selected for this purpose were flow rate and percentage composition variation in Phosphate buffer and Acetonitrile in the mobile phase. The method was found to be robust enough that the peak area was not apparently affected by small variation in the chromatographic conditions. The Fig.no.4, 5, 6 & 7 has been represented the Robust nature of. the chromatograph. The system suitability parameters were within the limits as shown in Table 5 and 6 for the drug. Limit of detection and limit of quantification of the method were calculated basing on standard deviation of the response and the slope (s) of the calibration curve at approximate levels of the limit of detection and limit of quantification. The LOD for the drug was found to be 0.07µg/ml and LOQ for the Drug was found to be 0.2μg/mL .The drug content formulations were quantified by using the proposed analytical method. The low coefficient of variation in the recovery data indicates the reproducibility of the method in dosage forms. It can be concluded that the proposed HPLC method is sufficiently sensitive and reproducible for the analysis of Prasugral in the Tablet formulation dosage forms within a short analysis time. CONCLUSION It can be concluded that the proposed RP-HPLC method developed for the quantitative determination of Prasugral in bulk and in its formulations is simple, selective, sensitive, accurate, precise and rapid. The method was proved to be superior to most of the reported methods. The mobile phases are simple to prepare and economical. The sample recoveries in the formulation were in good agreement with their respective label claims and they suggested non-interference of formulation excipients in the estimation. Hence this method can easily be adopted as an alternative method to reported ones for the routine determination of Prasugral depending upon the availability of chemicals and nature of other ingredients present in the sample. The method also finds use in clinical, biological and pharmacokinetic studies of Prasugral. REFERENCES 1. Baker WL, White CM. Role of Prasugrel, a Novel P2Y12 Receptor Antagonist, in the Management of Acute Coronary Syndromes. American Journal of Cardiovascular Drugs Aug 1, 2009; 9 (4): 213-229. http://dx.doi.org/10.2165/1131209-00000000000000 PMid:19655817. Page 259.
(7) S. Ashutosh Kumar et al. Int. Res. J. Pharm. 2013, 4 (3) 2.. 3. 4.. 5.. 6. 7. 8.. Wiviott SD, Braunwald E, McCabe CH et al. (2007). "Prasugrel versus clopidogrel in patients with acute coronary syndromes". N Engl J Med 357 (20): 2001–15. http://dx.doi.org/10.1056/NEJMoa0706482 PMid:17982182 ICH, Harmonized Tripartite Guideline. Validation of Analytical Procedure: Methodology (Q2B). International Conference on Harminizatio, 1997. "FDA Drug Safety Communication: Reduced effectiveness of Plavix (clopidogrel) in patients who are poor Metabolizes of the drug". Drug Safety and Availability. Food and Drug Administration (United States). March 12, 2010. Retrieved March 15, 2013. Silvano M, et al. (2011). "A case of resistance to clopidogrel and Prasugrel after percutaneous coronary angioplasty.” J Thromb Thrombolysis 31(2): 233–4. http://dx.doi.org/10.1007/s11239-0100533-x PMid:21088983 O'Riordan, Michael. "Switching from clopidogrel to prasugrel further reduces platelet function". http://www.theheart.org. Retrieved 1 April 2011. Bhatt DL (2007). "Intensifying Platelet Inhibition — Navigating between Scylla and Charybdis". N Engl J Med 357 (20): 2078–81. http://dx.doi.org/10.1056/NEJMe0706859 PMid:17982183 Duggan ST, Keating GM. Prasugrel: A Review of its Use in Patients with Acute Coronary Syndromes Undergoing Percutaneous Coronary Intervention. Drugs Aug 20, 2009; 69 (12): 1707-26. http://dx.doi.org/ 10.2165/10484190-000000000-00000 PMid:19678718. 9. 10.. 11. 12. 13.. 14.. Harshini B, Alekhya SVR, Manasa G, Vanitha Prakash K. Extractive Spectrophotometric Estimation of Prasugrel In Pharmaceutical Formulation. Res J Pharma, Bio and Che Sci 2011, 2 (3): 426-430. Srikanth I, Sharmila P, Vijaya bharathi K, Raju M, Lakshma M, Nagarjuna K. A Validated Reverse Phase HPLC Method for the Estimation Of Prasugrel Hydrochloride In pharmaceutical Dosage Forms.J Inno trends Pharma Sci. 2011, 2 (5): 140-148. Usha Rani G, Chandrasekhar B, Devanna N. Analytical Method Development and Validation of Prasugrel in Bulk and its Pharmaceutical Formulation using HPLC.J App Pharma Sci 2011, 01 (07): 172-175. Borole TC, Mehendre R, Damle MC, Bothara KG. Development and Validation of Stability indicating HPTLC Method for Determination of Prasugrel. J Che, Pharma Res. 2010, 2(4): 907-913. Kishore R, Venkateswara RA, Lavanya P, PaniKumar AD, Rama Krishna, Subba Reddy PV. Development of Validated RP-HPLC Method for the Estimation of Prasugrel HCl in Pure and Pharmaceutical Formulations.J Pharmacy Res 2011, 4(9): 3105-3110. Pulla RP, Sastry BS, Prasad YR, Raju NA. Estimation of Prasugrel in Tablet Dosage Form by RPHPLC. Int J Chem Res 2011, 2(3): 34-36.. Cite this article as: S. Ashutosh Kumar, J.V.L.N.Seshagiri Rao, K. Jhansi Rani, S. S. S. Jaya Madhuri, T. S. R. K. V. Prasad. Development and validation of RP-HPLC method for the estimation of Prasugrel in bulk as well in pharmaceutical dosages form. Int. Res. J. Pharm. 2013; 4(3):254-260. Source of support: Nil, Conflict of interest: None Declared. Page 260.
(8)
Figure
Related documents
The purpose of this study is to characterize the very eld- erly population, who received emergency general surgery, and examine their surgical outcomes including identifica- tion
suis cells were detected on PAECs incubated with the negative control preparation (Figure 5d).. To assess whether the presence
• The cattle that showed clinical signs before day 16 (early cases) stayed for a long time in the herd, and were culled only after a few days, while cattle that became sick later
Aldous EW, Mynn JK, Banks J, Alexander DJ: A molecular epidemiological study of avian paramyxovirus type 1 (Newcastle disease virus) isolates by phylogenetic analysis of a
However, the nanosilver-coated orthodontic bracket can be utilized during fixed orthodontic treatment with caution, because the foreign particles which are brown-black granules
Keywords: Cardiac surgery, Postcardiotomy cardiogenic shock (PCS), Extracorporeal membrane oxygenation (ECMO), Intra-aortic balloon pumping (IABP), Concurrent initiation,
HAR Human activity recognition HGA Human gait analysis HGI Human gait inference EM Expectation-Maximization GMM Gaussian mixture model RNN Recurrent neural networks LSTM Long-short
