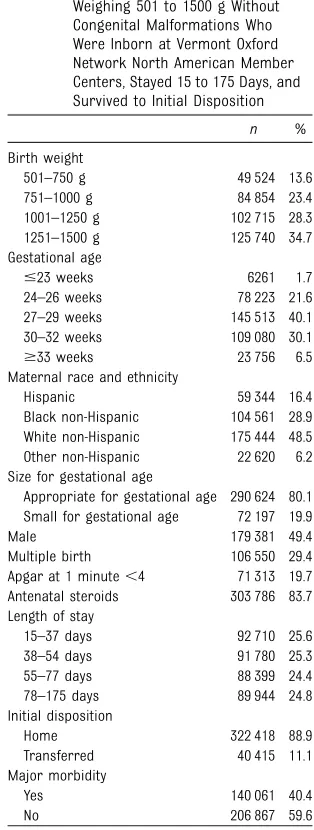
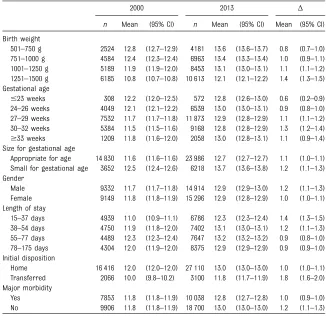
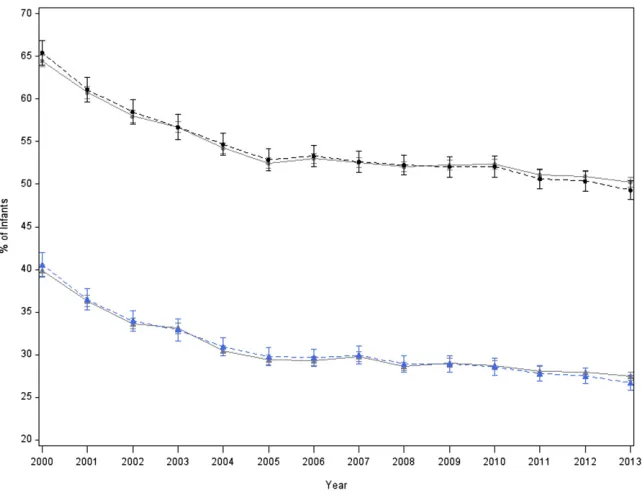
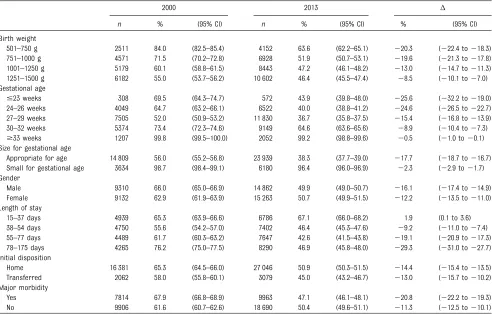
Weight Growth Velocity and Postnatal Growth Failure in Infants 501 to 1500 Grams: 2000–2013
Full text
Figure

Related documents
nodular lung pattern was observed in 5 dogs including one dog with a pulmonary mass. The findings in
Only when the organisation and the counselling service have proved themselves to be trustworthy is the inclusion of conditions for mandatory referral likely to be acceptable
This research used the translog profit function model approach, because this approach has several advantages, including (1) Input and Output of production are
decreased the levels of Bcl-2, p-Akt and p-ERK, and increased the levels of Bax and active caspase 3 in SW480/OXA cells and HT29/OXA cells, which were further enhanced in the
EMPLOYING OLDER WORKERS The mismatch between (potentially) decreasing productivity and higher wages of older workers is likely to worsen the positon of senior workers on the
The newly emerging paradigm of soft-computing or Hybrid Computational Intelligence Systems approach which is based on neural networks, fuzzy sets, genetic algorithms and chaos
Licensed under Creative Common Page 124 However, as shown by Perron(1989) that the traditional tests do not consider the presence of any structural breaks in the data
Licensed under Creative Common Page 242 Thus, further analyzing the data to extend the indicators of cultural characteristics influenced workplace diversity management at
