University of Pennsylvania
ScholarlyCommons
Publicly Accessible Penn Dissertations
1-1-2014
Microstructure and Phase Behavior in Colloids and
Liquid Crystals
Matthew Alan Lohr
University of Pennsylvania, [email protected]
Follow this and additional works at:
http://repository.upenn.edu/edissertations
Part of the
Chemical Engineering Commons
, and the
Condensed Matter Physics Commons
This paper is posted at ScholarlyCommons.http://repository.upenn.edu/edissertations/1351
Recommended Citation
Lohr, Matthew Alan, "Microstructure and Phase Behavior in Colloids and Liquid Crystals" (2014).Publicly Accessible Penn Dissertations. 1351.
Microstructure and Phase Behavior in Colloids and Liquid Crystals
Abstract
This thesis describes our investigation of microstructure and phase behavior in colloids and liquid crystals. The first set of experiments explores the phase behavior of helical packings of thermoresponsive microspheres inside glass capillaries as a function of volume fraction. Stable helical packings are observed with long-range orientational order. Some of these packings evolve abruptly to disordered states as the volume fraction is reduced. We quantify these transitions using correlation functions and susceptibilities of an orientational order parameter. The emergence of coexisting metastable packings, as well as coexisting ordered and disordered states, is also observed. These findings support the notion of phase-transition-like behavior in quasi-one-dimensional systems.
The second set of experiments investigates cross-over behavior from glasses with attractive interactions to sparse gel-like states. In particular, the vibrational modes of quasi-two-dimensional disordered colloidal packings of hard colloidal spheres with short-range attractions are measured as a function of packing fraction. A crossover from glassy to sparse gel-like states is indicated by an excess of low-frequency phonon modes. This change in vibrational mode distribution appears to arise from highly localized vibrations that tend to involve individual and/or small clusters of particles with few local bonds. These mode behaviors and corresponding structural insights may serve as a useful signature for glass-gel transitions in wider classes of attractive packings.
A third set of experiments explores the director structures of aqueous lyotropic chromonic liquid crystal (LCLC) films created on square lattice cylindrical-micropost substrates. The structures are manipulated by modulating of the concentration-dependent elastic properties of LCLC s via drying. Nematic LCLC films exhibit preferred bistable alignment along the diagonals of the micropost lattice. Columnar LCLC films form two distinct director and defect configurations: a diagonally aligned director pattern with local squares of defects, and an off-diagonal configuration with zig-zag defects. The formation of these patterns appears to be tied to the relative free energy costs of splay and bend deformations in the precursor nematic films. The observed nematic and columnar configurations are understood numerically using a Landau-de Gennes free energy model. This work provides first examples of quasi-2D micropatterning of LC films in the columnar phase and the first micropatterning of lyotropic LC films in general, as well as demonstrating alignment and configuration switching of typically difficult-to-align LCLC films via bulk elastic properties.
Degree Type
Dissertation
Degree Name
Doctor of Philosophy (PhD)
Graduate Group
Physics & Astronomy
First Advisor
Keywords
chromonic, colloids, gel, glass, helical, liquid crystals
Subject Categories
MICROSTRUCTURE AND PHASE BEHAVIOR IN
COLLOIDS AND LIQUID CRYSTALS
Matthew Alan Lohr
A DISSERTATION
in
Physics and Astronomy
Presented to the Faculties of the University of Pennsylvania
in
Partial Fulfillment of the Requirements for the Degree of Doctor of Philosophy
2014
Arjun G. Yodh, Professor of Physics and Astronomy
Supervisor of Dissertation
Randall D. Kamien, Professor of Physics and Astronomy
Graduate Group Chairperson
Dissertation Committee
Randall D. Kamien, Professor of Physics and Astronomy
Peter J. Collings, Adjunct Professor of Physics and Astronomy
Kathleen J. Stebe, Professor of Chemical and Biomolecular Engineering
Dedication
Dedicated to my wife, Melissa.
Acknowledgements
This work wouldn’t exist without the constant support of many people over many years.
My wife, Melissa, has been extremely important in keeping me sane, fed, groomed and
grounded throughout my graduate studies. When I was writing my undergraduate thesis, she
walked into my room and noticed I had been so distracted by writing that I had let a bottle of
detergent spill into the middle of the floor. My functionality during the writing of this thesis
dissertation is largely due to her. More importantly, she makes me happier than I could ever
imagine.
My advisor, Prof. Arjun Yodh, has been a great mentor who has been very supportive when
I became frustrated with my research. During my graduate school visits, I asked every professor
I met what they thought the worst thing about their department was. Many had clever and
cir-cuitous answers (“We don’t have enough graduate students!”). Arjun was the only one who gave
me a straightforward answer of, “What? No, there’s nothing wrong with Penn. You should just
come here.” I have since learned such frankness is an important part of being a good
communi-cator, and I hope that his sincere, direct, patient and good-natured advice has molded me into a
better scientist.
My family, currently spread across the country and globe, has been a constant source of
love and support throughout my life and academic career. My parents, beyond being extremely
supportive through my young and adult life, have always been thoughtful about my gifts and
values, pushing me towards a fulfilling career while always encouraging my interests (be they
science, music, theater, or beer). Though I love all my siblings equally, I have to give a special
me to challenge my intellectual limits and, to quote Mr. Edward Abbey, “Subvert the Dominant
Paradigm.”
The Yodh Soft Matter Group is full of awesome people who also happen to be great
scien-tists. To my fellow graduate students, Dan Chen, Oni Basu, Peter Yunker, (Matt) Gratale, Zoey
Davidson, and Wei-Shao Wei; to our postdocs, Zexin Zhang, Ke Chen, Tim Still, Ye Xu, and
Joonwoo Jeong; and to our academic collaborators, Prof. Kevin Aptowicz and Prof. Piotr
Hab-das: you all have made this group a fun place to pursue one’s Ph. D, and I owe almost everything
I learned in graduate school to the lot of you. I could not have hoped for a better group of people
to work with over these years, and I hope to continue collaborating with all of you in the future.
Beyond my immediate group, I have had some great collaborators in and around Penn,
with-out whom my work would be boring and incomplete. To Ahmed Alsayed, Marcello Cavarello,
Mohammed Gharbi, Prof. Kathleen Stebe and Prof. Peter Collings, thank you for all your work
sharing your experimental expertise and valuable insight into sometimes mysterious and
tem-peramental materials. To Bryan Chen, Prof. Randall Kamien, Daniel Beller, Carl Goodrich,
and Daniel Sussman, thank you for performing complex derivations and simulations to support
my results, for taking the time to patiently explain finer points of various theories, and, most
importantly, for sharing your scotch with me.
Speaking of Penn, I have to give credit to the Penn Physics department. Ever since I first
visited Penn back when I was deciding where to go for graduate school, it was clear to me that
this was a department full of well-rounded and interesting people. I am proud to have been a
part of it, and I’m glad for all of the friends I’ve made there. Also, I have to thank the staff of the
I never could have imagined that a close-knit group of open, friendly, passionate people
would be interested in the same squishy things I thought were cool. So I have to thank the soft
matter community at large. Though I will be stepping into a career in industry research and
development, I hope to stay in touch, and can’t wait to see the great new work you all produce
on self-assembly, phase behavior, and nonlinear phenomena.
I am extremely grateful for the opportunities I have had to pursue undergraduate research,
so I have to thank Prof. Peter Schiffer, Prof. Daniel Lathrop, Prof. Diane Henderson, Dr.
Charles Doumalin, and Dr. Masafumi Fukuto, as well as the NSF’s REU program, for getting
me involved in interesting research early on. I still draw on things I learned from your labs to
this very day.
I finally have to thank the city of Philadelphia for being an interesting and affordable place
to live, and the perfect place for a budding scientist to spend formative years. Also, need to
thank my cat Leela (a native of University City, found crouched under a car outside DRL by my
friends and colleagues Peter Yunker and Erin Buckley) for being the sweetest pet any man could
ABSTRACT
MICROSTRUCTURE AND PHASE BEHAVIOR IN COLLOIDS AND
LIQUID CRYSTALS
Matthew Alan Lohr
Arjun G. Yodh
This thesis describes our investigation of microstructure and phase behavior in colloids and
liquid crystals. The first set of experiments explores the phase behavior of helical packings of
thermoresponsive microspheres inside glass capillaries as a function of volume fraction.
Sta-ble helical packings are observed with long-range orientational order. Some of these packings
evolve abruptly to disordered states as the volume fraction is reduced. We quantify these
tran-sitions using correlation functions and susceptibilities of the orientational order parameter,𝜓6.
The emergence of coexisting metastable packings, as well as coexisting ordered and disordered
states, is also observed. These findings support the notion of phase-transition-like behavior in
this class of quasi-one-dimensional systems.
The second set of experiments investigates cross-over behavior from glasses with
attrac-tive interactions to sparse gel-like states. In particular, the vibrational modes of
quasi-two-dimensional disordered colloidal packings of hard colloidal spheres with short-range attractions
are measured as a function of packing fraction. A crossover from glassy to sparse gel-like states
is indicated by an excess of low-frequency phonon modes. This change in vibrational mode
and/or small clusters of particles with few local bonds. These mode behaviors and
correspond-ing structural insights may serve as a useful signature for glass-gel transitions in wider classes
of attractive packings.
A third set of experiments explores the director structures of aqueous lyotropic chromonic
liquid crystal (LCLC) films created on square lattice cylindrical-micropost substrates. The
struc-tures are manipulated by modulating the concentration-dependent elastic properties of LCLCs
via drying. Nematic LCLC films exhibit preferred bistable alignment along the diagonals of the
micropost lattice. Columnar LCLC films form two distinct director and defect configurations: a
diagonally aligned director pattern with local squares of defects, and an off-diagonal
configura-tion with zig-zag defects. We suggest that the formaconfigura-tion of these patterns is tied to the relative
free energy costs of splay and bend deformations in the precursor nematic films. The observed
nematic and columnar configurations are understood numerically using a Landau-de Gennes free
energy model. This work provides first examples of quasi-2D micropatterning of LC films in the
columnar phase and the first micropatterning of lyotropic LC films in general; the work also
demonstrates alignment and configuration switching of typically difficult-to-align LCLC films
Contents
Dedication ii
Acknowledgements iii
Abstract vi
List of Figures xxxii
1 Introduction 1
1.1 Structure and Melting of Helical Packings . . . 3
1.2 Vibrational Signatures of Gel-like and Glassy Colloidal Packings . . . 6
1.3 Microscopic Ordering of Lyotropic Chromonic Liquid Crystals . . . 9
1.4 Organization of Thesis . . . 12
2 Helical Packings and Phase Transformations of Soft Spheres in Cylinders 13 2.1 Introduction . . . 13
2.2 Contextual and Theoretical Background . . . 15
2.2.2 Transformations of Helical Structures . . . 19
2.2.3 Phase Transitions . . . 21
2.2.3.1 Phase Transitions, Long Range Order and Dimensionality . . 22
2.3 Experimental Methods . . . 28
2.3.1 pNIPAm microspheres . . . 28
2.3.1.1 pNIPAm Synthesis and Fluorescent Functionalization . . . . 29
2.3.1.2 pNIPAm Particle Diameter Characterization . . . 30
2.3.2 Microtube Geometry and Sample Configuration . . . 32
2.3.3 Fluorescence Confocal Microscopy . . . 33
2.3.3.1 Background on Confocal Microscopy . . . 34
2.3.3.2 Advantages and Disadvantages of TSM and CLSM . . . 36
2.4 Results and Analysis . . . 38
2.4.1 Characterization of 3D Structure . . . 38
2.4.2 Long-Range Orientational Order in Achiral Packings . . . 43
2.4.3 Theoretical Model for Long-Range Orientational Order in Helical Packings 45 2.4.4 Orientational Order Parameter, Susceptibility, and Evidence of a Phase Transition in Experiment . . . 49
2.4.5 Structural Transformations in Chiral Packings . . . 53
2.5 Conclusions . . . 54
3.2 Contextual and Theoretical Background . . . 57
3.2.1 Attractive Glasses . . . 57
3.2.2 Gels . . . 59
3.2.3 Differences between Gels and Attractive Glasses . . . 60
3.2.4 Phonons in Disordered Solids . . . 61
3.2.4.1 Conventional Low-Frequency Phonon Behavior: The Debye Model . . . 61
3.2.4.2 Low-Frequency Phonons in Disordered Solids . . . 62
3.3 Experimental and Analytical Methods . . . 65
3.3.1 Sample Preparation . . . 65
3.3.1.1 Issues Forming Quasi-2D Thermal Attractive Monolayers . . 65
3.3.1.2 Novel Monolayer Spreading From Lutidine Wetting . . . 67
3.3.1.3 Temperature Stability . . . 69
3.3.1.4 Monolayer Formation . . . 71
3.3.2 vDOS Calculation from Particle Trajectories . . . 71
3.3.3 Analytical Considerations for vDOS calculations . . . 74
3.4 Results and Discussion . . . 76
3.4.1 Conventional Structural Characteristics of Attractive Monolayers . . . 76
3.4.2 vDOS Shape as a Signature of Structural Transition . . . 80
3.4.2.1 Comparison of vDOS in Dense Packing to Simulations . . . 82
3.4.4 Qualitative Description of Structural Correlations to Localized Low-Frequency
Modes . . . 88
3.5 Conclusion . . . 93
4 Elasticity-Dependent Self-assembly of Micro-Templated Chromonic Liquid Crystal Films 95 4.1 Introduction . . . 95
4.2 Contextual and Theoretical Background . . . 97
4.2.1 Lyotropic Chromonic Liquid Crystals . . . 97
4.2.2 History of Chromonics . . . 100
4.2.3 Emerging Applications of LCLCs . . . 101
4.2.4 Barriers to Practical Application of LCLCs . . . 103
4.2.5 Elastic Deformations in LCLCs . . . 106
4.2.6 Defects in Columnar LCLCs . . . 108
4.3 Experimental and Numerical Methods . . . 110
4.3.1 Choice of LCLC Suspensions . . . 111
4.3.2 Synthesis and Loading of Micropost Arrays . . . 113
4.3.3 Polarizing Imaging and Director Field Analysis . . . 115
4.3.4 Numerical Modeling of Liquid Crystals in Micropost Arrays . . . 121
4.4 Results and Discussion . . . 124
4.4.1 Nematic Configurations . . . 124
4.4.1.1 Estimation of Anchoring Strength of Rubbing Alignment . . 127
4.4.2.1 Experimentally Observed Columnar Patterns . . . 129
4.4.2.2 Numerical Reproduction of Columnar Patterns . . . 133
4.5 Conclusion . . . 137
5 Preliminary Results: Novel Microstructures in Lyotropic Chromonic Liquid Crys-tals 138 5.1 Nematic LCLC’s in Micropost Arrays with a Deformed Interface . . . 139
5.2 Observations of Chiral LCLC Configurations in Tubes . . . 143
5.3 Mixtures of CLC and Surfactant Phases . . . 147
5.4 Diblock Copolymer Vesicles Suspended in CLCs . . . 150
5.5 Summary . . . 153
6 Conclusions and Future Work 155 6.1 Summary . . . 155
6.2 Future Work . . . 158
6.2.1 Three Dimensional Dynamics and Self-Assembly of Helical Structures 158 6.2.2 Precise Structural Nature and Generality of the Gel-Glass Crossover . . 161
6.2.3 Further Engineering of LCLC films via Microtemplating . . . 162
6.2.4 Continuing Work on Novel LCLC-Facilitated Microstructures . . . 163
List of Figures
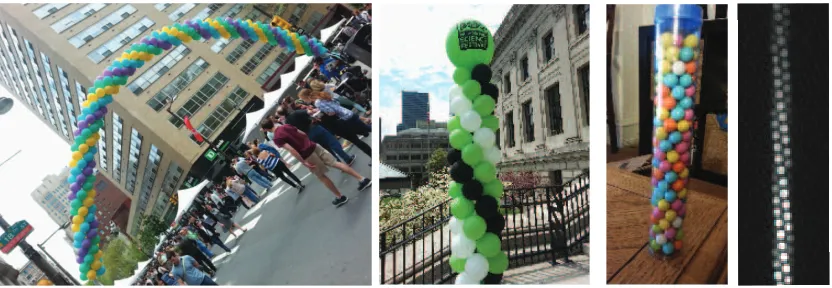
1.1 Helical packings of spheres. (Left) Packings of ballooons at festivals with (0,4,4)
and (0,3,3) structures. (Middle right) Spherical candies arranged in a (0,6,6)
structure in their cylindrical packaging. (Right) Fluorescence confocal microscopy
image of a (2,3,5) packing of thermosensitive, micron-size pNIPAm particles in
a glass microcapillary. . . 4
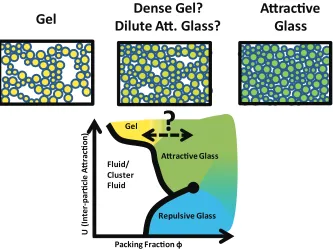
1.2 Qualitative phase diagram of disordered packings as a function of packing
frac-tion (𝜙) and inter-particle attraction (𝑈). Images above illustrate an obviously
sparse gel packing (left), obviously dense glassy packing (right), and an
inter-mediate density packing of indeterminate phase (middle). . . 7
1.3 Cross-polarizing image of a drying droplet of a dilute DSCG suspension,
show-ing a low-to-high concentration gradient from image top to bottom. Illustrations
depict molecular structure in corresponding isotropic (I, top), nematic (N,
2.1 Illustrations depicting the two-dimensional order of a hexagonal(2,3,5)
struc-ture (left) and a rhombic(3,5)structure (right). Illustrations on the left
demon-strate the three dimensional structure (adapted from [37]); illustrations on the
right demonstrate the corresponding “unwrapped” two-dimensional structure.
Particles on the edge are repeated for clarity. Numbers indicate relative
dis-tance along the tube direction; arrows indicate the wrapping of the 2D structured
needed to create the corresponding 3D structure. . . 17
2.2 Illustration of possible ratios of inter-particle seperation𝑑𝑠𝑒𝑝and packing
diam-eter𝐷(Fig. 2.13) at close packing for hexagonal and rhombic helical
configura-tions (based on data from [37, 53]). . . 19
2.3 (Left) Possible transformations between helical, hexagonally ordered states
me-diated by dislocation motion (adapted from [53]), arranged by ratio of packing
diameter𝐷to particle radius𝑎at close packing. (Right) “Unwrapped” structure
of a helical packing transitioning between a (2, 3, 5) (bottom, blue circles) and a
(1, 4, 5) packing (top, purple circles) via motion of a 5-7 dislocation pair (yellow
circles). . . 20
2.4 Qualitative illustrations of behavior of order parameters and associated
suscep-tibilities with temperature in discontinuous 1st order (left) and continuous 2nd
2.5 Bright field microscopy images of a dense aqueous suspension of pNIPAm
mi-crogel particles at 25 ∘C (left) and 28 ∘C (right). Particles deswell with
in-creasing temperature (as depicted in the illustration insets), dein-creasing packing
fraction, melting the packing from a crystalline packing (left) to an isotropic
disordered fluid (right). Scale bar =10𝜇m. . . 29
2.6 Two-dimensional spatial correlation functions for the two sizes of pNIPAm
mi-crospheres (a, smaller, b, larger) used in helical packings experiments at different
temperatures in a dilute suspension in a quasi-2D cell. Horizontal line indicates
𝑔(𝑟) = 1/𝑒, an effective definition of sphere diameter. Shoulders in𝑔(𝑟)curves
in (a) occur due to the presence of one or two stuck particles in the field-of-view. 31
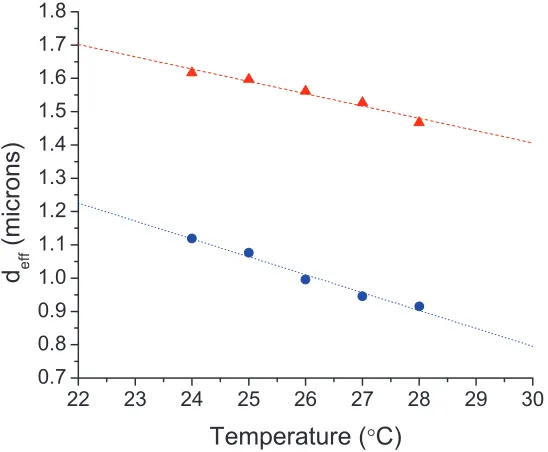
2.7 Approximate diameters for the smaller (blue∙) and larger (red▲) pNIPAm
par-ticles used in helical packing experiments at different temperatures, with linear
fits. . . 32
2.8 Imaging artifacts from confocal scans of helical packings. (a) Illustration of an
𝑥𝑦cross-section of the experimental configuration (not to scale). (b) Brightness
of a confocal scan of a (2, 3, 5) packing averaged along the tube length (𝑧
di-rection) Inset: expected 𝑥𝑦 brightness distribution with perfect imaging, given
placement of particles in helical packing outlined by dotted lines. (c)𝑥𝑧slices
of a confocal scan of the same (2, 3, 5) packing close to the objective (bottom),
2.9 Confocal scans of a 6 𝜇m polystyrene bead with a fluorescent shell,
compar-ing TSM (a-b) and CLSM (c-d) scanncompar-ing methods (taken from [87]). Note the
slightly increased deformation from the expected circular shape in the CLSM
images. . . 37
2.10 Confocal fluorescence cross-sections of six observed geometries of pNIPAm
packings in microcapillaries (indicated by (𝑚, 𝑛, 𝑚+𝑛) notation), along with
corresponding reconstructions from particle locations determined using
centroid-locating algorithms on full 3D confocal scans. . . 39
2.11 3D pair correlation function from positions of≈1.7𝜇m colloidal pNIPAm spheres
in a (2,3,5) packing. First peak in𝑔(𝑟)highlighted in red, with Lorentzian peak
fit used to determine𝑑𝑠𝑒𝑝 is the blue dashed line. The vertical dotted line
indi-cates cutoff for nearest neighbor determination. . . 40
2.12 Example of determination of helical structural integers (𝑚, 𝑛, 𝑚+𝑛). (a) Axial
and azimuthal positions of tracked particles in a short axial section. The nearest
neighbors of the green particle are highlighted in blue. Relative axial distance
from the green particle listed to side. Note that the nearest neighbors have
rela-tive axial order of 2, 3 and 5. (b) Histogram of relarela-tive axial order for 1st, 2nd
and 3rd closest nearest neighbors in the axial direction in a single packing. Peaks
2.13 Geometrical characteristics of observed structures, (2,2,4) (blue□), (1,3,4)
(pur-ple∘), (2,3,5) (green△), (1,4,5) (cyan ▽), (0,5,5) (red♢), (3,3,6) (dark green
★). Filled symbols indicate structures with observable Brownian motion. Dashed
vertical lines indicate theoretical𝐷/𝑑sep values for predicted structures. Inset:
Cartoon of axial cross-section of a (3,3,6) structure with𝑑sep> 𝑑eff. . . . 42
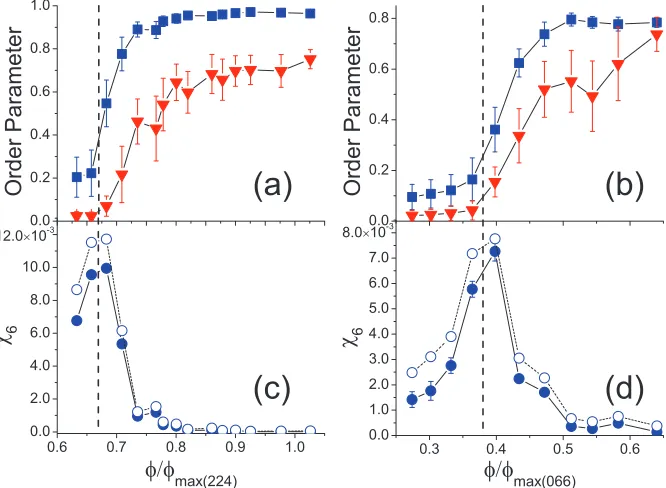
2.14 Local maxima of orientational spatial correlation function𝑔6(𝑧)for samples with
(2,2,4) packing (a) and (0,6,6) packing (b). Dashed lines: Full correlation
func-tion at 𝜙/𝜙max(224) = 0.86 and 0.63 (a) and 𝜙/𝜙max(066) = 0.64 and 0.36
(b), where 𝜙max is the maximum volume fraction for a given packing of hard
spheres with the observed particle spacing. Empty symbols indicate samples
with short-range order. Oscillations arise from the periodic distribution of
parti-cle positions along the tube axis. Full correlation functions were calculated for
all volume fractions, but omitted for the sake of clarity. . . 44
2.15 Top: Mean values of translational (red▼) and orientational (blue ■) order
pa-rameters for (a) (2,2,4) and (b) (0,6,6) samples. Bottom: Orientational
suscepti-bilities for (c) (2,2,4) and (d) (0,6,6) systems, for sample size = 75𝜇m (∘) and =
∞(∙). Dashed vertical lines at𝜙/𝜙max(224) = 0.67and𝜙/𝜙max(066) = 0.38. 50
2.16 Snapshots of particle positions from a (0,6,6) structure exhibiting coexisting
or-dered and disoror-dered domains. Color represents local variance of the phase of
2.17 Snapshots of particle positions from a (2,3,5) structure with emerging domains
of (3,2,5) and (0,4,4) structures. Color represents phase of𝜓6𝑗,𝜃6𝑗, which
char-acterizes packing orientation. Structures corresponding to each𝜃6𝑗 given on right. 54
3.1 Qualitative phase diagram of disordered packings as a function of packing
frac-tion𝜙and inter-particle attraction strength𝑈. . . 58
3.2 (Left) Illustration of the difference in low-frequency density of states𝐷(𝜔)in an
ordered Debye solid (black solid line) and a disordered glassy solid (dashed red
line) with𝑑dimensions. Note the boson peak exhibited at low frequencies
exhib-ited by the disordered solid. (Right) vDOS calculated from particle trajectories
in quasi-2D disordered packings of thermal colloidal microgel spheres with soft
repulsive interactions at various area fractions 0.840 < 𝜙 < 0.885, adapted
from [18]. Note low-frequency peak which changes height and frequency
loca-tion with area fracloca-tion. . . 63
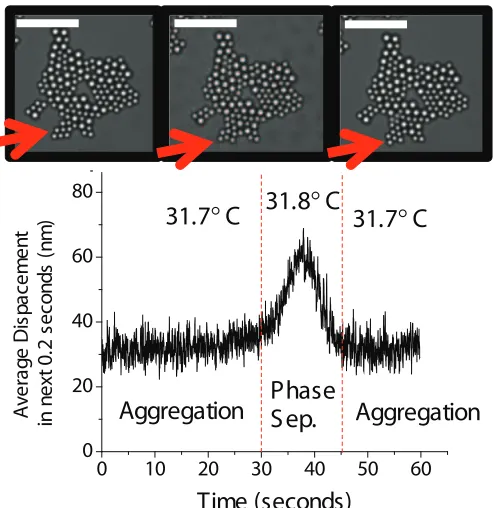
3.3 Formation of PS monolayers using water-lutidine phase separation, viewed
un-der bright-field microscopy, with accompanying illustrations below. (Left) Three
dimensional clusters form and sediment to the bottom of the sample cell at
the aggregation temperature. (Middle) Heating sample above the aggregation
regime causes phase separation of water and lutidine, pulling PS spheres into
a monolayer of repulsive particles at the bottom surface. (Right) Lowering the
temperature back to the aggregation regime pins particles to the surface, allowing
them to aggregate from short-range attraction to a stable, percolating monolayer.
3.4 Effect of temperature fluctuations in a lower stability objective heater (Bioptechs).
(Bottom) Average particle displacement in a PS monolayer aggregate over the
next 0.2 seconds during a temperature fluctuation of 0.1∘C, taking the sample
out of the aggregation regime. (Top) Bright field microscope images of an
attrac-tive monolayer cluster during the temperature fluctuation. Red arrow indicates a
sub-cluster of particles that undergoes an irreversible rearrangement during the
temperature fluctuation. Scale bar= 10𝜇m. . . 70
3.5 Higher stability objective heater setup (Bioscience Tools). (Left)
Configura-tion of Biosciencetools heating objective collar and external temperature probe
placed in sample immersion oil on an upright microscope setup (in experiments,
an inverted microscope is used). (Middle) Temperature readout from external
temperature probe immediately after an increase in set temperature from 33.4
∘C to 33.8 ∘C. Temperature fluctuations stabilize after about 60 seconds from
the start of the temperature change. (Left) Temperature readout from external
temperature probe several minutes after a temperature change. Note fluctuations
of±0.03∘C. . . 70
3.6 Extrapolation of modes to compensate for low statistics in a packing with area
fraction 𝜙 = 0.84. (Left) 1/𝜔 of several modes calculated for several ratios of
𝑁𝑝/𝑁𝑓, with linear fits extrapolating these modes to the limit of𝑁𝑝/𝑁𝑓 = 0.
(Right) vDOS calculated for𝑁𝑓 = 7000 (red points),𝑁𝑓 = 10000 (green points),
and extrapolation𝑁𝑓 → ∞(black points). Note the increasingly better statistics
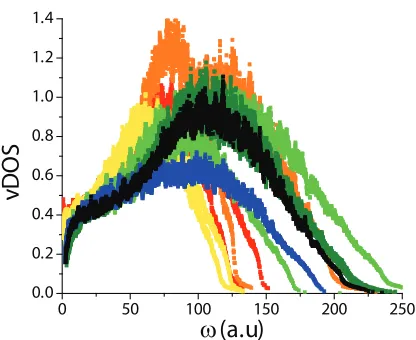
3.7 vDOS curves of observed packings against unnormalized frequencies on a linear
scale. Notice shifts in the location of the high-frequency peak from packing to
packing. (Red, 𝜙 = 0.50 −0.55; Orange, 𝜙 = 0.56−0.62; Yellow, 𝜙 =
0.64−0.65; Green,𝜙= 0.69−0.74; Olive,𝜙= 0.80; Blue,𝜙= 0.81−0.82;
Black,𝜙= 0.84). . . 77
3.8 Unprocessed bright-field microscopy images of investigated bidisperse
attrac-tive PS monolayer packings at various densities. Approximate area fraction 𝜙
indicated by inset. Scale bar= 10𝜇m. . . 78
3.9 Bright-field microscopy images of investigated bidisperse attractive PS
mono-layer packings at various densities, with contrast and brightness enhanced for
clarity. Approximate area fraction𝜙indicated by inset. Scale bar= 10𝜇m. . . . 79
3.10 Pair correlation function g(r) of densest (𝜙= 0.84, blue solid line) and sparsest (𝜙
= 0.50, red dotted line) observed packings. Sparse packing𝑔(𝑟)shifted vertically
by+1.0for clarity. . . 80
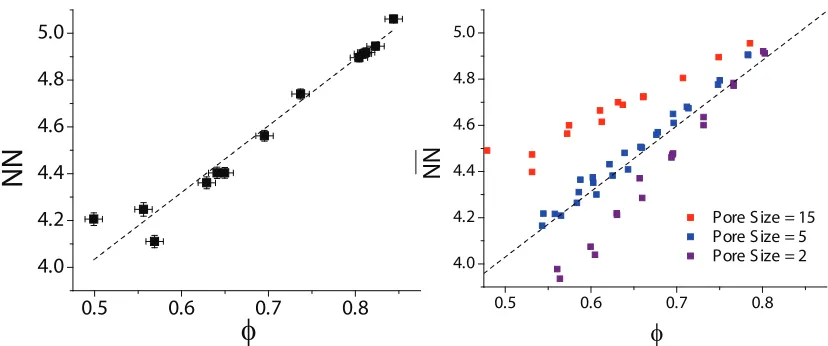
3.11 (Left) Average number of nearest neighbors as a function of𝜙for experimentally
observed packings, with a linear fit. (Right) Nearest neighbors vs. 𝜙calculated
for the particle positions of the observed𝜙= 0.84packing, with clusters of 2, 5
or 15 particles randomly removed. The dashed line is from the fit of experimental
3.12 Vibrational density of states as a function of frequency𝜔calculated from
eigen-mode distributions in packings with𝜙 <0.67(i.e., six packings with𝜙= 0.50,
0.55, 0.56, 0.62, 0.64, and 0.65, each±0.1) (red lines) and𝜙 >0.67(i.e., seven
packings with𝜙= 0.69, 0.74, 0.80, 0.80, 0.81, 0.82, and 0.84, each±0.1) (blue
lines). Thin, faded lines indicate vDOS for individual packings; thicker lines
are the average vDOS for all packings in the sparse (𝜙 <0.67, red) and dense
(𝜙 <0.67, blue) regimes. . . 82
3.13 vDOS curves from simulated dense, uniform bidisperse packings (𝜙 = 0.95,
black; 𝜙 = 0.898, purple; 𝜙 = 0.833, blue; 𝜙 = 0.816, green), along with
an experimentally calculated vDOS curve from the densest observed packing
(𝜙 = 0.84, red curve). Nearest neighbors determined by particle overlap in
simulation indicated in the legend. . . 83
3.14 Histogram of participation ratio𝑝(𝜔)for low-frequency modes (𝜔/𝜔 <¯ 0.1)for
packings with𝜙 <0.67(open red squares) and𝜙 > 0.67(closed blue squares).
3.15 Vibrational density of states re-calculated discounting highly localized modes
(𝑝 <0.2) as a function of frequency𝜔calculated from eigenmode distributions
in packings with𝜙 < 0.67 (i.e., six packings with 𝜙= 0.50, 0.55, 0.56, 0.62,
0.64, and 0.65, each±0.1) (red lines) and𝜙 > 0.67 (i.e., seven packings with
𝜙= 0.69, 0.74, 0.80, 0.80, 0.81, 0.82, and 0.84, each±0.1) (blue lines). Thin,
faded lines indicate vDOS for individual packings; thicker lines are the average
vDOS for all packings in the sparse (𝜙 < 0.67, red) and dense (𝜙 <0.67, blue)
regimes. . . 86
3.16 Plots of particle locations from a sparser packing (𝜙= 0.64±0.01) overlaid with
polarization eigenvector components corresponding to two modes with similar
frequency (𝜔/𝜔¯= 0.019 (a) and 0.021 (b)) and significantly different localization
(𝑝(𝜔) = 0.32 (i.e., a more extended mode) (a), and𝑝(𝜔) = 0.069 (i.e., a more
localized mode) (b)). Scale bar= 10𝜇m. . . 87
3.17 Histograms of∣e𝑖(𝜔)∣for all modes with𝜔/𝜔 <¯ 0.1 in all observed packings
with 𝜙 < 0.67 for extended (𝑝 > 0.2, solid squares) and localized (𝑝 < 0.2,
3.18 (a)Plot of particle locations in a𝜙= 0.64±0.01 packing, with particles which
have ∣e𝑖(𝜔)∣ > 0.2for any mode where 𝜔/𝜔 <¯ 0.1 highlighted in red. Scale
bar= 10𝜇m.(b) Histogram of size of clusters of particles which dominate a
low-frequency mode in sparse packings (∣e𝑖(𝜔)∣ > 0.2, 𝜔𝑛/𝜔 <¯ 0.1, 𝜙 < 0.67).
(c) Histogram of nearest neighbors per particle of each packing with𝜙 < 0.67
(black points) and for particles in all sparse packings which dominate a
low-frequency mode (empty squares,∣e𝑖(𝜔)∣>0.2,𝜔𝑛/𝜔 <¯ 0.1). . . 89
3.19 Illustration of single-particle deformations in a linear chain of particles, showing
a particle with two neighbors in a line connected by springs (a) at its equilibrium
position, with inter-particle spacing 𝑟, (b) under a longitudinal deformation of
size𝛿𝑥, and (c) under a transverse deformation of size𝛿𝑦. . . 91
3.20 Characterization of linear structure distribution in a packing with area fraction
𝜙= 0.64. (Left) Histogram of∣𝜓2𝑖∣for particles in the packing. (Right) Particle
positions for𝜙 = 0.64 packing, with particles with ∣𝜓2𝑖∣ ¿ 0.6 highlighted in
purple. Arrows indicate angle given by the complex phase of 𝜓2𝑖. Scale bar
= 10𝜇m. . . 92
4.1 Illustration of the mesogen structure in lyotropic chromonic liquid crystals. (Top)
Plank-like LCLC-forming molecules, when suspended in water, form linear
ag-gregates, which act as mesogens for liquid crystal phases. (Bottom) The
com-mon liquid crystal phases of aggregates in chrocom-monic liquid crystals are nematic
4.2 Number of academic articles containing the keyword “chromonic” from Web of
Science (open circles) and Google Scholar (filled squares) per year from the past
few decades. . . 101
4.3 Nematic DSCG suspension placed between glass slides rubbed with an
abra-sive, creating an aligned film approximately 10𝜇m thick, viewed under
crossed-polarizers. Evaporation proceeds from an open edge beyond the upper right
corner of the image, causing drying into the columnar phase. Though drying is
slow, herringbone textures can be seen in the columnar phase. . . 105
4.4 Qualitative illustration of the director deformations contributing the splay (𝐾1),
twist (𝐾2) and bend (𝐾3) deformations. . . 107
4.5 Molecular structure and aqueous suspension phase diagram of disodium
cromo-glycate (left) and Sunset Yellow (right). Phase diagram of DSCG from [98];
4.6 Configuration of micropost arrays loaded with liquid crystals. a) Bright-field
microscopy image of an empty SU-8 micropillar array with post center spacing
𝐿= 14𝜇m, diameter 𝑑=𝐿/2 = 7𝜇m, and height ℎ= 5𝜇m. Scalebar = 50𝜇m.
Inset: close-up of microposts, indicating 𝑑and 𝐿. b) Schematic of micropost
array configuration after loading with LCLC film. SU-8 microposts (1) sit atop
a glass wafer (2). After being loaded with a LCLC (3), the wafer is placed in
a glass petri dish (4) and immersed in hexadecane(5). c) Schematic of LCLC
film loading procedure. A droplet of heated LCLC suspension is placed in a
droplet onto a cleaned and heated micropost array where it begins to spread
due to capillary forces (top); immediately afterward, hexadecane is placed to
completely cover the sample, and LCLC droplet continues to spread (middle);
after several minutes, the LCLC film has spread to cover the entire micropost
array, leaving a level film at the post height (bottom). . . 114
4.7 Crossed-polarizer images from a movie of a rotating30%wt/wt Sunset Yellow
aqueous nematic film in an array of cylindrical microposts of diameter 7 𝜇m
and height 5𝜇m, overlaid with bright circles centered at tracked post centers.
Polarizer and analyzer oriented along the vertical and horizontal of images. Scale
4.8 Intermediate post-processing steps for post tracking a rotating 30 percent Sunset
Yellow aqueous nematic film in an array of cylindrical microposts of diameter 7
𝜇m and height 5𝜇m. (Top) Inverted cross-polarizer images, calculated from
sub-tracting original image pixel values from the maximum pixel brightness.
(Bot-tom) Inverted images convoluted with a uniformly bright disk of diameter equal
to the post diameter, yielding near-gaussian peaks centered at the post centroids.
Scale bar = 50𝜇m. . . 117
4.9 (a) Trajectories of 59 posts tracked through a 360∘ sample rotation. (b)
Trajec-tories with average translational motion per frame removed. . . 118
4.10 Selections of images of the SSY film from Figure 1, with net sample rotation
and translation removed. Polarizer/analyzer are oriented at angles of 0∘ (t = 0
sec), 37∘ (t = 6 sec), and 55∘(t = 8 sec) with respect to the vertical/horizontal
of images. . . 118
4.11 (a) Selection of unprocessed video of SSY film under crossed-polarizers, when
the polarizer/analyzer is oriented at an angle of 0 ∘ (t = 0 sec) with respect to
the vertical/horizontal of the image. (b-c) Image brightness / transmitted light
intensity at pixels 1 and 2, respectively, as a function of the angle of
polar-izer/analyzer to image horizontal/vertical, 𝜃𝑑𝑖𝑟. Red lines indicate fits to the
function 𝐼 = 𝐼0sin2(2(𝜃𝑑𝑖𝑟−𝜃𝑝𝑜𝑙)) +𝐵, where 𝐼0 is the difference in
maxi-mum and minimaxi-mum intensity, and 𝐵 is the minimum intensity value. For (a),
4.12 (a) Relative in-plane director magnitude, 𝐼0. Indications of defects at the edges
of posts are shown as small dark spots. (b) In-plane director orientation (red
lines) plotted over grayscale image of in-plane director magnitude𝐼0. For the
sake of clarity, only every 10th pixel is represented in this image. . . 121
4.13 Micropost arrays filled with nematic DSCG (14% wt/wt) at room temperature.
Crossed-polarizer (a & c) and crossed-polarizer with full wave retardation plate(b
& d) images shown with bottom surfaces rubbed along a lattice diagonal (a & b)
or a post lattice direction (c & d), as illustrated in the insets. Scale bar = 50𝜇m.
The slow axis of the retardation plate is given by the orange arrow in (b & d). . 125
4.14 Average in-plane director orientation (red lines) from a minimization of the LdG
free energy for a generic nematic in cylindrical micropost confinement, overlaid
by the schlieren texture expected when viewed between crossed-polarizers. . . 126
4.15 Nematic films of 14% wt/wt DSCG (a-c) and 30% wt/wt SSY (d-f) in micropost
arrays. Images show schlieren textures under crossed-polarizers (a & d), average
in-plane director magnitude (b & e), and average in-plane director orientation for
4.16 Results of LdG numerical modeling with varying planar oriented anchoring strength
along the bottom of the cell. The planar anchoring is parallel to one of the lattice
axes (in this case along the𝑥direction) and has a strength𝑊. a) Absolute value
of the angle of the stable defect orientation with respect to the bottom surface
anchoring direction ∣𝜙𝑑∣, as a function of anchoring strength𝑊. Each point is
averaged over 10 random initial configurations. 𝑊𝑚𝑎𝑥=1.0×10⁻⁷J/m2is set at
the value of𝑊 resulting in∣𝜙𝑑∣=𝜙𝑚𝑖𝑛= 40.5∘. Bottom: simulation results for
local director orientation (red lines) and corresponding schlieren textures given
polarizer, analyzer, lattice axes and rubbing direction (dashed lines / red arrow)
given in schematic (e) for (b)𝑊1 =3.52×10⁻¹⁰ J/m2, (c)𝑊2 =7.04×10⁻⁷
J/m2and (d)𝑊3=3.48×10⁻⁶J/m2. . . 130
4.17 Columnar film of DSCG dried from a nematic DSCG film of initial concentration
17% wt/wt. Images show (a) crossed-polarizer image of the film; (b) bright
field image of the film (where defects are visible as dark lines); (c) probability
distribution of in-plane director orientations with respect to the horizontal post
lattice spacing direction; (d) average in-plane director orientation for four posts,
colored by angle using the same scheme as (c) and plotted over the average
in-plane director magnitude (bright=in-in-plane, dark=out-of-in-plane/disordered). Scale
4.18 Columnar films dried from (left) nematic DSCG film of initial concentration
18% wt/wt and (right) SSY. Images show (a) crossed-polarizer image of the
film; (b) bright field image of the film (where defects are visible as dark lines);
(c) probability distribution of in-plane director orientations with respect to the
horizontal post lattice spacing direction; (d) average in-plane director
orienta-tion for four posts, colored by angle using the same scheme as (c) and
plot-ted over the average in-plane director magnitude (bright=in-plane,
dark=out-of-plane/disordered). Scale bar = 10𝜇m. . . 133
4.19 Average in-plane director orientations from expanded LdG free energy
mini-mizations in micropillar confinement for effective Frank elastic constant ratios
𝐾3/𝐾1= 0.09 (a-c) and𝐾3/𝐾1= 0.03 (d-f) for in-plane director initializations of
45∘(a & d), 40∘ (b & e), and 30∘(c & f) from the horizontal post lattice spacing
direction. Line coloring highlights distinct regimes of director orientation (blue
= close to horizontal, red = most off-horizontal, green = intermediate
orienta-tion); darker backgrounds indicate regions with the 40% greatest contribution to
4.20 Final mean director orientation from expanded LdG free energy minimizations
as a function of deviation of initialized director angle from the lattice diagonal.
Mean director angles >36∘ correspond to “square” defect wall configurations
(blue area of graph); mean director angles < 36∘ correspond to “zigzag”
de-fect wall configurations (mauve area of graph). Filled circles represent
effec-tive Frank free energy constants𝐾3/𝐾1= 0.09; open squares represent effective
Frank free energy constants𝐾3/𝐾1 = 0.03 . . . 136
5.1 Illustration of LCLC film configuration with deformed nematic interfaces. Since
the film is in nematic-isotropic coexistence, though the top of the aqueous film
is level, the isotropic-nematic interface wets the microposts and deforms. . . 140
5.2 Cross-polarizing images of a nematic SSY film (polarizer and analyzer vertical
and horizontal, respectively) with a deformed interface. Insets: Enlargements of
cross-polarizer texture between four posts. . . 141
5.3 (Right) Cross-polarizer image of the “pinwheel” texture with corresponding
ap-proximated average in-plane director orientation sketched in red dotted lines.
(Left) Illustration of the presumed shape of the deformed nematic-isotropic
in-terface between four posts. Dark lines trace the surface of the inin-terface. . . 142
5.4 (Top) Nematic DSCG in a microcapillary with inner diameter < 10𝜇m under
cross polarizers. (Bottom) Nematic DSCG with added PEG in a
microcapil-lary with inner diameter<10𝜇m under cross polarizers with a full wavelength
5.5 DSCG emulsion droplets at 15%wt/wt suspended in mineral oil in glass
micro-capillaries, under cross-polarizers (top) and with a full-wavelength retardation
plate (bottom). . . 145
5.6 Isotropic-nematic coexistence of DSCG in a microcapillary, under cross-polarizers
with a full wavelength retardation plate. . . 146
5.7 Twisted disclination lines observed in nematic DSCG filled capillaries, several
days after filling. Viewed under cross-polarizer with full wavelength retarding
waveplate. . . 147
5.8 Cross-polarizing images of 15% wt/wt SDS/butanol mixture in 10% wt/wt
aque-ous DSCG solution. The system exhibits nematic-isotropic and/or
columnar-isotropic coexistance via crowding effects. . . 149
5.9 Variety of SDS/decanol/water mesophases including 3% wt/wt DSCG (top,
cross-polarizer, bottom, cross-polarizer with full-wavelength retarding waveplate). Left:
SDS/decanol in nematic calamitic (𝑁𝐶) phase (5% decanol, 33.5% SDS).
Mid-dle: SDS/decanol in nematic discotic (𝑁𝐷) phase (5.9% decanol, 31% SDS)/
Right: SDS/decanol in lamellar (𝐿𝛼) phase (9.4% decanol, 29.2% SDS). . . 150
5.10 Cross-polarizing images of PEO-PBD vesicle in nematic DSCG shortly after
initial suspension. Top: Temperature increase from 25C to 36C (left to right)
induces swelling of crumpled vesicle. Bottom: Cooling from 36C to 25C (left
5.11 Vesicles in nematic DSCG 3 days after initial cooling, under cross-polarizers.
Image at the far right demonstrates deformation of vesicle shape by a moving
Chapter 1
Introduction
The creation of unique materials through the careful control of microstructure is an exciting new
activity at the forefront of condensed matter physics. Microstructured photonic metamaterials,
for example, exploit micron-size refractive patterns to create substances with unusual optical
properties, e.g., superlenses which defeat the conventional diffraction limit. Biomimectic
mate-rials replicate micro-textures observed in the natural world, for example, in order to synthetically
reproduce the hydrophobicity of lotus leaves, the adhesive feet of geckos, and the brilliant
struc-tural colors of butterfly wings. Such materials have exciting emerging applications in robotics,
display, and energy technologies.
The implementation of such sophisticated concepts and technologies requires detailed
con-trol of materials at a micro- and nano-scale. Fabrication of two- and three-dimensional (2D,
3D) microstructures, for example, has been facilitated by the refinement of techniques such as
photolithography and high-resolution 3D printing. Similarly, recent strides have been made
lead to more scalable methods for microstructure production. An attractive and possibly simpler
approach towards the same goal is to grow complex material structures starting with surface
tem-plates or micro-patterns. In principle, these micro-patterns could be modulated which, in turn,
could manipulate structure of the coupled three-dimensional material.
The study of microstructured materials has been stimulated not only by our increased
abil-ity to create microstructures, but also by the growing portfolio of innovative methodologies
to quantitatively observe these structures. In particular, digital recording technology and
com-puter processing power have evolved dramatically over the past few decades and have made it
possible to precisely quantify and analyze the microscopic structure and dynamics of soft
ma-terials via video microscopy [26]. Precise quantification of particle trajectories, for example,
has facilitated the technique of microrheology [17] and the measurement and study of
vibra-tional modes [18, 43, 54, 72]. These techniques, in turn, have brought deeper understanding of
the microscopic origins of the glass transition [18, 43, 72], melting [1, 51], and other interesting
materials physics.
This dissertation investigates the behavior of a variety of soft materials. The research
in-volves fabrication of novel microstructures and then rigorous measurement and analysis of their
configurations and dynamics. For example, by creating helical packings of thermal colloidal
spheres in hollow cylindrical micro-capillaries, we gained fresh insight into the structural
sta-bility and melting physics of quasi-1D helical materials [94]. In a different vein, we
investi-gated a largely unexplored area of the colloidal “phase diagram,” wherein a so-called attractive
and manipulating colloidal monolayers, and then used the resulting packings to identify
vi-brational (and microstructural) signatures of the gel-glass transition. Finally, we investigated
the substrate-induced self-assembly of a relatively unexplored class of soft materials called
ly-otropic chromonic liquid crystals (LCLCs). We made significant progress using micropost arrays
to template LCLC films with microstructures that affected the LCLCs via the materials’ elastic
properties [95]. Besides the work discussed in this thesis, the author played a contributing role
on several other projects in the Yodh lab. These experiments were concerned with the evaporative
deposition of colloidal particles, and particularly how capillary interactions between anisotropic
microscopic particles can modify their deposition behavior during drying [175–177].
The remainder of this chapter will provide a brief introduction to the primary topics explored
in this dissertation. Though the projects described address different fundamental physical
prob-lems (melting and structure in confinement, glass-gel “phase behavior”, and templated liquid
crystal structures), all of these experiments share state-of-the-art experimental techniques and
analysis to understand soft matter phenomenology and phase transitions.
1.1
Structure and Melting of Helical Packings
Helical packings arise from a fairly simple geometrical constraint. When uniform spheres are
confined at high densities to the interior of a cylinder whose diameter is of the same order as the
sphere diameter, they then form an ordered packing of intertwining helices of adjacent particles.
The structure of these packings resembles a two-dimensional hexagonal lattice wrapped into a
tight cylinder. Though such structures can be produced at any size, only during the past decade
nano-scale [75, 171], wherein thermal fluctuations become important.
Figure 1.1: Helical packings of spheres. (Left) Packings of ballooons at festivals with (0,4,4) and (0,3,3) structures. (Middle right) Spherical candies arranged in a (0,6,6) structure in their cylindrical packaging. (Right) Fluorescence confocal microscopy image of a (2,3,5) packing of thermosensitive, micron-size pNIPAm particles in a glass microcapillary.
Thus, the stability of such structures in the presence thermal fluctuations was largely
un-considered until recently, with most research being content to study athermal varieties of such
systems [9, 10, 53, 132, 133]. Further, since there exists a widely held assumption that stable
crystalline packings with long-range order cannot exist in one dimensional systems [126, 162],
it is reasonable to suspect that helical packings might not be stable. In practice, the helical
mi-crostructures we explore experimentally (and indeed many analogous structures) are not truly
one-dimensional; rather, they resemble a tightly wrapped periodic two-dimensional pattern.
Thus, the exact helical microstructures that thermal colloids form under confinement, their
sta-bility, and their phase behavior are not intuitively apparent.
Chapter 2 of this thesis describes work identifying helical colloidal packings at the
mi-croscale and examining the thermal stability of such structures. The colloids employed are
packings of fluorescently-labeled thermoresponsive microgel spheres in glass microcapillaries.
highly curved and index-mismatched interfaces of these samples), we quantified both the
struc-tural properties and their Brownian dynamics at multiple particle-to-tube-diameter ratios, and
as a function of the particle volume fraction. We observed that this system forms helical
pack-ings, and that these packings remained stable in the presence of thermal fluctuations at volume
fractions significantly below close packing. Then, by decreasing the particle diameter (i.e., by
increasing the sample temperature), and thus decreasing the overall volume fraction, we were
able to observe the melting of these helical crystals. Careful examination of the dynamics and
fluctuations of local order parameters around the melting transitions provided evidence of a
phase-transition-like crossover between long-range orientationally ordered and fluid states. To
some degree, these observation provide a counterexample to the widely accepted idea that one
cannot observe stable phases in one dimension (e.g., in the limit of infinitely long samples).
Though translational order in such packings should still not be stable, we observe evidence of
stable orientationally ordered phases, and further, we observe transitions from one phase to
an-other. We used orientational order parameters to locally identify helices of different pitch and
to discover how helical structures can transform between different local pitches and chiralities
prior to melting in a manner inconsistent with well-understood dislocation-mediated structural
transitions of athermal packings. This work has been published [94]. In Chapter 2 we discuss
the background, experimental challenges, results and analysis with greater depth than we have
1.2
Vibrational Signatures of Gel-like and Glassy Colloidal
Pack-ings
The relationship between the microscopic structure and macroscopic properties of a solid is an
exciting issue in the current study of disordered materials [4, 29, 36, 62, 142]. For example,
regions prone to mechanical failure are difficult to identify from structure alone in amorphous
solids, though they are readily apparent in crystalline solids as micro-structural defects and grain
boundaries [1]. Nevertheless, subtle structural signatures can be helpful for characterizing the
behavior of disordered materials. In fact, recent studies in disordered dense colloidal packings
have made progress identifying signs of structural order at the onset of the glass transition [152,
187], and identifying rearrangement-prone “soft spots” in glassy packings from quasi-localized
low-frequency vibrational modes [12, 13, 19, 42, 101, 165] and regions with smaller-than-average
local bond coordination [174].
Packings of particles with short-ranged attraction are typically described by two kinds of
dynamically arrested states [160, 181, 182]. The term “attractive glass” is used to denote a dense
packing of particles with uniform structure, while the term “gel” is used to describe a broad
class of sparse dynamically arrested packings. Despite such fundamentally different qualitative
descriptions, gels and attractive glasses are difficult to distinguish in systems with strong
inter-particle attractions and intermediate densities. Typically, gels are qualitatively distinguished
from glasses by obvious structural inhomogeneities, a task made very difficult in nearly uniform
packings. Additionally, gels share some dynamical traits of glassy materials, such as dynamical
heterogeneity [24], and a prevalence of low-frequency vibrational modes compared to ordered
U
(
In
te
r-p
a
r
cl
e
A
ra
c
o
n
)
Packing Fracon ф Gel
Repulsive Glass Aracve Glass Fluid/
Cluster Fluid
?
Dense Gel?
Dilute A. Glass?
Gel
Aracve
Glass
two-step rheological yielding [86], changes in slow relaxation times [182], scaling of bulk elastic
properties [183], and deviation of a phase boundary line from percolation theory [34]. However,
there has not yet been a distinct microstructural or localized dynamical signature of the
gel-to-glass crossover in a static experimental sample (i.e., a sample of thermal particles which is
dynamically arrested and not experiencing external shear) with strong inter-particle attractions.
Chapter 3 examines the crossover from glassy to gel-like dynamics and structure in
quasi-2D colloidal packings with short-ranged attraction. We create monolayers of bidisperse
micron-sized polystyrene colloids by exploiting a novel spreading behavior of binary water-lutidine
mixtures refined through careful experimentation. Using this method, we can track vibrations
in even the densest, most uniform glassy packings. Starting from these particle trajectories, we
apply a well-implemented method for calculating the vibrational density of states (vDOS) [18,
43,54,72] for the first time in spatially heterogeneous, attractive colloidal packings. The shape of
the resulting vDOS curves demonstrates a distinctive crossover from typically glassy behavior at
high area-fractions to curves demonstrating an excess of low-frequency vibrational modes below
a certain density threshold. The shape of the characteristically “gel-like” curves is attributed to
the appearance of frequency phonon modes localized to individual/small clusters of
low-coordination particles. Though the exact structures surrounding these individual particles are
not always the same, this vibrational behavior helps us to elucidate the microstructural origin
of the differences between attractive glasses and gels. This work is complete, and we are in the
1.3
Microscopic Ordering of Lyotropic Chromonic Liquid Crystals
While liquid crystals (LCs) have been extensively utilized in display technologies for the past
several decades, scientists and engineers are now turning to new implementations of this broad
class of materials for photonic, mechanical, and sensory applications. Many of these applications
require a sophisticated control of liquid crystalline order at the microscopic scale. For example,
recent mechanisms have been proposed that employ emulsion droplets of thermotropic LC’s as
highly sensitive sensors for endotoxins [93]. Further, recent theoretical studies have proposed
that films carefully assembled from tiles with liquid crystalline order and mechanical anisotropy
could form self-folding materials [107, 108]. Micropatterned polarizing materials from liquid
crystals are also crucial to the development of new holographic display technologies [102, 151].
Lyotropic chromonic liquid crystals (LCLCs) are a relatively unexplored class of anisotropic
fluids conducive to microscale self-assembly [98, 99, 150]. LCLCs are typically composed of
molecular aggregates of plank-like polyaromatic compounds with ionic side-groups in an
aque-ous suspension. As the concentration of such a suspension increases, the density and average
length of these aggregates increases, eventually forming a nematic (N) and then a columnar (M)
phase. These mesophases are thus significantly different from more commonly utilized
ther-motropic and amphiphilic lyotropic liquid crystals.
Because of their aqueous nature, low toxicity, and low cost, LCLCs are promising for
uti-lization in a variety of applications. Micropatterned films of LCLCs, specifically, have a wide
variety of emerging applications distinct from other types of liquid crystals, including
I
N
M
P A
Figure 1.3: Cross-polarizing image of a drying droplet of a dilute DSCG suspension, showing a low-to-high concentration gradient from image top to bottom. Illustrations depict molecular structure in corresponding isotropic (I, top), nematic (N, middle) and columnar (M, bottom) regions.
solar cells [115, 119], biosensors [144, 168], aqueous colloidal, nanotube and bacterial
assem-bly [38, 113, 120, 146, 188], and precursors to structured graphene-based materials [49, 110].
LCLCs also offer useful attributes for fundamental investigation of the effects of elasticity on
self-assembly behavior, since their elastic properties can be tuned via control of mesogen
con-centration [189], depletants, and ions [121]. Indeed, studies have demonstrated that LCLCs in
micro-scale confinement form unique, elastic-property-dependent configurations [64, 158].
In this thesis, we describe the manipulation of aqueous LCLC suspensions in an effort to
ob-serve novel finely tunable microstructure assemblies. Chapter 4 reviews and elaborates on our
published work examining the assembly of microstructure in LCLC films templated by
cylindri-cal micropost arrays [95]. A fundamental understanding of the detailed microstructure in these
films is enabled by a novel method for high-resolution director field determination that combines
polarizing microscopy, video microscopy and particle tracking techniques. This work is also
fa-cilitated by numerical free energy solutions for a liquid crystal under micropost confinement.
alignment/anchoring effect on nematic films, biasing a bistable alignment along lattice
diago-nals. Drying the film to the columnar state results in two classes of defect wall “tile” patterns,
i.e., depending on the type and initial concentration of the LCLC used. By pushing numerical
models for nematic LCLC’s to a columnar limit, and comparing our results with known
charac-teristics of nematic LCLC suspensions, it is shown that the difference in columnar patterns arises
from a competition of bend and splay elastic deformations as the nematic approaches the
colum-nar phase. A new method for templating microstructure in liquid crystal films by modulating
their elastic properties is thus discovered.
Chapter 5 describes additional preliminary work exploring novel LCLC configurations. It
was hoped that LCLCs may assemble into unique and useful configurations by placing them in
new microscale confinement geometries, as well as observing how they interact with ordered
am-phiphile structures. Indeed, both thin nematic LCLC films, with varying thickness and LCLCs,
confined to narrow cylinders, appear to demonstrate novel twisted configurations due to coupling
between nematic elastic deformations and confining surfaces. Additionally, dense
surfactant-based lyotropic LCs were observed to drive LCLC-forming molecules into columnar structures
which co-organize with the surrounding LC structure, and self-assembled diblock copolymer
vesicles were observed to deform in novel ways when suspended in nematic LCLCs. These
re-sults are not yet published, but they should serve as starting points for new and exciting studies
1.4
Organization of Thesis
This remainder of this thesis is organized into several chapters, each elaborating on the context,
theory, experimental details, and the results of the separate studies discussed above. Chapter
2 describes work on helical packings of thermoresponsive colloidal spheres in glass capillaries
which has been published [94]. Chapter 3 describes a study of the vibrational modes of
quasi-two dimensional attractive packings of colloidal spheres; this study is currently being written
and submitted for publication. Chapter 4 describes published work on elasticity-dependent
configurations of LCLC films in micropost arrays [95]. Additionally, the results of preliminary
(but unpublished) experiments on novel microstructured chromonic liquid crystal systems are
briefly summarized in Chapter 5; though unpublished, these experiments should nucleate future
work. Finally, Chapter 6 summarizes the results presented in previous chapters and elaborates
Chapter 2
Helical Packings and Phase
Transformations of Soft Spheres in
Cylinders
2.1
Introduction
“Crystalline” or “ordered” materials are composed of particles with even, periodic spacing over
large length scales. Long-range translational order is a common signature of stable solid phases
of matter, whether in ordered packings of the atoms in metals or colloidal spheres packed in a
FCC or BCC lattice. Such phases are common in three-dimensions (3D), though the physics of
(2D), for example, only display quasi-long-range translational order, and the uniformity of
par-ticle spacings decays algebraically over long distances [85, 117, 173]. One-dimensional
mate-rials are prohibited from exhibiting translationally ordered phases, as there exists no signficant
free energy barrier between translationally ordered and disordered phases [162], and ordered
phases themselves are unstable to fluctuations [126]. These concepts imply that ordered
one-dimensional materials are not stable, which would suggest the formation of crystalline nanowires
are problematic at best.
Order, however, is not necessarily restricted to the uniform spacing of particles as defined
by translational order. Orientational order, based on the local arrangments of particles rather
than their spacing, does not follow the same dimensional restrictions as translational order. For
example, two-dimensional crystals exhibit truly long-range orientational order, and proposed
two-dimensional phases with no translational order still exhibit quasi-long-range orientational
order [85, 117, 173]. Additionally, both quasi-crystals and liquid crystals are structured, stable
phases of matter which exhibit orientational order without regular spacings of constituent
parti-cles. Thus, a quasi-one dimensional (1D) material which exhibits some degree of orienational
order might demonstrate phases that are stable against thermal fluctuations.
To this end, packings of soft colloidal spheres in cylinders provide a fascinating and
use-ful model experimental system to quantitatively investigate order and phase transformations in
quasi-1D. At high densities, spheres in cylindrical confinement form helical crystalline
struc-tures [37, 53]. Such packings are observed in foams [9, 10, 132, 133], biological
Simulations suggest that transitions between different helical ordered states [84, 131] and
be-tween quasi-1D ordered and disordered states [33, 46, 61] should exist in thermal systems, but
such transitions have not been investigated experimentally. To date, research on this system class
has been limited to static snapshots and athermal media.
In this chapter, we explore ordered and disordered structures in a quasi-1D thermal system
of soft particles with adjustable diameter and volume fraction. In particular, we create helical
packings of thermoresponsive particles in glass microcapillaries. We show theoretically that
phases with long-range orientational order can exist in quasi-1D, and we demonstrate
experi-mentally that such phases with long-range orientational order exist at volume fractions below
maximal packing. Then, we study volume-fraction induced melting of these orientationally
or-dered phases into liquid phases. The orientational order parameters and susceptibilities that
char-acterize these phases and the crossover between phases are measured and analyzed. Coexisting
regions of ordered and disordered states and coexisting ordered domains with different pitch and
chirality are observed. Such coexistence effects suggest the presence of abrupt or discontinuous
volume-fraction driven transitions between the quasi-1D helical structures. Interestingly, these
orientationally ordered phases in quasi-1D share physical features with orientationally ordered
phases observed [51, 112, 184] and predicted [85, 117, 173] in 2D.
2.2
Contextual and Theoretical Background
2.2.1 Helical Packing Structures
From the placement of atoms in the alpha helix of a protein molecule, to the placement of
helices of discrete particles are common to find among quasi-linear structures of all sizes. In
the soft matter community, recent work has observed formation of helical structures via
self-assembly of micro- and nano-scale chiral filaments of bent-core molecules [60], and dipolar
Janus particles [56]. Despite the complicated self-assembled nature of such systems, complex
inter-particle interactions need not be required to form helical structures.
In fact, such helical structures are readily formed by isotropic particles confined to the
sur-face or interior of similarly sized cylinders. These structures have been found in experiments
with granular materials [53], foams [9, 10, 132, 133], colloidal suspensions [66, 92, 109, 161]
and carbon fullerenes [75, 171], as well as in computer simulations [33, 46, 61, 84, 131, 167].
When isotropic particles are packed into such a geometry, the resulting placement of particles
at the surface resembles a two-dimensional hexagonal or rhombic packing of circles on a plane
wrapped onto a cylinder (Fig. 2.1). The pitch of these structures at maximal packing is
deter-mined by the ratio of sphere diameter to the diameter of the confining cylinder. For athermal or
close packed structures, hexagonal surface packings occur only at discrete ratios of cylinder and
sphere diameter, with rhombic structures filling intermediate ratio geometries (Fig. 2.2).
A formal notation for distinguishing these geometries was originally developed to describe
phyllotactic structures [37, 53]. Hexagonal surface packings are given a three integer label
(𝑚, 𝑛, 𝑚 +𝑛), while rhombic packings have a two integer label (𝑚, 𝑛). These descriptors
include detailed information about the topology and geometry of these packings, and can be
interpreted in several ways. Most simply, if one looks at a single particle in the packing and
labels all other particles in the packing by their relative distance along the cylinder axis direction
![Figure 2.9: Confocal scans of a 6 휇TSM (a-b) and CLSM (c-d) scanning methods (taken from [87])](https://thumb-us.123doks.com/thumbv2/123dok_us/9368598.1470508/72.612.218.427.356.572/figure-confocal-scans-tsm-clsm-scanning-methods-taken.webp)