Body Composition in Adolescents
During Treatment With Selective
Serotonin Reuptake Inhibitors
Chadi A. Calarge, MD, a James A. Mills, MS, b Kathleen F. Janz, EdD, c Trudy L. Burns, PhD, d William H. Coryell, MD, b Babette S. Zemel, PhDeabstract
OBJECTIVES: To examine the independent contribution of major depressive disorder (MDD), generalized anxiety disorder (GAD), and selective serotonin reuptake inhibitors (SSRIs) to changes in body composition in older adolescents.
METHODS: Medically healthy 15- to 20-year-olds who were unmedicated or within 1 month of starting an SSRI were prospectively followed. Psychiatric functioning and medication treatment were assessed monthly. Body Mass Index (BMI) was measured every 4 months. Every 8 months, a whole-body dual-energy radiograph absorptiometry scan was obtained to determine lean BMI, fat mass index, and visceral fat mass. Linear mixed effects
regression analysis examined associations between MDD, GAD, and SSRI use variables and body composition measures.
RESULTS: Over 1.51 ± 0.76 years of follow-up, 264 participants contributed 805 observations. After adjusting for age, sex, physical activity, dietary intake, and time in the study, MDD severity was inversely associated, prospectively, with BMI, fat mass index, and lean BMI z
scores, whereas cumulative SSRI treatment duration and dose were positively associated with these outcomes. GAD severity and diagnosis were not significantly associated with any body composition outcome. Moreover, citalopram and escitalopram were most strongly associated with the increase in all body composition measures, including visceral fat mass, whereas the associations with fluoxetine were somewhat weaker. Sertraline was not different from no SSRI treatment.
CONCLUSIONS: Depression severity was associated with a decrease in measures of body composition in older adolescents over a mean of 1.5 years, whereas SSRI treatment was positively associated with these outcomes, with differential effects across treatment groups.
aMenninger Department of Psychiatry and Behavioral Sciences, Baylor College of Medicine, Houston, Texas; bDepartment of Psychiatry, cHealth and Human Physiology, College of Liberal Arts and Sciences, and dCollege
of Public Health, The University of Iowa, Iowa City, Iowa; and eDivision of Gastroenterology, University of
Pennsylvania, Philadelphia, Pennsylvania
Dr Calarge conceptualized and designed the study and drafted the initial manuscript; Mr Mills conducted the statistical analysis and reviewed and revised the manuscript; Drs Zemel, Janz, Burns, and Coryell contributed to data analysis and reviewed and revised the manuscript; Dr Coryell contributed to data collection; and all authors approved the final manuscript as submitted.
This trial has been registered at clinicaltrials.gov (identifier NCT02147184). DOI: https:// doi. org/ 10. 1542/ peds. 2016- 3943
Accepted for publication Apr 3, 2017
NIH
To cite: Calarge CA, Mills JA, Janz KF, et al. Body Composition in Adolescents During Treatment With Selective Serotonin Reuptake Inhibitors. Pediatrics.
2017;140(1):e20163943
WHaT’S KNOWN ON THIS SUBJECT: Depression and obesity are bidirectionally associated. This comorbidity compounds the morbidity associated with both conditions. However, the confounding effect of psychotropic agents has not been thoroughly investigated.
Obesity and major depressive disorder (MDD) are bidirectionally
associated.1–4 Dysregulation
of the hypothalamo-pituitary-adrenal axis, other endocrinologic abnormalities, autonomic nervous system dysfunction, subclinical inflammation, and lifestyle factors
have all been implicated.5, 6
Furthermore, most psychotropic
agents cause weight gain.4, 7 However,
longitudinal studies examining the association between obesity and MDD either failed to account for psychopharmacology or did not examine measures of adiposity beyond BMI (ie, body fat and visceral adiposity).8, 9
To disentangle the contribution of MDD from that of psychotropic agents to longitudinal changes in body composition, we used data collected in a 2-year prospective study examining the skeletal effects of selective serotonin reuptake inhibitors (SSRIs) in older
adolescents.10 We expected that both
MDD and the use of SSRIs would be independently associated with increased adiposity. Given the high comorbidity between MDD and generalized anxiety disorder (GAD), we further investigated whether GAD is independently associated with adiposity.
METHODS Participants
Fifteen- to twenty-year-old participants were recruited in this
observational study.10 Enrollment
was restricted to individuals not taking psychotropic agents or those who were within 1 month of starting an SSRI. Treatment with psychotropic agents other than SSRIs during the 2 years before study entry led to exclusion, with the exception of use of benzodiazepines, trazodone,
α2‐agonists, or psychostimulants
(dose stable for 2 months, n = 3).
Other exclusionary criteria included the presence of an eating
disorder, substance dependence, pregnancy, significant medical or surgical history, the chronic use of medications potentially affecting bone metabolism, or plans to move out of the state within a year.
Procedures
The local institutional review board approved the study and informed consent and assent were obtained. Participants completed the baseline visit and returned for a follow-up visit every 4 months for up to 2 years. Between in-person visits, they were contacted by phone monthly. At all encounters, participants were queried about their medical history and medication use. Adherence was based on self-report and pharmacy records. At every in-person visit, the Inventory of Depressive
Symptomatology (IDS), 11 the Beck
Depression Inventory (BDI-II), 12 the
Beck Anxiety Inventory (BAI), 13
and the modified version of the Physical Activity Questionnaire for
Adolescents14 were obtained. In
addition, height and weight were measured according to standard
procedures.10 Grip strength was
measured using a Jamar Plus hand dynamometer (model number:
12‐0604; Patterson Medical,
Bolingbrook, IL) as described
previously.10
At study entry and annually thereafter, participants completed the full-length Block Food Frequency Questionnaire (FFQ 2005.1;
NutritionQuest.com, Berkeley, CA). This was used to compute the Healthy Eating Index (http:// epi. grants. cancer. gov/ hei/ tools. html), a measure of conformance to the dietary guidelines we used to account for the possible contribution of dietary factors to changes in body composition. However, because dietary intake was assessed yearly but a dual-energy radiograph absorptiometry (DXA) scan was obtained every 8 months, dietary
data were available only for 57.3% of the visits.
At study entry and every 8 months, a whole-body DXA scan was obtained using a Hologic QDR DELPHI-4500A unit or a Hologic Discovery A unit (Hologic, Inc, Bedford, MA). The 2 DXA units were cross-calibrated and daily quality-control scans were
performed.10 The Hologic software
(APEX 4.0.1/13.4.1) determined total body less head lean and fat mass. The package also includes an automated algorithm to estimate visceral adipose tissue mass (VFat),
(grams).15 For some scans, manual
adjustment of the regions of interest was necessary, as recommended by the manufacturer.
Clinical diagnoses, which were based
on the Diagnostic and Statistical
Manual of Mental Disorders, Fourth Edition, Text Revision (DSM-IV-TR), 16
incorporated information from the review of medical records and the
self- and researcher‐completed
symptom rating scales, the Diagnostic
Interview Schedule for Children, 17
and an unstructured interview by a child psychiatrist. The severity of MDD and GAD was quantified for each week over the study period by using the Longitudinal Interval
Follow‐up Evaluation, 18 modified for
use with adolescents (A‐LIFE).10, 19
Statistical analysis
BMI was computed as weight/height2
(kg/m2), lean BMI (LBMI) as lean
mass/height2 (kg/m2), and fat mass
index (FMI) as fat mass/height2
(kg/m2) and age‐ and sex‐specific
z scores were generated.20, 21
To capture the change in the BDI-II and BAI, the mean score over the interim visits, up to and including the score at the visit when a DXA scan was obtained, was used as the predictor variable in the relevant models.
using Student’s t test for continuous
variables and χ2 test for categorical
variables.
The association between MDD, GAD, and SSRIs on the one hand and each
body composition measure (BMI z
score, FMI z score, LBMI z score, and
VFat) on the other was examined by using a linear mixed effects
regression.22 Different indices of
MDD and GAD were used, including
DSM-IV-TR–based diagnoses as
well as scale scores (Table 4). SSRI treatment was characterized in terms of duration of use and dose, accounting for adherence. Given that SSRI adherence was missing for only 2.6% of all observations, the expectation-maximization (EM) algorithm was used to impute the
missing values.23 All models included
adjustment for age (years) at study entry, sex, and level of physical activity (Table 4). Because neither energy intake (kilocalories) nor the
Healthy Eating Index (mean 60.5 ±
12.2, range: 32.6–92.6) significantly
contributed to any of the models
(all P values > 0.40), they were
excluded. Height (centimeters) was also included in the VFat analysis to account for differences in body size. Participant-specific random intercepts and slopes were used with an unstructured covariance matrix. Duration of study participation was the time metric in the analysis. Maximum likelihood methods were used for estimation, which yielded unbiased estimates under the assumption that the missing
data mechanism is ignorable.24 The
covariates of interest were analyzed as time-dependent covariates and decomposed into a between-subject
and a within-subject component.25
The former represents a cross-sectional effect, whereas the latter represents an individual slope effect. All hypothesis tests were 2-tailed with a significance level of P < .05, and analyses used procedures from SAS version 9.4 for Windows (SAS Institute Inc, Cary, NC).
RESULTS
Participants
A total of 279 participants enrolled in the study and provided 850 observations. After exclusions for psychosis and bipolar disorder, the timing of SSRI use, having a genetic condition or substance use disorder, and missing depression data, 264 adolescents with 805 observations were eligible for the analysis. As would be expected, participants in the SSRI group were more likely to have MDD and GAD and to score higher on all measures related to
these disorders (Table 1). They were also less likely to complete the
study (61% vs 80%, P = .0007). This
difference was also reflected in the
duration of study participation (1.4 ±
0.9 years vs 1.6 ± 0.7 years, Student’s
t test = 2.14, P < .04).
SSRI Treatment and Change in BMI z Score
On average, the BMI z score did not
significantly change across the entire sample over the course of the study (Tables 2 and 3). After controlling for the standard covariates, the scores on the IDS and BAI were inversely
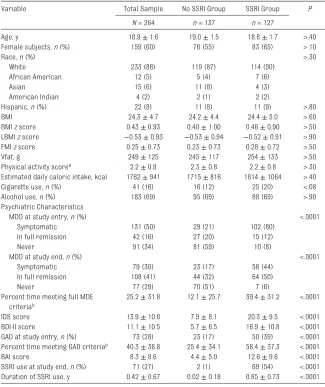
TaBLE 1 Baseline Demographic and Clinical Characteristics of the Participants as a group and Split on the Basis of SSRI Use at Study Entry (Mean ± SD, Unless Noted Otherwise)
Variable Total Sample No SSRI group SSRI group P
N = 264 n = 137 n = 127
Age, y 18.9 ± 1.6 19.0 ± 1.5 18.8 ± 1.7 >.40
Female subjects, n (%) 159 (60) 76 (55) 83 (65) >.10
Race, n (%) >.30
White 233 (88) 119 (87) 114 (90)
African American 12 (5) 5 (4) 7 (6)
Asian 15 (6) 11 (8) 4 (3)
American Indian 4 (2) 2 (1) 2 (2)
Hispanic, n (%) 22 (8) 11 (8) 11 (9) >.80
BMI 24.3 ± 4.7 24.2 ± 4.4 24.4 ± 5.0 >.60
BMI z score 0.43 ± 0.93 0.40 ± 1.00 0.46 ± 0.90 >.50 LBMI z score −0.53 ± 0.93 −0.53 ± 0.94 −0.52 ± 0.91 >.90 FMI z score 0.25 ± 0.73 0.23 ± 0.73 0.28 ± 0.72 >.50
Vfat, g 249 ± 125 245 ± 117 254 ± 133 >.50
Physical activity scorea 2.2 ± 0.8 2.3 ± 0.8 2.2 ± 0.8 >.30 Estimated daily caloric intake, kcal 1762 ± 941 1715 ± 816 1814 ± 1064 >.40
Cigarette use, n (%) 41 (16) 16 (12) 25 (20) <.08
Alcohol use, n (%) 183 (69) 95 (69) 88 (69) >.90
Psychiatric Characteristics
MDD at study entry, n (%) <.0001
Symptomatic 131 (50) 29 (21) 102 (80)
In full remission 42 (16) 27 (20) 15 (12)
Never 91 (34) 81 (59) 10 (8)
MDD at study end, n (%) <.0001
Symptomatic 79 (30) 23 (17) 56 (44)
In full remission 108 (41) 44 (32) 64 (50)
Never 77 (29) 70 (51) 7 (6)
Percent time meeting full MDE criteriab
25.2 ± 31.8 12.1 ± 25.7 39.4 ± 31.2 <.0001
IDS score 13.9 ± 10.8 7.9 ± 8.1 20.3 ± 9.5 <.0001
BDI-II score 11.1 ± 10.5 5.7 ± 6.5 16.9 ± 10.8 <.0001 gAD at study entry, n (%) 73 (28) 23 (17) 50 (39) <.0001 Percent time meeting gAD criteriab 40.3 ± 38.8 25.4 ± 34.1 56.4 ± 37.3 <.0001
BAI score 8.3 ± 8.6 4.4 ± 5.0 12.6 ± 9.6 <.0001
SSRI use at study end, n (%) 71 (27) 2 (1) 69 (54) <.0001 Duration of SSRI use, y 0.42 ± 0.67 0.02 ± 0.18 0.85 ± 0.73 <.0001
BDI-II, Beck Depression Inventory (Second Edition). a Physical activity score 1 = low, 5 = high.
b Percent time meeting full MDE or gAD criteria captures the percentage of weeks in which the participant met DSM-IV-TR
associated with changes in BMI
z scores, whereas the duration of
exposure to SSRIs and the cumulative dose during the interim period between DXA scans were positively associated with the changes in BMI
z scores (Table 4). When both the
IDS score and cumulative SSRI dose were concurrently entered in the model, both remained significantly associated with changes in BMI
z scores, but in opposite directions
(within-subject effect β = −.006,
SE = 0.002, P < .002 and within-subject
effect β = .120, SE = 0.044, P < .007, respectively). In contrast, when both the BAI score and the cumulative SSRI dose were concurrently entered in the model, only the latter was significantly associated with a change
in BMI z scores (within-subject effect
β = .132, SE = 0.044, P < .003).
SSRI Treatment and Body Composition
Next, we examined whether MDD, GAD, or SSRI treatment differentially
affect the body’s composition. Both
FMI and LBMI z scores significantly
increased over the study period (Tables 2 and 3). After adjusting for the standard covariates, the duration of use and the dose of SSRIs were both positively associated with
increased FMI and LBMI z scores
(Table 4). This association remained significant after accounting for the effect of the IDS score, which was negatively associated with these
outcomes (for FMI z score:
within-subject IDS score effect β = −.003,
SE = 0.001, P < .03 and within-subject
SSRI dose effect β = .089, SE = 0.035,
P < .02; for LBMI z score:
within-subject IDS score effect β = −.005,
SE = 0.002, P < .007 and within-subject
SSRI dose effect β = .093, SE = 0.041,
P < .03). When the models predicting
FMI and LBMI z scores were also
adjusted for LBMI and FMI z scores,
respectively, the within-subject SSRI effect became nonsignificant, suggesting that the increase in the 2 indices was proportional.
When both the BAI score and the cumulative SSRI dose given during the interim period between DXA
scans were concurrently entered in the model, only the latter was significantly associated with
change in FMI and LBMI z scores
(within-subject effect β = .093, SE =
0.035, P < .009 and within-subject
effect β = .103, SE = 0.041, P < .02, respectively).
To test whether the observed
increase in LBMI z score was indeed
because of an increase in muscle mass, we examined the prospective effect of SSRI use on grip strength.
After adjusting for age (P > .80), sex
(P < .0001), height (P < .0001), and
time in the study (P < .0001), neither
the within-subject effect of duration of SSRI treatment nor its between-subject effect was significantly associated with grip strength (β = −3.59, SE = 3.09, P = .2463
and β = −1.54, SE = 0.84, P = .0688,
respectively).
SSRI Treatment and Visceral adiposity
VFat also significantly increased over the course of the study (Tables 2 and 3). After adjusting for the standard covariates, plus height, SSRI treatment was positively associated, albeit not significantly, with an increase in visceral fat mass (Table 4).
SSRI Treatment and Height
Both height and height z score
increased during the study (Tables 2 and 3). After adjusting for the standard covariates, SSRI treatment duration, but not the IDS score
(P > .60), was inversely associated
with change in height z score
(within-subject effect β = −.041, SE = 0.021,
P < .05).
TaBLE 2 Change Between Baseline and Final Visit in Anthropometric and Body Composition Variables Across the Entire Sample (Mean ± SD, Median [Interquartile Range])
Mean ± SD Median (IQR) Signed Rank S P
Wt, kg 1.95 ± 6.29 0.55 (5.30) 4938.5 <.0001
Wt percentile 1.2 ± 10.5 0.0 (8.1) 1973.5 <.03
Wt z score 0.05 ± 0.38 0.00 (0.39) 2353.5 <.01
BMI 0.58 ± 2.16 0.05 (1.81) 4244.5 <.0001
BMI percentile 0.9 ± 12.5 0.0 (9.0) 1284.5 >.10
BMI z score 0.04 ± 0.42 0.00 (0.40) 1575.5 <.09
FMI z score 0.04 ± 0.35 0.00 (0.32) 2167.5 <.02
LBMI z score 0.11 ± 0.39 0.01 (0.46) 3297 <.0001
Visceral fat, g 8.4 ± 72.8 0.0 (50.1) 2066.5 <.03
Height, cm 0.4 ± 0.9 0.1 (0.9) 5442.5 <.0001
Height percentile 0.5 ± 3.8 0.0 (3.0) 1506.5 <.10
Height z score 0.02 ± 0.13 0.00 (0.13) 1968.5 <.03
IQR, interquartile range.
Sex Effect
Next, we examined the interaction effect between sex and SSRI-related variables. There was no evidence for a sex difference in the effect of SSRI treatment duration on LBMI
and height z scores or VFat (all
P values > .10). In contrast, male
participants showed a larger increase than female participants in BMI and
FMI z scores over a more extended
SSRI treatment period (β = .31,
SE = 0.12, P < .01 and β = .23, SE = 0.10,
P < .02, respectively).
Differences Between Individual Drugs
Given that the majority of SSRI-treated participants used 1 of 4 drugs (Table 5), a categorical variable was created to denote which drug, including no use of a drug, that each participant received. Citalopram and escitalopram were grouped together and participants taking other drugs (eg, paroxetine) were excluded, given their small number.
The previous models were rerun with this new SSRI-type variable to determine if differences between individual agents existed. After controlling for the standard covariates (and height for VFat), significant differences emerged (Table 6). Citalopram and escitalopram were associated with the largest increases in body composition measures compared with no SSRI treatment, whereas sertraline was associated with no significant change and
fluoxetine’s effect was intermediate.
DISCUSSION
To our knowledge, this is the first longitudinal study to examine the
independent effect of MDD, GAD, and SSRI treatment on body composition changes in older adolescents. In contrast to our prediction, some MDD measures were inversely correlated with changes in body composition and GAD did not exert a measurable independent effect. In contrast, SSRI treatment predicted an increase in all outcomes. This effect appeared to vary among individual agents. A large and growing number of studies have found MDD to be
associated with increased adiposity.26
In fact, using the baseline data from this same sample, we found an interaction effect between MDD and weight, whereby overweight or obese individuals with MDD had
TaBLE 4 Parameter Estimates (SEs) for Depression-, SSRI-, and Anxiety-Related Variables From Linear Mixed Effects Regression Analysis Models for Age-Sex–Specific BMI, FMI, and LBMI z scores and for VFat (grams)
BMI z Score FMI z Score LBMI z Score VFat
Depression
Current depression status, continuous −0.010 (0.010) −0.008 (0.008) −0.013 (0.009) −0.99 (1.53) Depression trend, continuous −0.073 (0.075) −0.020 (0.057) −0.130 (0.072)** −3.64 (9.70) Weeks in MDE, within-subject effect −0.000 (0.002) 0.001 (0.001) 0.001 (0.001) −0.43 (0.24)** Weeks in MDE, between-subject effect −0.008 (0.007) −0.003 (0.005) −0.006 (0.006) −0.09 (0.85) Mean BDI-II score, within-subject effect −0.001 (0.002) −0.001 (0.002) −0.002 (0.002) −0.16 (0.36) Mean BDI-II score, between-subject effect −0.006 (0.007) −0.002 (0.005) −0.008 (0.007) −0.21 (0.91) IDS score, within-subject effect −0.007 (0.002)* −0.004 (0.001)* −0.005 (0.002)* −0.38 (0.30) IDS score, between-subject effect −0.007 (0.007) −0.005 (0.005) −0.008 (0.006) −0.69 (0.86) SSRI use
SSRI indicator 0.056 (0.041) 0.051 (0.033) 0.032 (0.039) 11.38 (6.55)**
SSRI use, within-subject effect 0.222 (0.073)* 0.151 (0.058)* 0.241 (0.069)* 15.17 (11.80) SSRI use, between-subject effect 1.097 (0.387)* 0.920 (0.291)* 0.974 (0.379)* 128.76 (49.79)* SSRI dose, within-subject effect 0.140 (0.043)* 0.100 (0.035)* 0.108 (0.041)* 12.58 (7.11)**
SSRI dose, between-subject effect 0.319 (0.222) 0.256 (0.167) 0.322 (0.217) 27.40 (28.59)
Anxiety
Weeks with gAD, within-subject effect −0.002 (0.001)** −0.001 (0.001) −0.002 (0.001)** −0.33 (0.17)** Weeks with gAD, between-subject effect −0.001 (0.005) −0.001 (0.004) 0.003 (0.005) 0.05 (0.64) Mean BAI score, within-subject effect −0.005 (0.002)* −0.004 (0.002)* −0.004 (0.002) −0.55 (0.39) Mean BAI score, between-subject effect 0.001 (0.008) 0.003 (0.006) −0.003 (0.008) −0.04 (1.10)
The base model included the following “standard covariates”: baseline age, sex, physical activity, and time in the study (in addition to height, for the VFat models). All models included the standard covariates in addition to the predictor specified in each model. Current depression status included: 0 = never depressed, 1 = full remission, 2 = remitting, 3 = partial remission, 4 = relapse, 5 = MDE. Depression trend reflects whether over the course of the study, the clinical course was one of improvement (1), decline (2), or no symptoms (0). Weeks in MDE and weeks in gAD reflect the percentage of weeks in which the participant met DSM-IV-TR criteria for a MDE or gAD, on the basis of the Longitudinal Interview Follow-up Evaluation for Adolescents (A-LIFE). SSRI use reflects aggregate use between visits, in years. SSRI dose reflects the cumulative dose of SSRI taken by participants. Both SSRI use and dose were adjusted for adherence as captured by self-report and pharmacy records.
*P < .05. **P < .10.
TaBLE 5 Number (%) of Participants on Individual Drugs Across Different Research Visits Citalopram or Escitalopram Fluoxetine Sertraline No SSRI
Study entrya 51 (19) 36 (14) 36 (14) 137 (52)
Visit 8 mo 17 (10) 19 (11) 18 (10) 124 (79)
Visit 16 mo 8 (6) 8 (6) 11 (8) 118 (81)
Visit 24 mo 9 (5) 7 (4) 14 (8) 150 (83)
more visceral and subcutaneous
fat.27 More importantly, despite some
inconsistencies, longitudinal studies have generally found that MDD predicts the development of obesity over time, regardless of age, sex, or
racial and ethnic background.1, 8, 28
When MDD was categorically defined in our sample (ie, as defined in the DSM-IV-TR), it failed to predict
changes in BMI z score. Even when
we divided the participants on the basis of their trend of change in symptoms over the study course (ie, no change, improving toward remission, etc), we again found no association. Only the score on the researcher-completed IDS reached statistical significance, and this was actually in a direction opposite to our prediction: namely, a more severe depression was associated with weight loss. MDD may be associated with increased
or decreased appetite and weight.29
In fact, other researchers have
shown that considering patients’
symptoms is important in
examining the association between
MDD and weight gain.8 Oftentimes,
increased appetite in MDD is associated with the atypical subtype. However, the prevalence of MDD with atypical features in our
participants was low, 27 perhaps
explaining the inverse association between MDD and depression that we observed.
Most prospective studies examining the association of MDD and obesity did not thoroughly account for
psychotropic use.30–34 This is a
critical shortcoming, given their potential to cause weight gain.8, 9, 35, 36
In addition, even studies that assessed psychopharmacology did so often in a cursory way (eg, querying the patient about use in 6-month
intervals or in the 2–4 weeks before
the study visit, etc).8, 37–42 If
depression severity is associated with weight gain and with
likelihood of psychotropic use, and if antidepressants cause weight gain, then detailed assessment of treatment is necessary to disentangle one from the other.
In fact, both duration of SSRI use as well as the cumulative dose were positively associated with the body composition measures, which suggests that the effect may be dose-dependent. Of course, SSRI use may be an index of psychopathology severity (ie, more severe cases are prescribed SSRIs) and, therefore, what might appear as an association between SSRI use and weight gain is merely an association between severe MDD or GAD and weight gain (ie, confounding by indication). However, it is important to note that being prescribed an SSRI was not by itself a significant predictor (Table 4). This is also consistent with the lack of a significant association between depression trends and changes in adiposity measures. Finally, when each of the 2 depression indices were entered in the models concurrently with SSRI use, both remained significant and were associated with the outcomes in an inverse direction.
Although the clinical utility of
BMI is well established, 20 it fails
to distinguish between lean mass, an index of physical fitness, and fat mass, a cardiovascular risk
factor.43 Thus, taking advantage of
the availability of DXA scans in our study, we examined fat and lean mass separately. To our surprise, SSRI use was positively associated with both outcome variables in a similar manner. When we specifically focused on VFat, the association with SSRI use remained positive, albeit weaker. This suggests that over extended periods of use, SSRIs will cause an overall increase in BMI, comprising an increase in both fat and lean mass. Importantly, this is also associated with an increase in VFat, which is particularly
detrimental to health.44 Notably,
this association cannot be attributed to lifestyle factors, such as physical activity or dietary factors, or to differences in body size (in the case of VFat), which we accounted for. It may be due to a drug-induced increase in sympathetic nervous
system activity, 45 as has been shown
recently in mice treated chronically with fluoxetine, although the same
was not true for citalopram.46
DXA-based measurement of lean body mass is indirectly determined by subtracting bone and fat mass from overall mass. Thus, it comprises
muscle and water mass.47 Given that
grip strength did not significantly increase during SSRI treatment, it is likely that the increase in lean body mass primarily reflects an increase
TaBLE 6 Differences in the Parameter Estimates (SEs) for SSRI Type From Linear Mixed Effects Regression Analysis Models for Body Composition Measures BMI z Score FMI z Score LBMI z Score VFat Height z Score Citalopram versus no SSRI slope 0.24 (0.06)*** 0.20 (0.05)*** 0.21 (0.05)*** 34.9 (9.9)*** −0.03 (0.02) Fluoxetine versus no SSRI slope 0.14 (0.07)** 0.13 (0.06)** 0.13 (0.06)** 29.6 (11.3)** −0.04 (0.02)* Sertraline versus no SSRI slope 0.04 (0.06) 0.05 (0.04) 0.05 (0.05) 8.6 (9.0) −0.01 (0.02) Citalopram versus sertraline slope 0.20 (0.08)** 0.15 (0.06)** 0.17 (0.07)** 26.3 (12.5)** −0.02 (0.03) Fluoxetine versus sertraline slope 0.10 (0.08) 0.08 (0.07) 0.08 (0.08) 21.1 (13.7) −0.03 (0.03) Citalopram versus fluoxetine slope 0.10 (0.09) 0.07 (0.07) 0.08 (0.08) 5.3 (14.1) 0.01 (0.03)
Citalopram group included participants on citalopram or escitalopram. *P < .10.
in water volume. This is possible given that SSRIs have been associated with the syndrome of inappropriate
antidiuretic hormone secretion.48
In addition, our participants had
a low LBMI z score, although their
BMI was greater than normal (Table 1). Thus, there may have been some increase in muscle mass to carry the additional (fat) weight associated with the initiation of SSRIs. Of note, LBMI
z score was also less than average in
the Iowa Bone Development Study
(mean ∼−0.3; T.L. Burns, PhD,
personal communication, 2017), suggesting this may be due, at least in part, to differences in calibration across Hologic imaging units for whole body scans.
The set of primary analyses combined all SSRIs together to optimize
sample size. However, when the most commonly used SSRIs were compared, citalopram or escitalopram were associated with the largest increase in body composition measures, whereas sertraline was no different from no SSRI treatment. Fluoxetine, on the other hand, was associated with significant increases, albeit of smaller magnitude. The citalopram and escitalopram results are consistent with findings from the Treatment of Resistant Depression in Adolescence (TORDIA) study in which citalopram and paroxetine showed a larger increase in BMI over 24 weeks when compared with fluoxetine and
venlafaxine.9 However, the magnitude
of change we observed was larger likely because our follow-up period was nearly 3 times as long as that in the TORDIA study and because, by design, our participants had not taken psychotropic agents for at least 2 years before study entry. This also likely explains why fluoxetine was associated with weight gain in this study but not in the TORDIA study.
Finally, although the participants grew only by 0.4 cm during the study period, which is to be
expected given their age, SSRI use was still found to negatively impact longitudinal growth. Notably, the largest association was with fluoxetine (Table 6), consistent with findings from an
intermediate-term randomized clinical trial.49
Additionally, SSRIs have been reported to disrupt hormonal signaling, decreasing longitudinal
growth.50 This finding needs
replication in younger individuals, for whom the implications could be more significant given their potential to grow.
This study’s novel findings
should be considered in light of its limitations. First, although the sample is relatively sizeable given the detailed assessment, the study may have still been underpowered to detect a significant effect of MDD or GAD (categorically defined), independently of SSRI use. Notably, however, most estimates in the models suggested an inverse association with the outcome measures. Similarly, a larger sample could have allowed stratifying the analyses by sex, race, and ethnicity in a randomized placebo-controlled design. Furthermore, although we attempted to track symptom severity and medication adherence closely, these variables are difficult to capture accurately over extended periods
of time.51 Finally, we documented
dietary information and physical activity on the basis of self-report, a method with known shortcomings. Future studies could make use of state-of-the-art methods to collect such information in real time. They could also directly measure muscle mass as well as serum sodium and osmolality to more thoroughly examine the effect of SSRIs on muscle mass.
CONCLUSIONS
In this longitudinal study of older adolescents, depression severity was associated with a reduction in weight
over time, whereas SSRI use was associated with an increase in weight over time. This was particularly true for citalopram, escitalopram, and fluoxetine, which is notable given that fluoxetine and escitalopram are the only 2 drugs approved for treatment of MDD in youth, with the latter being favored in medically-ill adolescents given its low propensity to cause drug-drug interactions. Importantly, this led to an increase in VFat, which may account for the elevated incidence of cardiovascular disease observed in patients with MDD. The reason for sex-related differences in the treatment effect on body composition warrants further investigation. Future research should also explore mechanisms as well as interventions to attenuate these treatment effects.
aCKNOWLEDgMENTS
The authors would like to thank the participants and their families, as well as the research team.
aBBREVIaTIONS
BAI: Beck Anxiety Inventory
DSM-IV-TR: Diagnostic and
Statistical Manual of Mental Disorders, Fourth Edition, Text Revision
DXA: dual-energy radiograph absorptiometry
FMI: fat mass index GAD: generalized anxiety
disorder
IDS: Inventory of Depressive Symptomatology LBMI: lean BMI
MDD: major depressive disorder MDE: major depressive episode SSRI: selective serotonin
reuptake inhibitors TORDIA: Treatment of Resistant
Depression in Adolescence VFat: visceral adipose tissue
REfERENCES
1. Luppino FS, de Wit LM, Bouvy PF, et al. Overweight, obesity, and depression: a systematic review and meta-analysis of longitudinal studies. Arch Gen Psychiatry. 2010;67(3):220–229 2. Marmorstein NR, Iacono Wg, Legrand L.
Obesity and depression in adolescence and beyond: reciprocal risks. Int J Obes. 2014;38(7):906–911 3. Mühlig Y, Antel J, Föcker M,
Hebebrand J. Are bidirectional associations of obesity and depression already apparent in childhood and adolescence as based on high-quality studies? A systematic review. Obes Rev. 2016;17(3):235–249
4. Pratt LA, Brody DJ. Depression and obesity in the U.S. adult household population, 2005-2010. NCHS Data Brief. 2014;(167):1–8
5. van Reedt Dortland AK, Vreeburg SA, giltay EJ, et al. The impact of stress systems and lifestyle on dyslipidemia and obesity in anxiety and depression.
Psychoneuroendocrinology. 2013;38(2):209–218
6. Wurtman JJ, Wurtman RJ. Depression can beget obesity can beget depression. J Clin Psychiatry. 2015;76(12):e1619–e1621
7. Ruetsch O, Viala A, Bardou H, Martin P, Vacheron MN. Psychotropic drugs induced weight gain: a review of the literature concerning epidemiological data, mechanisms and management [in French]. Encephale. 2005;31(4 pt 1):507–516
8. gibson-Smith D, Bot M, Milaneschi Y, et al. Major depressive disorder, antidepressant use, and subsequent 2-year weight change patterns in the Netherlands Study of Depression
and Anxiety. J Clin Psychiatry. 2016;77(2):e144–e151
9. Mansoor B, Rengasamy M, Hilton R, et al. The bidirectional relationship between body mass index and treatment outcome in adolescents with treatment-resistant depression.
J Child Adolesc Psychopharmacol. 2013;23(7):458–467
10. Calarge CA, Butcher BD, Burns TL, Coryell WH, Schlechte JA, Zemel BS. Major depressive disorder and bone mass in adolescents and young adults. J Bone Miner Res. 2014;29(10):2230–2237
11. Rush AJ, gullion CM, Basco MR, Jarrett RB, Trivedi MH. The Inventory of Depressive Symptomatology (IDS): psychometric properties. Psychol Med. 1996;26(3):477–486
12. Beck AT. Depression: Clinical,
Experimental, and Theoretical Aspects. New York, NY: Harper & Row; 1967
13. Beck AT, Epstein N, Brown g, Steer RA. An inventory for measuring clinical anxiety: psychometric properties. J Consult Clin Psychol. 1988;56(6):893–897
14. Janz KF, Lutuchy EM, Wenthe P, Levy SM. Measuring activity in children and adolescents using self-report: PAQ-C and PAQ-A. Med Sci Sports Exerc. 2008;40(4):767–772
15. Micklesfield LK, goedecke JH, Punyanitya M, Wilson KE, Kelly TL. Dual-energy X-ray performs as well as clinical computed tomography for the measurement of visceral fat. Obesity (Silver Spring). 2012;20(5):1109–1114 16. American Psychiatric Association.
Diagnostic and Statistical Manual of Mental Disorders, Text Revision. 4th ed.
Washington, DC: American Psychiatric Association; 2000
17. Shaffer D, Fisher P, Lucas CP, Dulcan MK, Schwab-Stone ME. NIMH Diagnostic Interview Schedule for Children Version IV (NIMH DISC-IV): description, differences from previous versions, and reliability of some common diagnoses. J Am Acad Child Adolesc Psychiatry. 2000;39(1):28–38 18. Keller MB, Lavori PW, Friedman B,
et al. The Longitudinal Interval Follow-up Evaluation. A comprehensive method for assessing outcome in prospective longitudinal studies.
Arch Gen Psychiatry. 1987;44(6): 540–548
19. Birmaher B, Axelson D, Strober M, et al. Clinical course of children and adolescents with bipolar spectrum disorders. Arch Gen Psychiatry. 2006;63(2):175–183
20. Ogden CL, Kuczmarski RJ, Flegal KM, et al. Centers for Disease Control and Prevention 2000 growth charts for the United States: improvements to the 1977 National Center for Health Statistics version. Pediatrics. 2002;109(1):45–60
21. Weber DR, Moore RH, Leonard MB, Zemel BS. Fat and lean BMI reference curves in children and adolescents and their utility in identifying excess adiposity compared with BMI and percentage body fat. Am J Clin Nutr. 2013;98(1):49–56
22. Verbeke g, Molenberghs g. Linear Mixed Models for Longitudinal Data. New York, NY: Springer; 2000
23. graham JW. Missing data analysis: making it work in the real world. Annu Rev Psychol. 2009;60(1):549–576
Address correspondence to Chadi A. Calarge, MD, Menninger Department of Psychiatry and Behavioral Sciences, Baylor College of Medicine, 1102 Bates Ave, Suite 790, Houston, TX 77030. E-mail: chadi.calarge@bcm.edu
PEDIATRICS (ISSN Numbers: Print, 0031-4005; Online, 1098-4275). Copyright © 2017 by the American Academy of Pediatrics
fINaNCIaL DISCLOSURE: The authors have indicated they have no financial relationships relevant to this article to disclose.
fUNDINg: This work was funded by the National Institute of Mental Health (R01MH090072) and the National Center for Research Resources (2UL1TR000442-06). The content is solely the responsibility of the authors and does not necessarily represent the official views of the funding agencies. Funded by the National Institutes of Health (NIH).
24. Little RJA, Rubin DB. Statistical Analysis With Missing Data. New York, NY: Wiley; 2002
25. Fitzmaurice gM, Laird NM, Ware JH. Applied Longitudinal Analysis. Hoboken, NJ: Wiley; 2011
26. de Wit L, Luppino F, van Straten A, Penninx B, Zitman F, Cuijpers P. Depression and obesity: a meta-analysis of community-based studies.
Psychiatry Res. 2010;178(2):230–235 27. Coryell WH, Butcher BD, Burns TL,
Dindo LN, Schlechte JA, Calarge CA. Fat distribution and major depressive disorder in late adolescence. J Clin Psychiatry. 2016;77(1):84–89 28. Mannan M, Mamun A, Doi S,
Clavarino A. Prospective associations between depression and obesity for adolescent males and females- a systematic review and meta-analysis of longitudinal studies. PLoS One. 2016;11(6):e0157240
29. American Psychiatric Association.
Diagnostic and Statistical Manual of Mental Disorders. 5th ed. Washington, DC: American Psychiatric Association; 2013
30. Bardone AM, Moffitt TE, Caspi A, Dickson N, Stanton WR, Silva PA. Adult physical health outcomes of adolescent girls with conduct disorder, depression, and anxiety. J Am Acad Child Adolesc Psychiatry. 1998;37(6):594–601
31. Barefoot JC, Heitmann BL, Helms MJ, Williams RB, Surwit RS, Siegler IC. Symptoms of depression and changes in body weight from adolescence to mid-life. Int J Obes Relat Metab Disord. 1998;22(7):688–694
32. Pine DS, Cohen P, Brook J, Coplan JD. Psychiatric symptoms in adolescence as predictors of obesity in early adulthood: a longitudinal study. Am J Public Health. 1997;87(8):1303–1310 33. Roberts RE, Deleger S, Strawbridge
WJ, Kaplan gA. Prospective association between obesity and depression:
evidence from the Alameda County Study. Int J Obes Relat Metab Disord. 2003;27(4):514–521
34. van gool CH, Kempen gI, Bosma H, van Boxtel MP, Jolles J, van Eijk JT. Associations between lifestyle and depressed mood: longitudinal results from the Maastricht Aging Study. Am J Public Health. 2007;97(5):887–894 35. Fava M. Weight gain and
antidepressants. J Clin Psychiatry. 2000;61(suppl 11):37–41
36. Reekie J, Hosking SP, Prakash C, Kao KT, Juonala M, Sabin MA. The effect of antidepressants and antipsychotics on weight gain in children and adolescents. Obes Rev. 2015;16(7):566–580
37. Anderson SE, Cohen P, Naumova EN, Jacques PF, Must A. Adolescent obesity and risk for subsequent major depressive disorder and anxiety disorder: prospective evidence.
Psychosom Med. 2007;69(8):740–747 38. Hasler g, Pine DS, Kleinbaum Dg,
et al. Depressive symptoms during childhood and adult obesity: the Zurich Cohort Study. Mol Psychiatry. 2005;10(9):842–850
39. Koponen H, Jokelainen J, Keinä nen-Kiukaanniemi S, Kumpusalo E, Vanhala M. Metabolic syndrome predisposes to depressive symptoms: a population-based 7-year follow-up study. J Clin Psychiatry. 2008;69(2):178–182 40. Pine DS, goldstein RB, Wolk S,
Weissman MM. The association between childhood depression and adulthood body mass index. Pediatrics. 2001;107(5):1049–1056
41. Richardson LP, Davis R, Poulton R, et al. A longitudinal evaluation of adolescent depression and adult obesity. Arch Pediatr Adolesc Med. 2003;157(8):739–745
42. Vogelzangs N, Kritchevsky SB, Beekman AT, et al. Depressive symptoms and change in abdominal obesity in older persons. Arch Gen Psychiatry. 2008;65(12):1386–1393
43. Romero-Corral A, Somers VK, Sierra-Johnson J, et al. Accuracy of body mass index in diagnosing obesity in the adult general population. Int J Obes. 2008;32(6):959–966 44. Després JP. Body fat distribution
and risk of cardiovascular disease: an update. Circulation. 2012;126(10):1301–1313
45. Lambert EA, Straznicky NE, Dixon JB, Lambert gW. Should the sympathetic nervous system be a target to improve cardiometabolic risk in obesity?
Am J Physiol Heart Circ Physiol. 2015;309(2):H244–H258
46. Ortuño MJ, Robinson ST, Subramanyam P, et al. Serotonin-reuptake inhibitors act centrally to cause bone loss in mice by counteracting a local anti-resorptive effect. Nat Med. 2016;22(10):1170–1179
47. Krueger D, Siglinsky E, Buehring B, Binkley N. Total body less head measurement is most appropriate for lean mass assessment in adults. J Clin Densitom. 2017;20(1):128–129 48. De Picker L, Van Den Eede F,
Dumont g, Moorkens g, Sabbe Bg. Antidepressants and the risk of hyponatremia: a class-by-class review of literature. Psychosomatics. 2014;55(6):536–547
49. Emslie gJ, Heiligenstein JH, Hoog SL, et al. Fluoxetine treatment for prevention of relapse of depression in children and adolescents: a double-blind, placebo-controlled study. J Am Acad Child Adolesc Psychiatry. 2004;43(11):1397–1405
50. Weintrob N, Cohen D, Klipper-Aurbach Y, Zadik Z, Dickerman Z. Decreased growth during therapy with selective serotonin reuptake inhibitors. Arch Pediatr Adolesc Med. 2002;156(7):696–701
DOI: 10.1542/peds.2016-3943 originally published online June 16, 2017;
2017;140;
Pediatrics
Coryell and Babette S. Zemel
Chadi A. Calarge, James A. Mills, Kathleen F. Janz, Trudy L. Burns, William H.
Reuptake Inhibitors
Body Composition in Adolescents During Treatment With Selective Serotonin
Services
Updated Information &
http://pediatrics.aappublications.org/content/140/1/e20163943 including high resolution figures, can be found at:
References
http://pediatrics.aappublications.org/content/140/1/e20163943#BIBL This article cites 45 articles, 5 of which you can access for free at:
Subspecialty Collections
y_sub
http://www.aappublications.org/cgi/collection/psychiatry_psycholog
Psychiatry/Psychology
following collection(s):
This article, along with others on similar topics, appears in the
Permissions & Licensing
http://www.aappublications.org/site/misc/Permissions.xhtml in its entirety can be found online at:
Information about reproducing this article in parts (figures, tables) or
Reprints
DOI: 10.1542/peds.2016-3943 originally published online June 16, 2017;
2017;140;
Pediatrics
Coryell and Babette S. Zemel
Chadi A. Calarge, James A. Mills, Kathleen F. Janz, Trudy L. Burns, William H.
Reuptake Inhibitors
Body Composition in Adolescents During Treatment With Selective Serotonin
http://pediatrics.aappublications.org/content/140/1/e20163943
located on the World Wide Web at:
The online version of this article, along with updated information and services, is
by the American Academy of Pediatrics. All rights reserved. Print ISSN: 1073-0397.
![TaBLE 2 Change Between Baseline and Final Visit in Anthropometric and Body Composition Variables Across the Entire Sample (Mean ± SD, Median [Interquartile Range])](https://thumb-us.123doks.com/thumbv2/123dok_us/9372330.1470737/4.585.45.544.641.719/change-baseline-anthropometric-composition-variables-sample-median-interquartile.webp)


