Native Fish:
Development and Application of the
River Values Assessment System
(RiVAS and RiVAS+) Method to the
Gisborne District Council Region
LEaP Research Paper No. 10
March 2012
Native Fish:
Development and Application of the River Values Assessment
System (RiVAS and RiVAS+) Method to the Gisborne District
Council Region
Joanne Clapcott
Dave West
Jane Goodman
Eric Goodwin
Rebecca Lander
John Lucas
Dennis Crone
Paul Murphy
Murray Palmer
Ken F.D. Hughey
Land Environment and People Research Paper No. 10
March 2012
ISSN 2230-4207 (online)
ISBN 978-0-86476-297-9 (online)
Acknowledgements
This work was funded by the Foundation for Science, Research and Technology as part of the project ‘Developing a significance classification framework for water body uses and values’ (Envirolink grant 1012-GSDC92).
We also thank Mike Joy from Massey University and Alton Perrie from Greater Wellington Regional Council for their earlier input to this project.
©LEaP, Lincoln University, New Zealand 2012 Contacts - email: [email protected]
web: http://www.lincoln.ac.nz/leap
This information may be copied or reproduced electronically and distributed to others without restriction, provided LEaP, Lincoln University is acknowledged as the source of information. Under no circumstances may a charge be made for this information without the express permission of LEaP, Lincoln University, New Zealand.
Executive Summary
Contents
Contents ... iii
List of Tables ... iv
List of Figures ... iv
Chapter 1 Introduction ... 1
1.1 Purpose ... 1
1.2 Preparatory step: Establish an expert panel and identify peer reviewers ... 1
Chapter 2 Application of the method ... 3
Step 1: Define river value categories, river segments/catchments and fish ... distribution information ... 3
Step 2: Identify attributes ... 6
Step 3: Select and describe primary attributes ... 7
Step 4: Identify indicators ... 8
Step 5: Determine indicator thresholds ... 8
Step 6: Apply indicators and indicator thresholds ... 8
Step 7: Weight the primary attributes ... 9
Step 8: Determine river significance ... 9
Step 8a: Rank rivers ... 9
Step 8b: Identify river significance ... 9
Step 9: Outline other factors relevant to the assessment of significance ... 9
Chapter 3 Application of the RiVAS+ Methodology ... 11
Step 10: Identify rivers and interventions ... 11
Step 11: Apply indicators and indicator thresholds for potential value ... 12
Step 12: Weight the primary attributes for potential value ... 13
Step 13: Determine river potential value... 13
Step 14: Review assessment process and identify future information requirements ... 13
References ... 15
Appendix 1 Credentials of the Expert Panel members ... 17
Appendix 2 Assessment criteria for native fish (Steps 2-4) ... 19
Appendix 3 Assessment of indicators by SMARTA criteria ... 27
Appendix 4 Significance assessment calculations for native fishlife (Steps 1 and 5-8) ... 29
List of Tables
Table 1 Potential interventions to enhance river values ... 11
List of Figures
Chapter 1
Introduction
1.1
Purpose
This report1 presents the development, and an application, of the River Values Assessment
System for existing value (RiVAS) and for potential value (RiVAS+) to native fisheries in rivers of the Gisborne District, undertaken in March 2012. Workshops were held in Richmond and online iterations occurred during much of 2011 to develop and apply the method. This Gisborne District native fisheries report needs to be read in conjunction with the method report (see Hughey et al. 2010).
1.2
Preparatory step: Establish an expert panel and identify peer
reviewers
The National Expert Panel which developed the method for native fisheries was Joanne Clapcott, Eric Goodwin, Dave West, Martin Rutledge and Neil Deans assisted by Ken Hughey. Clapcott and West, aided by Jane Goodman, assembled the raw data for Gisborne. An Expert Panel of Rebecca Lander – DoC, John Lucas – DoC, Dennis Crone - Water Conservation Team Leader GDC, Paul Murphy - Senior Water Conservator GDC, Murray Palmer – Nga Mahi Te Taiao (for the RiVAS application component), assisted by Ken Hughey met on 14th March 2012 in Gisborne to ‘refine’ the raw data in RiVAS in light of local knowledge, and to undertake the RiVAS+ part of the process.
Credentials of the Expert Panel and peer reviewers are provided in Appendix 1.
Chapter 2
Application of the method
There are two parts of the system: RiVAS is applied to existing value in steps 1-9 and RiVAS+ to potential value in steps 10-14.
Step 1: Define river value categories, river segments/catchments and
fish distribution information
River value context for native fishlife in Gisborne District
Sixteen native freshwater fish species and several marine wanderers inhabit freshwater ecosystems in the Gisborne District for all or part of their life-cycle. Eight of the 16 species are listed in the Department of Conservation’s threat ranking system as ‘at risk-in decline’.
Lamprey (Geotria australis) and Giant bully (Gobiomorhus gobioides), included in the 16 species, are not listed on the New Zealand Freshwater Fish database as being present in the Gisborne District. However it is likely that they do inhabit the District’s waterways, at least in low numbers. It should be noted that compared to other regions/districts in New Zealand, Gisborne and East Cape freshwater ecosystems are under-surveyed.
Of the 16 species, 15 are known to migrate between freshwater and marine ecosystems to complete their life-cycle. Cran’s bully (Gobiomorphus basalis) is the only native non-migratory species found in the Gisborne District. However, there is still some debate around the taxonomy of Cran’s bully and their distribution, so it is possible that records of Cran’s bully from the Gisborne District are mis-identifications.
The majority of the 16 species are distributed throughout the Gisborne District, however Giant kokopu (Galaxias argenteus) and Shortjaw kokopu (Galaxias postvectis) have only been recorded from waterways on the East Cape where bush cover is still present. Redfin bully (Gobiomorphus huttoni) and Torrentfish (Cheimarrichthys fosteri) are also more common in East Cape waterways than those that drain into Poverty Bay.
River value categories
There are two distinct categories of native fish in New Zealand’s rivers and streams; migratory (i.e., diadromous) and non-migratory species. New Zealand’s native fish fauna is predominantly migratory and this is true for the Gisborne District where 15 of the 16 native freshwater species migrate between fresh water and the sea to complete part of their lifecycle.
Despite these differences the expert panel decided that a different approach to migratory and non-migratory species in the overall assessment will not usually be needed. This is because the fish fauna of the Gisborne District is dominated by migratory species - both migratory and non-migratory species can be found at the same locations and potential instream barriers can also limit the dispersal of non-migratory species.
River segments/catchments
Although the adult habitat of many native fish species occur in particular river segments (e.g., lowland or upper reaches), native fish habitat in rivers is usually driven by catchment scale characteristics (e.g., elevation, distance inland, proportion of indigenous forest cover); therefore a catchment scale approach is warranted. The predominance of migratory fish in New Zealand also warrant the use of a catchment scale approach rather than river segments in isolation as many fish species require access both up and downstream of the entire catchment. We have developed the method so that it can be applied at multiple scales, essentially built around the concept of catchment order, complemented by data sourced from a range of different applications but especially from the Freshwater Ecosystems of New
Zealand (see
http://www.doc.govt.nz/conservation/land-and-freshwater/freshwater/freshwater-ecosystems-of-new-zealand/).
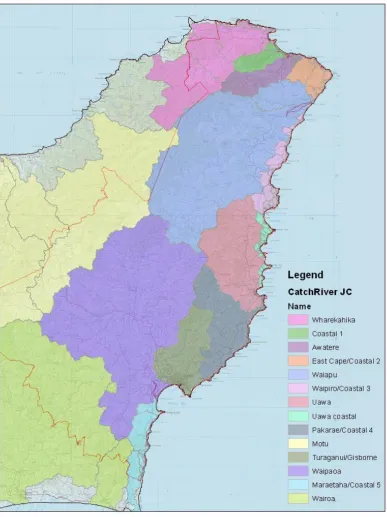
The 13 management units for the Gisborne region were identified by recording the rivers listed in the report “Freshwater biodiversity in the East Coast Hawkes Bay Conservancy of the Department of Conservation” (Froude, 2003) and also including rivers that have been brought to the attention of Water Conservation staff as having value for native fish, e.g., a cluster of coastal streams in the north. The list of rivers, ordered geographically from north to south (Figure 1), was taken by Cawthron Institute and clustered by catchment, with coastal rivers being clustered with other like coastal rivers as for an assessment of native birdlife for the Gisborne region (Bull et al. 2012).
Fish distribution information
NIWA’s New Zealand Freshwater Fish Database (NZFFD) provides a wealth of information on the presence and distribution of freshwater fish in New Zealand’s rivers and streams with approximately 32,000 records. The Gisborne District rivers and streams have approximately 400 records (around 1% of the total records), which is relatively few in the New Zealand context (Goodman, pers. comm., March 2012). This information has not been collected evenly from all of the region’s rivers and streams.
Comparing and ranking of rivers using only NZFFD data, where some rivers have many records and some rivers have none, is therefore not appropriate as they cannot be objectively assessed and there will always be a bias towards rivers and streams that have been sampled more frequently (i.e., there is more chance of recording a threatened species in a river that has been fished than a river that has not).
An additional threatened species score for each river was calculated from the NZFFDB presence per catchment, by applying a weighting to each threatened species based on their threat status listed in Allibone et al. (2009).
Existing data in the NZFFD, along with data from FENZ and threatened species scores, were used to evaluate and rank the fish communities for the different river catchments in the region.
Figure 1
Other Considerations
When applying this method in the Gisborne District, it wasn’t considered appropriate to treat migratory and non-migratory species separately, however, in some regions it might be, especially when the non-migratory species have extremely high conservation interest (e.g., much of the east coast of the South Island). However, at this stage, it was considered that rivers with these species would gain recognition by attributes that also take into account the threatened status of a species.
Records in NIWA’s NZFFD span a significant period of time (e.g., in the Gisborne District there are records from the 1960s). NZFFD records older than 10-20 years may no longer represent the actual fish communities in the river fished. A cut-off time period was discussed by the Expert Panel but it decided to use Expert Panel discretion in determining whether older NZFFD records were still relevant (i.e., compare them to more recent NZFFD records if available and/or consider the effects of any landuse changes over time). If older NZFFD records were not considered to be still relevant they were not used in this process.
Lakes, wetlands and estuaries can all have significant native fish values, and while in many cases they are intricately linked with river and stream ecosystems, differences in habitat and some differences in the species likely to occur within that habitat (e.g., estuaries are often populated by a mixture of both freshwater and marine species) mean that it would be inappropriate to assess these habitat types alongside rivers. Therefore a separate evaluation for each different habitat (e.g., lakes, wetlands and estuaries) is required.
Outcomes
Treat all native freshwater fish the same (no separate categories for migratory and non-migratory species).
Assess freshwater fish communities at the whole catchment scale or the sub-catchment scale in the case of large rivers.
Use NZFFD data, along with FENZ and threatened species scores, to evaluate and rank the fish communities in the different river catchments.
Step 2: Identify attributes
Attributes which describe the native fish values were based on generally accepted variables with implications for the intrinsic values of the native fisheries of rivers. Attributes were decided on by the expert panel. A number of additional attributes were considered but not included because of their degree of overlap with the primary attributes selected.
Attributes encompass only one of the four well-beings defined in the Local Government Act (i.e., environmental). Social (e.g., whitebaiting activity – see Booth et al. in prep.), economic (e.g., commercial fishing), and cultural (e.g., traditional fisheries) are also relevant for native fish and further discussion is needed on how this might be addressed, or if iwi values for rivers should be expressed separately to all others (Tipa 2010).
The FENZ is described by the Department of Conservation (
http://www.doc.govt.nz/conservation/land-and-freshwater/freshwater/freshwater-ecosystems-of-new-zealand/) as “… a large set of spatial data layers and supporting information on New Zealand's rivers, lakes and wetlands. It contains data gathered from a wide variety of sources. It can be used to objectively map and quantify various aspects of New Zealand's freshwater, providing:
Comprehensive descriptions of the physical environment and biological character.
Classifications that group together rivers and streams, lakes and wetlands having similar ecological character.
Estimates of human pressures and impacts on biodiversity status.
Rankings of biodiversity value that indicate a minimum set of sites that would provide representative protection of a full range of freshwater ecosystems while taking account of both human pressures and connectivity.”
The NZFFD is described by NIWA ( http://www.niwa.co.nz/our-services/online-services/freshwater-fish-database) as recording “the occurrence of fish in fresh waters of New Zealand, including major offshore islands. Data stored include the site location, the species present, their abundance and size, as well as information such as the fishing method used and a physical description of the site. The latter includes an assessment of the habitat type, substrate type, available fish cover, catchment vegetation, riparian vegetation, water widths and depths, and some water quality measures. Data, which are recorded in the field on pre-printed forms (see a sample record), are contributed voluntarily by NIWA, fish and game councils, the Department of Conservation, regional councils, environment consultants, universities, and interested individuals. Access to the data requires registration and users are encouraged to contribute data”.
Outcome
A list of all attributes selected is provided in Appendix 2. Attributes considered but not selected are also listed.
Step 3: Select and describe primary attributes
From the list of attributes outlined in Step 2, primary attributes were selected to represent key variables affecting the native fish values of rivers. Selection was based on:
1. The need for pragmatism – 10 attributes were identified but these were considered to be the most important and to describe most of the variation around relative importance. 2. Expert panel members’ opinions about the contribution of attributes to an
understanding of the native fishery.
3. Keeping the amount of overlap between attributes to a minimum (one reason for not selecting some attributes was the amount of overlap with selected attributes).
Outcome
Step 4: Identify indicators
One indicator for each primary attribute was identified, using SMARTA criteria (see Hughey et al. 2010), based on:
1. Existing data from GIS (e.g., land use and catchment order data from the River Environment Classification (Snelder et al. 2002)), NIWA’s NZFFD, the FENZ source data (Leathwick et al. 2008), and documentation on instream structures (barriers) in the Gisborne District (Armstrong, 2008)
2. Expert Panel judgment.
Appendix 3 shows the assessment of each indicator against the SMARTA criteria.
No primary attributes were dropped, although for some indicators it was recognised that there was a lack of hard data that would limit an objective approach during the assessment process. However, it was deemed that even a subjective assessment of these indicators would add value to the overall assessment and river ranking process.
Outcome
Indicators are listed in Appendix 2 and assessed against SMARTA criteria in Appendix 3.
Step 5: Determine indicator thresholds
Thresholds were applied to each indicator in an attempt to determine high, medium and low relative significance. Thresholds for each indicator were defined by real data for virtually all indicators of Primary Attributes, or largely by Expert Panel judgment (e.g., Primary Attribute 5: Key population of threatened species (‘Stronghold’)). The threshold ‘cut offs’ were based on expert opinion and further work is likely required to justify the relationships between these ‘cut offs’ and ‘hard’ data.
In most cases thresholds were determined to allow for three (and occasionally a fourth) different thresholds (high (3), medium (2), low (1) and occasionally no importance (0)).
Outcome
Thresholds are identified in Appendix 2.
Step 6: Apply indicators and indicator thresholds
Most indicators were assessed using objective data and in these cases data were kept in their original format (e.g., Primary Attribute 4: Number of Declining Species) to assist the Expert Panel when evaluating the data, and to help achieve a transparent process.
Some indicators (for Primary Attribute 5: Key population of threatened species (‘Stronghold’)) were assessed by the Expert Panel opinion due to a lack of available hard data. While this was a subjective process and is not ideal, this indicator and attribute was deemed important enough that a subjective assessment was better than no assessment at all.
Outcome
Step 7: Weight the primary attributes
The 10 primary attributes were considered to make an equal contribution to native fish life as a whole. The decision was reached to keep weightings equal.
Outcome
Equal weighting.
Step 8: Determine river significance
Step 8a: Rank rivers
A spreadsheet was used to sum the indicator threshold scores for each river. The spreadsheet for a selection of rivers is set out in Appendix 4. Since we had chosen to equally weight the primary attributes, we did not have to first multiply the threshold scores by the weights.
Step 8b: Identify river significance
Using the ranked list from Step 8a, the Expert Panel examined the rivers, and their attribute scores. The following criteria were applied:
National significance:
Criterion 1: Total score of all indicator columns is 24 or more; or Criterion 2: Declining species score 3.
Regional significance:
Rivers that are not of local or of national significance.
Local significance:
Criterion 1: Total score of all indicator columns is 15 or less, and declining species score is 1 or less then local.
Translation of these functions to rivers is shown in Appendix 4.
Outcome
A list of rivers ranked by a scoring system from highest to lowest, which represents an initial significance ranking list. See Appendix 4.
Rivers identified as significant at the national, regional and local level. See Appendix 4.
Step 9: Outline other factors relevant to the assessment of significance
Perhaps the most telling issue concerns the availability of relevant and up-to-date data which is of a resolution high enough to objectively assess and rank all rivers and streams in the region. This, along with the lack of hard data to assess impacts such as low flows and instream barriers on the native fish fauna, makes an objective assessment of the native fish values of all rivers and streams in the Gisborne District problematic at best.
Outcome
Chapter 3
Application of the RiVAS+ Methodology
Step 10: Identify rivers and interventions
Rivers for potential state assessment
The 13 river clusters identified in the RiVAS assessment (see Appendix 4) were used as the basis for the RiVAS+ analysis.
No new river reaches were added that represent rivers with potential value for native fishlife but hold little current value.
Potential interventions
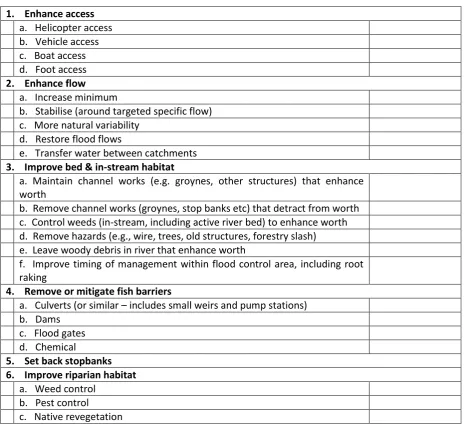
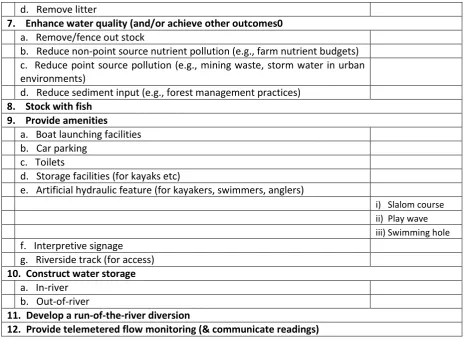
Means by which river conditions may be enhanced are listed in Table 1.
Table 1
Potential interventions to enhance river values
1. Enhance access
a. Helicopter access
b. Vehicle access
c. Boat access
d. Foot access
2. Enhance flow
a. Increase minimum
b. Stabilise (around targeted specific flow)
c. More natural variability
d. Restore flood flows
e. Transfer water between catchments
3. Improve bed & in-stream habitat
a. Maintain channel works (e.g. groynes, other structures) that enhance
worth
b. Remove channel works (groynes, stop banks etc) that detract from worth c. Control weeds (in-stream, including active river bed) to enhance worth d. Remove hazards (e.g., wire, trees, old structures, forestry slash)
e. Leave woody debris in river that enhance worth
f. Improve timing of management within flood control area, including root raking
4. Remove or mitigate fish barriers
a. Culverts (or similar – includes small weirs and pump stations)
b. Dams
c. Flood gates
d. Chemical
5. Set back stopbanks 6. Improve riparian habitat
a. Weed control
b. Pest control
d. Remove litter
7. Enhance water quality (and/or achieve other outcomes0
a. Remove/fence out stock
b. Reduce non-point source nutrient pollution (e.g., farm nutrient budgets)
c. Reduce point source pollution (e.g., mining waste, storm water in urban
environments)
d. Reduce sediment input (e.g., forest management practices)
8. Stock with fish 9. Provide amenities
a. Boat launching facilities
b. Car parking
c. Toilets
d. Storage facilities (for kayaks etc)
e. Artificial hydraulic feature (for kayakers, swimmers, anglers)
i) Slalom course
ii) Play wave
iii) Swimming hole
f. Interpretive signage
g. Riverside track (for access)
10. Construct water storage
a. In-river
b. Out-of-river
11. Develop a run-of-the-river diversion
12. Provide telemetered flow monitoring (& communicate readings)
Appendix 5 lists the Gisborne District river sections used for the RiVAS+ assessment. Table 1 and Appendix 5 record potential interventions.
Step 11: Apply indicators and indicator thresholds for potential value
Taking each river in turn, the Expert Panel considered which interventions were relevant to that river. These were recorded in Appendix 5.
Then the Panel considered the net effect of these interventions upon the value of the river to native fishlife. The degree or extent of intervention was discussed. The RiVAS+ methodology calls for the panel to select the two most important interventions for each river, and for these to be practical and feasible rather than ideal.
The effect of the potential interventions was assessed for each indicator by considering the current score (from RiVAS) and identifying whether the score would change as a result of the interventions.
By definition, there are no raw data for native fishlife based on potential future conditions of a river, so the Panel focused primarily on the scores. Occasionally, the Panel considered whether interventions would be likely to shift the raw data over the relevant threshold value to a higher score.
change was thought likely, the RIVAS score was not altered (cells were left blank for convenience).
Sometimes discussion slipped into consideration of protecting current value or avoiding its degradation. It was reinforced that the RiVAS provides information to assist decision-makers with those questions, and the Panel was steered back to addressing potential future value.
Outcome
Appendix 5 records the indicator scores for potential value.
Step 12: Weight the primary attributes for potential value
Because no attributes or indicators were altered for the RIVAS+ exercise, weightings were not revisited (i.e. an equal weighting regime was automatically applied to the RIVAS+ exercise).
Outcome
The RIVAS weighting regime (equal weighting) applied.
Step 13: Determine river potential value
The scores were summed for each river. A score of 0.5 was given to each ‘+’ and ‘-‘ (i.e. +0.5 or -0.5).
Of the 13 clusters, 10 altered their sum total score, all in a positive direction. The Uawa River shifted most (by 2.5 points, from 20 to 22.5), but still remains regionally important. The main reason for the large change relates to fencing of inanga spawning sites to raise the score of this indicator from 1 (current) to 3.
All other rivers recorded small shifts in value, with no consequential change in their river importance classification.
In total, 10 rivers were identified as having potential to improve river conditions in a way that would enhance native fishlife value. The interventions most frequently identified for enhancing native fishlife value (with the number of times it was identified across all rivers given in brackets) were:
1. 7d, Enhance Water Quality – reduce sediment input (8) 2. 7a, Enhance Water Quality – remove/fence out stock (4)
3. 4a/b, Remove or mitigate fish barriers – (a) culverts (1); (b) dams (weirs in GDC) (1).
Outcomes
Appendix 5 and Appendix 6 provide a list of rivers ranked by their potential increase in value for native fishlife, with possible interventions identified for each river.
Step 14: Review assessment process and identify future information
requirements
References
Allibone, R., David, B., Hitchmough, R., Jellyman, D., Ling, N., Ravenscroft, P., and Waters, J. 2010. Conservation status of New Zealand freshwater fish, 2009. New Zealand Journal of Marine and Freshwater Research, 44: 271-287.
Armstrong, D. 2008. Gisborne region fish passage: Barriers to fish passage in the Gisborne region (draft). Department of Conservation, Gisborne.
Bull, S., Bassett, A., Hughey, K.F.D. 2012. Native birdlife in Gisborne District: Application of the river values assessment system (RiVAS and RiVAS+). Land Environment and People Research Paper No. 5, Lincoln University, New Zealand.
Froude, V. 2003. Freshwater biodiversity in the East Coast Hawkes Bay Conservancy of the Department of Conservation. Pacific Eco-Logic Ltd, Porirua.
Hughey, K., Booth, K., and Baker, M. 2010. River Values Assessment System (RiVAS) – The method. Pp. 43-64 in: Hughey, K.F.D., Baker, M-A. (eds). (2010a). The River Values Assessment System: Volume 1: Overview of the Method, Guidelines for Use and Application to Recreational Values. LEaP Report No.24A, Lincoln University, New Zealand.
Jowett, I,G., and Richardson, J. 1996. Distribution and abundance of freshwater fish in New Zealand Rivers. New Zealand Journal of Marine and Freshwater Research 30: 239-255.
Leathwick, J.R., Julian, K., Elith, J., and Rowe, D. 2008. Predicting the distribution of freshwater fish species for all New Zealand's rivers and streams. NIWA Client Report HAM2008-005, National Institute of Water and Atmospheric Research.
Snelder, T., Biggs, B.J.F., Weatherhead, M., and Niven, K. 2002. A brief overview of New Zealand’s River Environment Classification. NIWA, Christchurch.
Appendix 1
Credentials of the Expert Panel members
The Expert Panel comprised six members. Their credentials are:
Dr Joanne Clapcott is a freshwater ecologist with Cawthron Institute and specialises in the ecological function of steam ecosystems and the development of robust stream health indicators. Joanne has over 10 years of experience in freshwater science and works extensively with central and local governments in New Zealand to improve the management of freshwater environments. Joanne has experience with national native fish datasets and spatial analyses to characterise the relationship between fish communities, land use and environmental variability.
Eric Goodwin is a scientific data analyst with Cawthron Institute. Eric has statistical and spatial analysis expertise which he uses to develop broad-scale models of environmental data to inform coastal and freshwater management. Recently, Eric has worked with regional and national datasets to examine spatial patterns in fish and other freshwater biota, predict stream health, and model contaminant dispersal patterns in and around coastal developments.
Dr David West did his MSc researching freshwater fish communities in pasture and native forest sites in the Waikato rivers, then worked for NIWA doing research on native fish tolerances to environmental conditions, e.g. temperature, sediment, pH. He moved to DOC where he applied freshwater information to management, got a scholarship from Scion and Landcare Research to do a PhD at Waikato University on effects of point source discharges on freshwater fish resident in discharge plumes into the Waikato River. Worked as a PostDoc in Canada researching effects of mines on aquatic communities using slimey sculpin as a indicator fish species. Now back in New Zealand as a Scientifc Advisor for the Freshwater Section of DOC Science and technical doing everything from developing methods to remove exotic fish from streams to developing & supporting the use of geospatial models such as FENZ.
Rebecca Lander is the Freshwater Technical Support Officer for the East Coast Bay of Plenty Conservancy of the Department of Conservation, and has become familiar with waterways and freshwater issues in the Gisborne region over the past three years. She has also spent five years working as a DOC Biodiversity Ranger and has a BSc (Hons) in Ecology and Environmental Management.
Jane Goodman has an MSc (Hons) in freshwater ecology. She is currently employed by the Department of Conservation as a Freshwater Technical Support Officer (TSO) based in Hamilton and is the leader of the Large Galaxiid Recovery Group. In a previous role Jane worked for the Department of Conservation in Gisborne for 6 years as a Freshwater TSO.
John Lucas is employed as a Programme Manager Biodiversity for the Department of Conservation, Gisborne/Whakatane Area office. He has worked in Gisborne for 15 years, employed initially with Eastern Fish and Game then the Department of Conservation as a technical support officer.
Dennis Crone is Team Leader Water Conservation at GDC. This team is responsible for processing consents for activities in water bodies. This provides opportunity to be familiar with rivers and streams throughout the district. His background is in Agricultural Science and recently as a soil conservator with GDC after positions within MAF as a Senior Policy Analyst and area manager of MAF Technology. Knowledge in regard to native fisheries in the district is from observation and interest rather than an academic background.
Paul Murphy is a Senior Water Conservator at GDC. He has 7 years experience in the Water Resources Section of the Gisborne District Council managing water issues throughout the Gisborne Region.
resource management consultancy. Murray has Bachelors degree from Massey University with majors in Philosophy and Environmental Science, a Post-graduate Diploma in Resource and Environmental Planning, and is currently completing a Post-graduate Diploma in Maori Resource and Environmental Management. In the field of freshwater ecology and management, Murray has produced research reports and planning documents for Māori Trusts, marae and environmental consultants. His present research focus is around land use impacts on freshwater biological condition in Te Tairawhiti. Murray also has experience as an environmental educator and is currently contracted to the Ministry of Education and the Department of Conservation to deliver freshwater science education to schools and communities.
The panel was assisted by Ken Hughey (Professor of Environmental Management, Lincoln University).
Appendix 2
Assessment criteria for native fish (Steps 2-4)
ATTRIBUTE CLUSTERS
ATTRIBUTE (primary attributes in
bold)
DESCRIPTION OF PRIMARY ATTRIBUTES
INDICATORS
INDICATOR SIGNIFICANCE
THRESHOLDS
DATA SOURCES and SPECIFIC APPLICATION to GDC (and reliability)
Step 2: Identify attributes Step 3: Select and describe primary attributes
Step 3: Select and describe primary attributes
Step 4: Identify indicators
Step 5: Determine significance thresholds
Numbers 1. Abundance
of fish (Fish)
Compilation of the named species using the reach rated by relative abundance
Continuous variable (estimated total fish abundance) for each area – natural breaks in data at a regional scale to inform scores
3 = high estimated abundance of native species;
2 = moderate estimated abundance of native species;
1 = low estimated abundance of native species
NZFFD for species diversity and then expert input on relative abundance of each. Note that for some areas, including GDC there is a limited number of records. Specifically, based on the average abundance of native fish (22 species):
• use “native abundance" spread sheet in GDC NZFFD data.xls
• Range in values: min = 0, max = 236, mean = 31 • For each GDC13 sum (total spp/total reach length sampled)
• REPORT: 1. Average number native fish AND 2. Regional score 1,2,3
2. Inanga spawning site (Spawning)
Known or surmised areas of whitebait spawning
Raw data Raw number of
spawning sites per river: 3 = 2+ known sites; 2= 1 spawning sites;
DoC Regional Inanga Spawning records (Obj.) added to by Expert Panel opinion (Subj.).
Specifically:
ATTRIBUTE CLUSTERS ATTRIBUTE (primary attributes in bold) DESCRIPTION OF PRIMARY ATTRIBUTES INDICATORS INDICATOR SIGNIFICANCE THRESHOLDS
DATA SOURCES and SPECIFIC APPLICATION to GDC (and reliability)
1= likely but not known; 0 = unlikely.
(Note expert panel adjustment possible – record why)
• Plot location of 8 sites – use "jc" spread sheet in GDC inanga spawning.xls
• Score 0 = no known spawning sites, 1 = likely spawning but not known (expert panel to assess whether 0 or 1), 2 = 1 spawning sites, 3 = 2+ spawning sites
• REPORT: 1. Number of sites AND 2. Defined score 0,1,2,3 Scarcity, Diversity, Benefits Fish community Biogeographic and/or regional recruitment contexts. Expected fish species diversity vs. found show healthy fish communities. Consider guilds.
Unknown Mined from other attributes (Obj.) plus expert opinion
(Subj.)
3. Diadromous predictions (Diadromous)
FENZ provides the ability to predict which diadromous species will occur in particular locations/reach es. This data can
Continuous variable (sum probability of occurrence) for each 3rd order catchment (length-based aggregation), and natural breaks at national scale to inform scores
3= relatively high probability of occurrence
2= moderate probability of occurrence
1= relatively low probability of occurrence
FENZ (Obj.) and then to EP for reconsideration. Predictive feature.
Specifically:
• Use national analysis [use sum of the probability of occurrence of 15 spp length weighted at the 3rd order group should be viewed at the national scale to inform natural breaks and assign 1,2,3]
• Length weighted aggregation (e.g. sum
ATTRIBUTE CLUSTERS ATTRIBUTE (primary attributes in bold) DESCRIPTION OF PRIMARY ATTRIBUTES INDICATORS INDICATOR SIGNIFICANCE THRESHOLDS
DATA SOURCES and SPECIFIC APPLICATION to GDC (and reliability)
be used to capture diversity, richness etc
score
• REPORT: 1. Average national score AND 2. Regional score 1,2,3
4. Number of Critical, Endangered or Vulnerable fish spp. (Declining species) Provides a snapshot of the importance of the river for species ‘at risk’ (includes declining, recovering, relict, naturally uncommon – for NZ = 17 described species (Allibone et al. 2010))
Named species and their conservation status
3= 7 (or more) declining or 1 or more nationally endangered spp;
2= 4 (or more) declining or 1 or more nationally vulnerable;
1 = 1 (or more) declining spp;
0 = No Threatened or At risk-declining spp.
NZFFD (Obj.). EP to consider as yet undescribed species, and related issues.
Specifically:
• use '"native abundance" spread sheet in GDC NZFFD data.xls. This is the sum number of unique species labelled as declining (n = 9; NO critical, endangered or vulnerable in GDC)
• Score 0 = none declining, 1 = 1 or more declining, 2 = 4 or more declining and/or 1+ vulnerable, 3 = 7 or more declining and/or 1+ vulnerable
• REPORT: 1. Number declining species AND 2. Defined score 0, 1,2,3
Number of Declining fish species
Similar to above Named species 5 spp
Similar to birdlife and related to defined conservation status
NZFFD & FENZ Predicted (Obj.)
5. Key population Threatened species Provides a measure of relative importance of
Named species and relative regional or national proportions of populations
3 = One (or more) population(s) considered to be of national importance;
NZFFD (and recovery Plans (Obj.) and Expert Opinion (Subj.).
ATTRIBUTE CLUSTERS ATTRIBUTE (primary attributes in bold) DESCRIPTION OF PRIMARY ATTRIBUTES INDICATORS INDICATOR SIGNIFICANCE THRESHOLDS
DATA SOURCES and SPECIFIC APPLICATION to GDC (and reliability)
(Stronghold) rivers as
strongholds for populations of ‘threatened or at risk’ species in New Zealand. Multiple criteria used in recovery plans including scientific, so make it EP Same list as above.
thought to be there in 5% classes.
Populations key to the ongoing ‘survival’ of the species.
Get EP to consider: 1. If basically only
region with the fish then 5 sites 2. Max 3 otherwise
2 = More than one population(s) considered to be of regional importance; 1 = At least one population of an at risk species of regional stronghold importance recorded in the
catchment; 0 = No stronghold populations of threatened species recorded in the catchment.
Specifically:
• Plot location of sites (DoC)
• Score cluster 0 = no strongholds, 1 = at least 1
population stronghold at risk of regional importance, 2 = 2+ populations of regional importance, 3 = 1+
population of national importance
• REPORT: 1. Number of sites AND 2. Defined score 0,1,2,3
Water quantity & quality)
6. Flow regime integrity (Flow)
Water abstraction is one pressure that affects the integrity of natural flow regimes. The greater the abstraction the lesser the integrity. This is
Continuous variable and 1-3 score for each 3rd order catchment (score first then aggregate – length based); natural breaks at national level to inform average regional scores Water allocation pressure spatial layer
3 = relatively no water abstraction pressure; 2 = moderate water abstraction pressure; 1 = relatively high water abstraction pressure.
RC abstraction database (Obj.).
Proposed National Environmental Standards on Ecological Flows:
a. For all NZREACH segments where SegFlow <= 5 cumecsWhen SegProLowFlow = 1 score 3
When SegProLowFlow >0.9 score 2 >>>0 records When SegProLowFlow <0.9 score 1 >>>677 records b. For all NZREACH segments where SegFlow > 5 cumecs When SegProLowFlow = 1 score 3
ATTRIBUTE CLUSTERS ATTRIBUTE (primary attributes in bold) DESCRIPTION OF PRIMARY ATTRIBUTES INDICATORS INDICATOR SIGNIFICANCE THRESHOLDS
DATA SOURCES and SPECIFIC APPLICATION to GDC (and reliability)
just one indicator of integrity.
based on data up to and including 2006 which looks at the proportion of
consented water takes in relation to mean annual low flow (most recent layer not used because calculations based on mean flow); scores based on adherence to Proposed National Environmental Standards on Ecological Flows. Note – EP to update to evaluate whether takes are active.
[When SegProLowFlow = 1 >>>20583 records] c. Averaged values for 3rd order catchment Complemented by EP – existing use, timing of use, length of use.
Specifically:
• Use national analysis [Using water allocation scores (SegPFlw123). Proportion of low flow remaining after allocated takes is viewed in relation to proposed NEF standards. For example, score 1 when flow <= 5 cumecs and flow remaining is <0.9 low flow. Assign NES
standards to national data set. View length-weighted aggregation at 3rd order group and assign scores based on natural breaks]
• Length weighted aggregation (e.g. sum
(probability)/total stream length) to inform GDC13 score • REPORT: 1. Mean national score AND 2. Regional score 1,2,3 7. Water Quality (WQ) Water quality can be measured in multiple ways and not all parameters can be included in
Adopted a ‘minimum operator’ approach () a. If sediment cover <20% = pass; if NO3N < 1.7 = pass; if MCI > 100 = pass
b. If 0 or 1
3 = best water quality; 2 = average water quality;
1= worst water quality.
a. Fine sediment cover spatial layer and sediment guidelines;
b. NO3N spatial layer and nitrate toxicity guidelines; c. MCI spatial layer and MCI recommended guidelines Specifically:
ATTRIBUTE CLUSTERS
ATTRIBUTE (primary attributes in
bold)
DESCRIPTION OF PRIMARY ATTRIBUTES
INDICATORS
INDICATOR SIGNIFICANCE
THRESHOLDS
DATA SOURCES and SPECIFIC APPLICATION to GDC (and reliability)
an evaluation index. To this end it was decided to consider sediment, N toxicity and MCI and to use a decision support tool to determine indicator significance. Temperature was not included because all streams have less than 20°C in the predicted mean summer temperature spatial layer in FENZ
components passed = 1, worst water quality; if 2 passed = 2,
average water quality; if 3 passed = 3, best water quality Ultimately a
continuous variable and 1-3 score for each 3rd order catchment (score first then aggregate – length based); regional breaks to inform scores then aggregated to area (length-based)
relation to ‘healthy water’ guidelines. For example, score 3 = MCI > 100, sediment < 20% and nitrate < 1.7 ppm
• Length-weighted aggregation (e.g.
sum(score*length)/sum(length)) at GDC13 level • REPORT: 1. Average regional score AND 2. Regional score 1,2,3
Natural environment
8. Introduced fauna (Fauna)
Presence of introduced
Maximum probability of 9 introduced fish
3 = little or no presence or impact from
ATTRIBUTE CLUSTERS ATTRIBUTE (primary attributes in bold) DESCRIPTION OF PRIMARY ATTRIBUTES INDICATORS INDICATOR SIGNIFICANCE THRESHOLDS
DATA SOURCES and SPECIFIC APPLICATION to GDC (and reliability)
fauna
(introduced fish)
species for a given segment, then length-weighted aggregation: then national natural breaks to inform score; area average to inform regional score Same as attribute 3
introduced fauna ; 2 = moderate level presence of introduced fauna likely having a moderate, but
survivable, population level impact on native fish;
1 = Dominating presence of life threatening introduced fauna having/or likely to be having a severe
population level impact on native fish.
Specifically:
• Use national 3PLU analysis [Sum of regional
probabilities length weighted to 3rd order, viewed at a national scale using natural breaks to inform scores] • Length weighted aggregation (e.g. sum
(probability)/total stream length) to inform GDC13 score
• REPORT: 1. Average national score AND 2. Regional score 1,2,3
9. Physical Barriers
‘Human made’ structures that fully or partially prevent up- and/or down-stream fish movements
Location of barrier and calculated proportion of stream length within 20km of river length affected upstream of barrier. 20% and <20km = 1; <20% and >20km = 2; ==3
3 = no barriers known; 2 = barrier(s) present but having minimal impact on the fish fauna (e.g., <20% of stream length 20km to coast above a barrier);
1 = barrier(s) having some impact on the fish fauna (e.g., >20% of stream length 20km to
Regional Council databases. FENZ base layers (Obj.). EP local knowledge.
Specifically:
• Plot location of 41 barriers – use "jc" spreadsheet in S:\New_S\Projects\FRST\FVO\GisborneFreshWater\GD C Fish passage barriers.xls
• Plot nz-mainland-dam-centreline
ATTRIBUTE CLUSTERS ATTRIBUTE (primary attributes in bold) DESCRIPTION OF PRIMARY ATTRIBUTES INDICATORS INDICATOR SIGNIFICANCE THRESHOLDS
DATA SOURCES and SPECIFIC APPLICATION to GDC (and reliability)
coast above a barrier). • REPORT: 1. Proportion of zone affected AND 2. Defined score 1,2,3
Channelisation Acts as
descriptor of in-river channel condition which is a driver of habitat condition for native fish.
Proportion of river length within 20km of coast with an
immediate (i.e., adjacent) embankment/ channelization effect.
3= <5%; virtually no artificial structures or channelization; 2= 5-30%; a moderate level of channelisation etc;
1= >30%; a small proportion remains in a natural channel form; 0= Totally channelised, isolated etc.
Embankment feature (Obj)
10.
Functioning riparian zone (Riparian shading)
An evaluation of the value of the riparian margin contribution to native fish habitat
Riparian shade in FENZ reflects riparian vegetation
composition (potential food source and habitat availability for fish) and shading of channel (temperature control of habitat). Continuous shade variable aggregated (length based) then scored.
3= High shade (>60%) maintains temperature and provides food sources;
2= 20%-60% shade provides some structure and function;
1= <20% shade suggests poor fish habitat.
FENZ base layer (Obj.), informed then by EP (Subj.).
Specifically: • Use SegRipShade
• Length-weighted aggregation (e.g. Sum (SegRipShade * stream length)/ Sum(stream length)) at GDC13 level • Score 1 = <20%, 2 = 20-60%, 3 =>60%
Appendix 3
Assessment of indicators by SMARTA criteria
Indicator Specific Measurable Achievable Relevant Timely Already in use
1. Abundance of fish (Fish)
Yes
NZFFD and EP estimates
Data available although limited in some areas;
complemented by EP
Abundance has a link to relative importance
Data available + some EP input
To a limited extent although not universally applied
2. Inanga spawning site (Spawning)
Yes
DoC records; Surveyed identified sites or suspected sites
Data available although limited in some areas;
complemented by EP
Known spawning important for native fisheries conservation
Data available + some EP input
Yes
3. Diadromous predictions (Diadromous)
Yes FENZ predictive
modelling
Based on existing FENZ modelling
High diversity means high importance
Data available + some EP input
Yes, but not widely implemented, yet
4. Number of Critical, Endangered or Vulnerable fish spp. (Declining species)
Yes
List of known species - NZFFD
Data available although limited in some areas;
complemented by EP
High number links to high importance
Data available + some EP input
Yes
5. Key population Threatened species
(Stronghold) Yes Expert knowledge; species recovery
plans
Relevant experts available with local knowledge
Key sites important for conservation
Data available + some EP input
To a limited extent although not universally applied
6. Flow regime integrity (Flow)
Yes
RC abstraction database
Data available Flow integrity
important for native fish
Data available + some EP input
Yes
7. Water Quality (WQ)
Yes
Combination of sediment, NO3N and MCI
Data available although limited in some areas;
Many species require high water quality
Data available + some EP input
Indicator Specific Measurable Achievable Relevant Timely Already in use
complemented by EP
8. Introduced fauna (Fauna)
Yes
FENZ base layer Based on existing FENZ data
Low impact of invasives improves importance
Data available + some EP input
Yes
9. Physical Barriers
Yes
RC database and FENZ layer
Data available A low number of
barriers raises importance
Data available + some EP input
Yes
10. Functioning riparian zone (Riparian
shading) Yes FENZ base layer Based on existing FENZ modelling Intact riparian zones relate to higher levels
of importance
Data available + some EP input
Appendix 4
Significance assessment calculations for native fishlife (Steps 1 and 5-8)
1 Fish Score 2 Spawning Score 3 Diadromous Score 4 Declining Species Score 5 Stronghold Score 6 Flow Score 7 WQ Score 8 Introduced Fauna Score 9 Physical Barrier Score 10 Riparian Shading Score A ve rag e nu m be r na ti ve f ish R eg io na l sc o re N um be r o f whi te ba it si te s D ef ine d sc o re A ve rag e na ti o na l sc o re R eg io na l sc o re N um be r de cl ini ng sp ec ie s D ef ine d sc o re N um be r o f st ro ng ho ld si te s D ef ine d sc o re A ve rag e na ti o na l sc o re R eg io na l sc o re A ve rag e re gi o na l sc o re R eg io na l sc o re Expe rt p an el A ve rag e na ti o na l sc o re R eg io na l sc o re P ro p o rt io n o f zo ne a ff ec te d D ef ine d sc o re A ve rag e ri pa ri an c o ve r D ef ine d sc o re
Sum Importance Comments
Awatere 4941 1 1 2 2.2 2 7 3 GK, SJK 3 3.0 3 2.5 2 3 3.0 3 0.00 3 0.52 2 25 National
Giant kokopu probably also SJK – significant because there are very few populations on the East Coast of New Zealand, probably heading towards going locally extinct due to reduced
recruitment
Coastal 1 6520 1 1 2 2.5 2 9 3 GK, SJK 3 3.0 3 2.6 3 3 2.9 3 0.00 3 0.59 3 26 National
Giant kokopu probably also SJK – as above
East Cape/
Coastal 2 11278 1 0 0 2.9 3 3 1 BK 2 3.0 3 2.6 3 3 2.6 3 0.00 3 0.71 3 22 Regional Good populations of Banded kokopu
Maraetaha/
Coastal 5 5608 1 1 1 2.1 2 3 1 LFE 1 3.0 3 2.0 1 2 2.3 2 0.00 3 0.58 3 19 Regional
Ranked all sites at least as regional importance – the East Cape and Poverty Bay Streams are regional and potentially could say national strongholds for longfin eels, still good numbers around
throughout catchments
Motu 13314 1 1 1 1.8 1 5 2 SJK, LFE 3 3.0 3 2.8 3 2 2.5 2 0.00 3 0.56 2 20 Regional
Old records or SJK, pretty sure there is no fishing for longfin eel – one of only a handful of rivers in NZ
Pakarae/
Coastal 4 6482 1 0 0 2.3 2 2 1 LFE 1 3.0 3 1.6 1 2 2.8 3 0.01 2 0.49 2 17 Regional Longfin eel
Turanganui/
Gisborne 5255 1 1 1 2.4 2 3 1 LFE 1 2.8 2 1.5 1 2 2.7 2 0.04 2 0.54 2 16 Regional Longfin eel
Uawa 22584 2 1 1 2.2 2 4 2 LFE 1 3.0 3 2.1 1 2 2.8 3 0.01 2 0.55 2 20 Regional Longfin eel
Waiapu 35644 2 0 0 1.7 1 7 3 LFE 1 3.0 3 2.6 3 2 3.0 2 0.00 3 0.50 2 19 National Longfin eel
Waipaoa 59885 3 1 2 1.7 1 6 2 LFE, K 3 2.9 1 2.1 1 1 2.9 2 0.03 2 0.51 2 19 Regional
Stronghold for longfin eel – could say either regional or national importance, The Te Arai (waterworks bush) has a good population of koaro, one of very few streams (only one I saw) that flows in to Poverty Bay with koaro
Waipiro/
Coastal 3 5570 1 0 0 2.2 2 3 1 LFE 1 3.0 3 2.8 3 3 2.8 3 0.00 3 0.64 3 20 Regional Longfin eel
Wairoa 58545 3 2 2 1.4 1 5 2 LFE 1 2.9 2 2.4 2 2 2.6 2 0.00 3 0.53 2 20 Regional Longfin eel
Wharekahika 27755 2 3 3 2.3 2 8 3 GK, SJK 3 3.0 3 2.8 3 3 2.9 3 0.01 3 0.51 3 28 National
Giant kokopu probably also SJK – significant because there are very few populations on the East Coast of New Zealand, probably heading towards going locally extinct due to reduced
Codes
River Declining species present Number
Awatere Longfin eel Torrentfish
Giant
kokopu Koaro Inanga
Short jaw kokopu
Redfin
bully 7
Coastal 1 Longfin eel Torrentfish
Giant
kokopu Koaro Inanga
Short jaw kokopu Bluegill bully Redfin
bully Lampray 9
East Cape/
Coastal 2 Longfin eel Inanga
Redfin
bully 3
Maraetaha/
Coastal 5 Longfin eel Inanga
Redfin
bully 3
Motu Longfin eel Torrentfish Koaro
Short jaw kokopu
Bluegill
bully 5
Pakaraae/
Coastal 4 Longfin eel
Bluegill
bully 2
Turanganui/
Gisborne Longfin eel Inanga
Redfin
bully 3
Uawa Longfin eel Torrentfish Inanga
Bluegill
bully 4
Waiapu Longfin eel Torrentfish
Giant
kokopu Koaro Inanga
Short jaw kokopu
Redfin
bully 7
Waipaoa Longfin eel Torrentfish Koaro Inanga
Bluegill bully
Redfin
bully 6
Waipiro/
Coastal 3 Longfin eel Koaro
Redfin
bully 3
Wairoa Longfin eel Torrentfish Koaro Inanga
Redfin
bully 5
Wharekahika Longfin eel Torrentfish
Giant
kokopu Koaro Inanga
Short jaw kokopu Bluegill bully Redfin
bully 8
Significance thresholds (highlighted columns)
Green High = National
Blue
Medium = Regional
Yellow Low = Local
Miscellaneous (highlighted rivers)
Pink Rivers overlap withneighbouring council
Data reliability (font colour)
Black Reliable data
Blue/Purple Less reliable data
Appendix 5
Potential significance assessment calculations for native fishlife (RiVAS+) (Steps 10-13)
1 Fish Score 2 Spawning Score 3 Diadromous Score 4 Declining Species Score 5 Stronghold Score 6 Flow Score 7 WQ Score 8 Introduced Fauna Score 9 Physical Barrier Score 10 Riparian Shading Score Intervention A ve rag e nu m be r na ti ve f ish R eg io na l sc o re N um be r o f whi te ba it si te s D ef ine d sc o re A ve rag e na ti o na l sc o re R eg io na l sc o re N um be r de cl ini ng sp ec ie s D ef ine d sc o re N um be r o f st ro ng ho ld si te s D ef ine d sc o re A ve rag e na ti o na l sc o re R eg io na l sc o re A ve rag e re gi o na l sc o re R eg io na l sc o re Expe rt p an el A ve rag e na ti o n al sc o re R eg io na l sc o re P ro po rt io n o f zo ne a ff ec te d D ef ine d sc o re A ve rag e ri pa ri an c o ve r D ef ine d sc o re RiVAS sum RiVAS+
sum Importance
Awatere 7a, 7d 4941 1 1 3 2.2 2 7 3 GK, SJK 3 3.0 3 2.5 2 3.5 3.0 3 0.00 3 0.52 2 25 26.5 National
Coastal 1 7a 6520 1 1 3 2.5 2 9 3 GK, SJK 3 3.0 3 2.6 3 3 2.9 3 0.00 3 0.59 3 26 27 National
East Cape/
Coastal 2 7d 11278 1 0 0 2.9 3 3 1 BK 2 3.0 3 2.6 3 3.5 2.6 3 0.00 3 0.71 3 22 22.5 Regional
Maraetaha/
Coastal 5 7d 5608 1 1 1 2.1 2 3 1 LFE 1 3.0 3 2.0 1 2.5 2.3 2 0.00 3 0.58 3 19 19.5 Regional
Motu 7a 13314 1 1 1 1.8 1 5 2 SJK, LFE 3 3.0 3 2.8 3 2.5 2.5 2 0.00 3 0.56 2 20 20.5 Regional
Pakarae/
Coastal 4 7d 6482 1 0 0 2.3 2 2 1 LFE 1 3.0 3 1.6 1 2 2.8 3 0.01 2 0.49 2 17 17 Regional
Turanganui/
Gisborne 7d, 4a 5255 1 1 1 2.4 2 3 1 LFE 1 2.8 2 1.5 1 2.5 2.7 2 0.04 3 0.54 2 16 17.5 Regional
Uawa 7a, 7d 22584 2 1 3 2.2 2 4 2 LFE 1 3.0 3 2.1 1 2.5 2.8 3 0.01 2 0.55 2 20 22.5 Regional
Waiapu 7d 35644 2 0 0 1.7 1 7 3 LFE 1 3.0 3 2.6 3 2.5 3.0 2 0.00 3 0.50 2 19 19.5 National
Waipaoa 7d, 4a 59885 3 1 2 1.7 1 6 2 LFE, K 3 2.9 1 2.1 1 2 2.9 2 0.03 3 0.51 2 19 21 Regional
Waipiro/
Coastal 3 5570 1 0 0 2.2 2 3 1 LFE 1 3.0 3 2.8 3 3 2.8 3 0.00 3 0.64 3 20 20 Regional
Wairoa 58545 3 2 2 1.4 1 5 2 LFE 1 2.9 2 2.4 2 2 2.6 2 0.00 3 0.53 2 20 20 Regional
Wharekahika 7a 27755 2 3 3.5 2.3 2 8 3 GK, SJK 3 3.0 3 2.8 3 3 2.9 3 0.01 3 0.51 3 28 28.5 National
Note:
1 Sp. Codes GK = Giant Kokupu; SJK = Short Jawed Kokupu; BK = Banded Kokupu; LFE = Long Finned Eel; K= Koaro
River Declining species present Number
Awatere Longfin eel Torrentfish Giant kokopu Koaro Inanga Short jaw kokopu Redfin bully 7
Coastal 1 Longfin eel Torrentfish Giant kokopu Koaro Inanga Short jaw kokopu Bluegill bully Redfin bully Lampray 9
East Cape/
Coastal 2 Longfin eel Inanga Redfin bully 3
Maraetaha/
Coastal 5 Longfin eel Inanga Redfin bully 3
Motu Longfin eel Torrentfish Koaro Short jaw kokopu Bluegill bully 5
Pakaraae/ Coastal
4 Longfin eel Bluegill bully 2
Turanganui/
Gisborne Longfin eel Inanga Redfin bully 3
Uawa Longfin eel Torrentfish Inanga Bluegill bully 4
Waiapu Longfin eel Torrentfish Giant kokopu Koaro Inanga Short jaw kokopu Redfin bully 7
Waipaoa Longfin eel Torrentfish Koaro Inanga Bluegill bully Redfin bully 6
Waipiro/ Coastal
3 Longfin eel Koaro Redfin bully 3
Wharekahika Longfin eel Torrentfish Giant kokopu Koaro Inanga Short jaw kokopu Bluegill bully Redfin bully 8
Significance thresholds (highlighted importance column)
Green High = National
Blue Medium = Regional
Yellow Low = Local
Miscellaneous (highlighted rivers)
Pink Rivers overlap withneighbouring council
Data reliability (font colour)
Black Reliable data
Blue/Purple Less reliable data
Red Data checked by Expert Panel and has been adjusted
RiVAS+ (highlighted rivers and cells in rows)
Blue Also assessed for potential future state (RiVAS+)
Orange Score changed by proposed interventions (RiVAS+)