R E S E A R C H A R T I C L E
Open Access
Multi-institutional analysis of independent
predictors for burn mortality in the United
States
Dmitry Zavlin
1*, Vishwanath Chegireddy
1, Stefanos Boukovalas
2, Anna M. Nia
3, Ludwik K. Branski
2,
Jeffrey D. Friedman
1and Anthony Echo
1Abstract
Background:Previous reports individually identified different factors that predict death after burns. The authors employed the multi-center American Burn Association’s (ABA) National Burn Repository (NBR) to elucidate which parameters have the highest negative impact on burn mortality.
Methods:We audited data from the NBR v8.0 for the years 2002–2011 and included 137,061 patients in our study. The cases were stratified into two cohorts based on the primary outcome of death/survival and then evaluated for demographic data, intraoperative details, and their morbidity after admission. A multivariable regression analysis aimed to identify independent risk factors associated with mortality.
Results:A total of 3.3% of patients in this analysis did not survive their burn injuries. Of those, 52.0% expired within 7 days after admission. Patients in the mortality cohort were of older age (p< 0.001), more frequently female (p< 0.001), and had more pre-existing comorbidities (p< 0.001). Total body surface area (TBSA), inhalation injury, hospitalization time, and occurrence of complications were higher compared to survivors (p< 0.001). Lack of insurance (odds ratio (OR) = 1.84, confidence interval (CI) 1.38–2.46), diabetes (OR = 1.24, CI 1.01–1.53), any complication (OR = 4.09, CI 3.27–5.12), inhalation injury (OR = 3.84, CI 3.38–4.36), and the need for operative procedures (OR = 2.60, CI 2.20–3.08) were the strongest independent contributors to mortality after burns (p< 0. 001). Age (OR = 1.07, CI 1.06–1.07) and TBSA (OR = 1.09, CI 1.09–1.09) were significant on a continuous scale (p< 0. 001) while overall comorbidities were not a statistical risk factor.
Conclusion:Uninsured status, inhalation injury, in-hospital complications, and operative procedures were the strongest mortality predictors after burns. Since most fatal outcomes (52.0%) occur within 7 days after injury, physicians and medical staff need to be aware of these risk factors upon patient admission to a burn center.
Keywords:Burns, Mortality, Death, Risks, Outcomes
Background
Over the past years, various healthcare registries estab-lished enormous databases of information, which include patient characteristics, diagnostic codes, therapeutic man-agement, and complication profiles. The massive volume of medical records allows researchers to investigate ques-tions that otherwise would be impossible to address
due to the logistical constraints of individual centers. The concept of burn database development was origin-ally introduced by Dr. Irving Feller from the University of Michigan, who established the National Burn Infor-mation Exchange in 1964. With the American Burn As-sociation (ABA) as a spearhead, this program has substantially evolved by creating an electronic burn registry [1]. In 2001, the ABA assumed the responsibil-ity of the national database, which is now known as the National Burn Repository (NBR) [2]. This database has played a vital role in collecting information on patients who receive treatment at burn centers in the United * Correspondence:[email protected]
1Institute for Reconstructive Surgery, Houston Methodist Hospital, Weill
Cornell Medicine, 6560 Fannin Street, Scurlock Tower, Suite 2200, Houston, TX 77030, USA
Full list of author information is available at the end of the article
States (US) and provides valuable resources for investi-gative burn research [3].
Research in the field of burns has been translated to improved survival rates, decreased hospital length of stay, reduced morbidity and mortality rates due to the development of resuscitation protocol, infection control, early wound debridement, early enteral nutrition, respira-tory support, and support of hypermetabolic responses. Ac-cording to federal surveys, there were 486,000 burn injuries reported in the US in 2016 alone that required medical treatment. Of those, a total of 3275 resulted in death [4].
Several studies over the past decade have exploited the enormous information available in the NBR to improve care in burn injuries and reduce mortality rates. Carr et al. have reviewed the NBR from 1998 to 2007 to deter-mine the outcomes in burn patients with inhalation in-jury complicated by pneumonia [5]. Bedri et al. demonstrated higher mortality rates after burn injuries associated with lower socioeconomic status, female gen-der, and African-American race [6]. Osler et al. used the database to create a logistic regression model that showed how age, burned surface area, and inhalation injury con-tributed to mortality. Based on this analysis, they proposed a revised Baux score to improve predictions of mortality after burn injuries [7].
Age, burn size, and inhalation injury have been re-peatedly reported as contributors to unfavorable out-comes [5, 6, 8]. However, we intended to expand on these studies and evaluate the importance of other fac-tors as well. The objective of this report is to employ the large multi-institutional NBR database to identify the predictors of mortality after burn injuries by utilizing a detailed regression model controlling for confounders. Furthermore, the time to death is evaluated for those pa-tients with fatal outcomes.
Methods
Patients
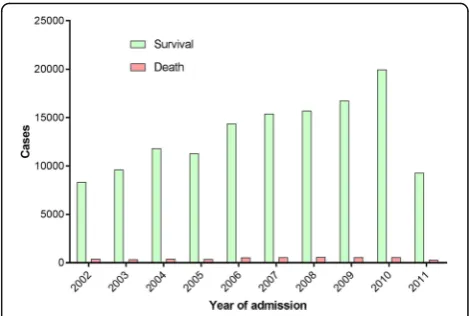
Data sources for our study were the eighth and latest ver-sion of the NBR dataset provided by the ABA which con-tained patient information of children as well as adults between 2002 and 2011 (Fig.1). This repository is updated prospectively and on a regular basis by the participating ABA institutions that are certified burn centers (Fig. 2). Initially, a total of 172,640 cases were extracted from the entire dataset. After removing re-admissions (100), pa-tients with a total body surface area (TBSA) burn of 0% or missing data (33,466), and those with missing mortality formation (2013), the remaining 137,061 patients were in-cluded in this study (Fig. 3). We created two cohorts based on whether a patient passed away after the burn in-jury or survived and was discharged from the burn center.
The majority of variables are provided in the primary datafile “Main_v8.” We collected patient demographics,
preoperative comorbidities, treatment details, and subse-quent outcomes, including morbidity and mortality, and compared between the two cohorts. Demographics in-cluded age, gender, race, social factors, and the most prevalent comorbidities. Clinical details entailed variables, such as burn type, partial- and full-thickness burned TBSA, duration of hospitalization, and need for intub-ation/ventilation or operative procedures. The outcomes were measured by frequency of complications and an evaluation of the cause of death within the study cohort.
Comorbidities and complications are listed in separ-ate datafiles named“Comorbidities_v8” and “Complica-tions_v8,” respectively. In these files, only the presence of variables is documented for each patient.
Finally, a logistic regression analysis aimed to detect independent risk factors associated with death following a burn injury. Written consent from the ABA is available for the use of this database. No institutional review board approval was obtained at our home institution since the datasets are provided in de-identified format.
Statistics
Various descriptive statistics were created for both pa-tient cohorts meeting the inclusion criteria. The univari-ate analysis compared the two cohorts’ demographics, clinical details, and final outcomes. The statistical level of significance was set at 5% (p< 0.05) for all calculations using the unpaired samplettest for continuous and the chi-square test for categorical variables. Cases with miss-ing variables were omitted from the calculations and their number shown separately.
Fig. 2Map of the United States (US) and states participating in the National Burn Respository (NBR).
This map shows which US states host American Burn Association (ABA)-approved burn centers that upload data to the NBR (green), do not upload data to the NBR (red), or do not have any burn centers at all (gray)
Fig. 3Flowchart depicting case selection and exclusion process.
A number of variables were gathered for a multivari-able logistical regression analysis in order to control for confounders and to quantify the influence of various fac-tors on mortality rates. Odds ratios (OR) and 95% confi-dence intervals (CI) of independent variables, such as age, gender, race, uninsured status, comorbidities, com-plications, inhalation injury, TBSA, and operative proce-dures, were calculated in their statistical association to death as a dichotomous dependent outcome. By adding multiple independent variables into one single regression model, the influence of each risk is controlled with re-gard to the other variables if any confounders should exist [9].
The statistical aspects of this study were conducted using SPSS version 24.0 (IBM Corp., Armonk, NY).
Results
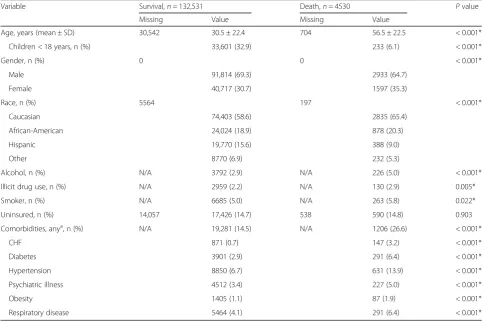
Of all patients included in this study, 132,531 (96.7%) survived their burn injury while 4530 (3.3%) did not. On average, the mortality cohort was much older (56.5 vs. 30.5 years, p< 0.001) and had a higher proportion of
female patients (35.3% vs. 30.7%, p< 0.001) although the male gender was overall predominant. The deceased sub-group had a much lower proportion of children under the age of 18 years (6.1% vs. 32.9%, p< 0.001). Caucasians and African-Americans were slightly more present in our cohort of patients who did not survive their burn injury. There was no difference in the number of uninsured people between both groups. However, pa-tients who passed away over the course of their burn injury were more likely to be smokers (5.8% vs. 5.0%,p = 0.022), illicit drug users (2.9% vs. 2.2%,p= 0.005), and suffering from alcoholism (5.0% vs. 2.9%, p< 0.001). In addition, these deceased patients had higher ratios of any kind of comorbidity documented by the NBR com-pared to the control group of survivors (26.6% vs. 14.5%, p< 0.001). These discrepancies remained highly significant when analyzing specific diseases separately (Table1).
Those patients who died after their injury were more likely to have experienced fire or flame burns (47.6%) in relation to those who survived (24.5%, p< 0.001). Their
Table 1Demographic variables of the burn patients
Variable Survival,n= 132,531 Death,n= 4530 Pvalue
Missing Value Missing Value
Age, years (mean ± SD) 30,542 30.5 ± 22.4 704 56.5 ± 22.5 < 0.001*
Children < 18 years, n (%) 33,601 (32.9) 233 (6.1) < 0.001*
Gender, n (%) 0 0 < 0.001*
Male 91,814 (69.3) 2933 (64.7)
Female 40,717 (30.7) 1597 (35.3)
Race, n (%) 5564 197 < 0.001*
Caucasian 74,403 (58.6) 2835 (65.4)
African-American 24,024 (18.9) 878 (20.3)
Hispanic 19,770 (15.6) 388 (9.0)
Other 8770 (6.9) 232 (5.3)
Alcohol, n (%) N/A 3792 (2.9) N/A 226 (5.0) < 0.001*
Illicit drug use, n (%) N/A 2959 (2.2) N/A 130 (2.9) 0.005*
Smoker, n (%) N/A 6685 (5.0) N/A 263 (5.8) 0.022*
Uninsured, n (%) 14,057 17,426 (14.7) 538 590 (14.8) 0.903
Comorbidities, anya, n (%) N/A 19,281 (14.5) N/A 1206 (26.6) < 0.001*
CHF 871 (0.7) 147 (3.2) < 0.001*
Diabetes 3901 (2.9) 291 (6.4) < 0.001*
Hypertension 8850 (6.7) 631 (13.9) < 0.001*
Psychiatric illness 4512 (3.4) 227 (5.0) < 0.001*
Obesity 1405 (1.1) 87 (1.9) < 0.001*
Respiratory disease 5464 (4.1) 291 (6.4) < 0.001*
*Significant withp< 0.05
a
Alcoholism, bleeding disorder, chemotherapy, congenital anomalies, CHF, connective tissue disease, current smoker, dialysis, CVA, diabetes mellitus, cancer, drug abuse, esophageal varices, dependent health status, history of angina/MI, hypertension, immunodeficiency, neurological impairment, obesity, other, prematurity, psychiatric illness, respiratory disease, steroid use, and transplant of organ(s)
TBSA for both split- and full-thickness burns were much higher (bothp< 0.001) and an indicator for more severe injuries. In addition, patients with lethal burns had sig-nificantly more inhalation injuries (46.1% vs. 5.7%), which required more intubations (80.9% vs. 9.8%), and were subsequently ventilated and in an intensive care unit for an extensively prolonged time (all p< 0.001, Table 2). With a longer mean hospitalization time (18.0 vs. 9.4 days), higher number of operations (2.4 vs. 1.0), and a greater number of total surgical procedures (4.0 vs. 1.7), the care for patients who did not survive generated much higher costs, $264,000 vs. $79,000 (all p< 0.001, Table 2).
Overall, patients who died following their burn injury were more likely to suffer complications (31.9%) than those who survived their trauma (13.7%, p< 0.001). In our study group, these were most likely respiratory fail-ure (12.8%), septic disorder (10.0%), renal failfail-ure (9.9%), and pneumonia (9.8%). The three most frequent causes of death reported for our 4530 deceased patients were multi-organ failure (25.6%), burn shock (16.0%), and car-diovascular shock (11.0%) in (Table3).
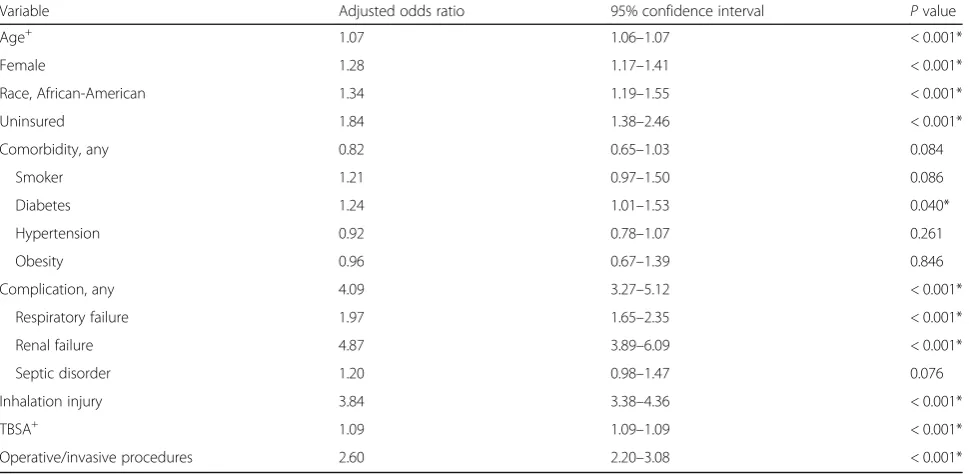
Multivariable analysis revealed that numerous items were independent risk factors for lethal outcomes of burns; older age (OR = 1.07) and increasing TBSA (OR = 1.09) were continuous variables related to higher mortality (p< 0.001). Comorbidities in general did not ne-cessarily correlate to death after a burn injury (OR = 0.82,
p= 0.084), but diabetes (OR = 1.24, p= 0.040) individu-ally was directly linked to a higher risk of mortality. In spite of a smaller ratio of women in our study, female gender independently correlated with death due to burns (OR = 1.28, p< 0.001). Nevertheless, the stron-gest factors contributing to a lethal outcome were lack of insurance (OR = 1.84), occurrence of complications (OR = 4.09), necessity for operative or invasive inter-ventions (OR = 2.60), and the presence of an inhalation injury (OR = 3.84). These four variables were all statis-tically significant in their impact (p< 0.001, Table4).
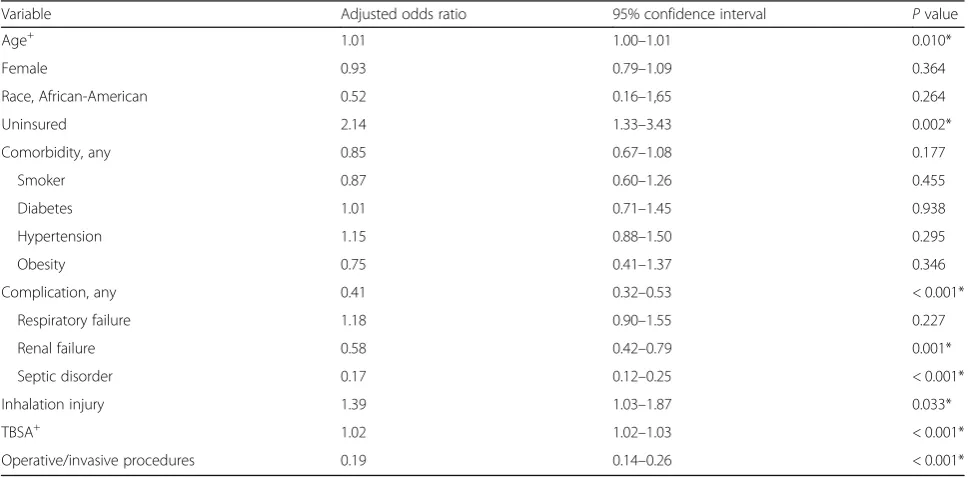
In the deceased group, 25.5% patients passed away by post-admission day 1, 37.3% by day 3, and 52.0% by day 7 (Fig. 4). Of those 52,052 patients that required hospitalization of 7 days or longer, 4.4% ultimately passed away. This number increased to 9.3% for pa-tients with a minimum hospitalization/survival of 30 days (n= 9304) and to 11.6% with a hospitalization of 90 days or longer (n= 1166). Our subgroup regression analysis revealed that older patients (OR = 1.01,p= 0.010), those with larger burned TBSA (OR = 1.02, p< 0.001), with inhalation injury (OR = 1.39, p= 0.033), and par-ticularly patients without health insurance (OR = 2.14, p= 0.002) were more likely to pass away early within 7 days rather than later. On the other hand, the pa-tients that deceased more than 7 days after admission were more likely (p< 0.001) to develop complications and undergo operative procedures (Table5).
Table 2Clinical details of the burn patients
Variable Survival,n= 132,531 Death,n= 4530 Pvalue
Missing Value Missing Value
Burn type, top 5, n (%) 0 0 < 0.001*
Fire/flame 32,519 (24.5) 2150 (47.5)
Scald 29,953 (22.6) 215 (4.7)
Contact with hot object 7737 (5.8) 52 (1.1)
Electrical 2739 (2.1) 62 (1.4)
Chemical 1747 (1.3) 12 (0.3)
TBSA, % (mean ± SD) 0 8.0 ± 10.4 0 43.2 ± 29.4 < 0.001*
TBSA, full-thickness, % (mean ± SD) 25,071 2.8 ± 7.8 269 31.6 ± 30.9 < 0.001*
Inhalation injury, n (%) 31,418 5786 (5.7) 880 1682 (46.1) < 0.001*
Intubation, n (%) 0 12,956 (9.8) 0 3664 (80.9) < 0.001*
Ventilator, days (mean ± SD) 17,263 1.8 ± 10.1 402 14.1 ± 25.4 < 0.001*
ICU stay, days (mean ± SD) 24,375 4.1 ± 12.9 539 15.6 ± 26.5 < 0.001*
Hospitalization, days (mean ± SD) 652 9.4 ± 20.7 16 18.0 ± 31.2 < 0.001*
Trips to OpR (mean ± SD) 31,347 1.0 ± 2.8 1088 2.4 ± 5.6 < 0.001*
Operative/invasive procedures (mean ± SD) 31,347 1.7 ± 4.6 1088 4.0 ± 8.7 < 0.001*
Hospital charges, in 1000 US Dollar (mean ± SD) 83,078 79 ± 235 2791 264 ± 471 < 0.001*
*Significant withp< 0.05
ICUintensive care unit,OpRoperating room,SDstandard deviation,TBSAtotal body surface area,USUnited States
Table 3Morbidity and mortality of the burn patients
Variable Survival,n= 132,531 Death,n= 4530 Pvalue
Missing Value Missing Value
Complication, any, n (%) N/A 18,140 (13.7) N/A 1445 (31.9) < 0.001*
Stroke 185 (0.1) 29 (0.6) < 0.001*
DVT 382 (0.3) 33 (0.7) < 0.001*
ARDS 320 (0.2) 186 (4.1) < 0.001*
Respiratory failure 1491 (1.1) 582 (12.8) < 0.001*
Renal failure 540 (0.4) 448 (9.9) < 0.001*
Arrhythmia 638 (0.5) 139 (3.1) < 0.001*
Pneumonia 2155 (1.6) 443 (9.8) < 0.001*
Urinary tract infection 1299 (1.0) 77 (1.7) < 0.001*
Septic disorder 1548 (1.2) 451 (10.0) < 0.001*
Wound infection 4197 (3.2) 197 (4.3) < 0.001*
Decubitus ulcer 319 (0.2) 38 (0.8) < 0.001*
Cause of death, top 3, n (%) – – 924
Multi-organ system failure 924 (25.6) –
Burn shock 578 (16.0) –
Cardiovascular failure 396 (11.0) –
*Significant withp< 0.05
ARDSacute respiratory distress syndrome,DVTdeep venous thrombosis,N/Anot available
It showed the patients in the deceased group suffered many more complications after their burn trauma
Table 4Multivariable regression analysis of mortality as outcome
Variable Adjusted odds ratio 95% confidence interval Pvalue
Age+ 1.07 1.06–1.07 < 0.001*
Female 1.28 1.17–1.41 < 0.001*
Race, African-American 1.34 1.19–1.55 < 0.001*
Uninsured 1.84 1.38–2.46 < 0.001*
Comorbidity, any 0.82 0.65–1.03 0.084
Smoker 1.21 0.97–1.50 0.086
Diabetes 1.24 1.01–1.53 0.040*
Hypertension 0.92 0.78–1.07 0.261
Obesity 0.96 0.67–1.39 0.846
Complication, any 4.09 3.27–5.12 < 0.001*
Respiratory failure 1.97 1.65–2.35 < 0.001*
Renal failure 4.87 3.89–6.09 < 0.001*
Septic disorder 1.20 0.98–1.47 0.076
Inhalation injury 3.84 3.38–4.36 < 0.001*
TBSA+ 1.09 1.09–1.09 < 0.001*
Operative/invasive procedures 2.60 2.20–3.08 < 0.001*
*Significant withp< 0.05
+
Continuous variable
Discussion
The current database literature examining the risk fac-tors for morbidity and mortality after burns typically focuses on specific variables, such as age, gender, or so-cioeconomic status [6, 10, 11]. In these cases, the true risk amplification, which is illustrated by the OR and
respective 95% CI, may be distorted if the multivariable analysis is not broad enough to include variables, such as comorbidities and in-hospital complications. Other au-thors may use datasets that are not up-to-date any longer or contain invalid data and thus mandate reevaluation [7, 11,12]. Additionally, older versions of the NBR were in-deed prone to missing information [2]. Single-center stud-ies, on the other hand, usually face statistical limitations of low case numbers with an enrolled patient population that may not be representative for every clinical setting in the US [13–18]. The purpose of this report was to identify the strongest risk factors for mortality in burn patients using a large multi-institutional database as guidance for better patient management and outcome prognosis.
In this study, patients in the death cohort were al-most twice as old, more likely a female, Caucasian or African-American, and also had significantly increased rates of comorbidities and health-hazardous behavior such as smoking or alcohol use. Interestingly, these co-morbidities—with the exception of diabetes—did not statistically contribute to the patients’ mortality. The NBR collects a wide variety of comorbidities and in-cludes nonspecific categories, such as “steroid use,” “psychiatric illness,” and even “others,” which may at-tenuate the significance of comorbidities in general. Pompermaier et al. also argued that comorbidities play an inferior role in comparison to age in burn mortality models [19]. On the other hand, Knowlin et al. Fig. 4Frequency of death based on the time after admission.
This figure makes it clearly evident that the majority of burn patients typically pass away within the first few days after arrival at the burn center. The graph only shows post-admission days 0–30 while the first bar (day 0) corresponds with“dead on arrival”
Table 5Multivariable regression analysis for early death (≤7 days) vs. late death (> 7 days)
Variable Adjusted odds ratio 95% confidence interval Pvalue
Age+ 1.01 1.00
–1.01 0.010*
Female 0.93 0.79–1.09 0.364
Race, African-American 0.52 0.16–1,65 0.264
Uninsured 2.14 1.33–3.43 0.002*
Comorbidity, any 0.85 0.67–1.08 0.177
Smoker 0.87 0.60–1.26 0.455
Diabetes 1.01 0.71–1.45 0.938
Hypertension 1.15 0.88–1.50 0.295
Obesity 0.75 0.41–1.37 0.346
Complication, any 0.41 0.32–0.53 < 0.001*
Respiratory failure 1.18 0.90–1.55 0.227
Renal failure 0.58 0.42–0.79 0.001*
Septic disorder 0.17 0.12–0.25 < 0.001*
Inhalation injury 1.39 1.03–1.87 0.033*
TBSA+ 1.02 1.02
–1.03 < 0.001*
Operative/invasive procedures 0.19 0.14–0.26 < 0.001*
Early death:n= 2356; late death:n= 2174 *Significant withp< 0.05
+
Continuous variable
demonstrated in a single-center study that comorbidi-ties are in fact associated with increased mortality after burns [20]. In our outcome analysis, other clinical fac-tors were more predominant. Discrepancies in immune response have been suggested as an explanation for the increased mortality of females [21]. Variables, such as TBSA (mean 43.2% in death cohort), inhalation injury (46.1%), any form of in-hospital complications (31.9%), and subsequent operative procedures (mean 4.0), were more decisive for our deceased patients and reached significance in the multivariable analysis. Given the fairly low rates of pre-existing comorbidities (respira-tory disease 6.4%), the majority of post-operative compli-cations in deceased patients, such as respiratory failure, pneumonia, and septic failure, can be confidently related to the burn trauma itself. In addition, we demonstrated through multivariable regression that a lack of health in-surance comes with a similar risk (OR = 1.84,p< 0.001) as a respiratory failure (OR = 1.97, p< 0.001). Interestingly, uninsured patients had a similar total TBSA (9.3% vs. 9.1%,p= 0.054) and full-thickness TBSA (3.7% vs. 3.9%,p = 0.053) on univariate analysis compared to insured pa-tients. Therefore, insurance or socioeconomic status does not necessary put someone at risk for a more severe burn injury, but it does contribute to fatal outcomes. In addition, the lack of health insurance is a significant risk factor for early death within 7 days (Table 5). In critical and especially life-threatening injuries such as burns, healthcare providers in the US are required to provide maximum treatment regardless of economic consider-ations. Nevertheless, lack of insurance appeared as a sig-nificant risk factor [22]. In 2010, the Affordable Care Act was passed giving more people access to health insurance and reducing their general mortality rates [23]. We are confident that these positive trends will be similar in the burn population. Additionally, African-American race was a significant independent factor contributing to mortality risk although African-Americans had higher uninsured status (15.7%) compared to Hispanics (14.9%) or Caucasians (12.5%). Patients who did not survive their burn injuries required longer hospitalization times, includ-ing intensive care unit (ICU) stays, and suffered more complications, which often had to be addressed with inva-sive procedures and trips to the operating room. The interaction of these aggravating circumstances increased the final inpatient costs.
Strassle et al., similar to our results, reported from a sin-gle burn center where increasing age and TBSA, as well as inhalation injury, were identified as hazards related to mortality. However, they could not reach significance for the following variables, such as gender or ethnicity. Their graphs showed how prolonged hospitalization increased overall mortality similar to our univariate analysis [18]. O’Keefe and colleagues faced connatural statistical
limitations in their single-center design where numerous calculations did not reach significance [17].
Studies using the NBR as primary data source gener-ally achieved results analog to ours. Age, gender, race, TBSA, and an inhalation injury were significant for mor-tality in Bedri et al.’s regression model, yet the authors did not include the occurrence of complications or the need for operative procedures. In their study, operative procedures were a primary outcome rather than an inde-pendent variable as used in our report. Furthermore, the authors did not exclude cases with missing death/sur-vival outcome (variable “dead” in NBR) before perform-ing any statistical analysis regardperform-ing mortality [6]. Perhaps, it was for this reason why they reported con-comitant comorbidities as risk factors for death. On the other hand, in our report, only diabetes was determined as a significant contributor to mortality.
Some previously mentioned variables were detected as significant in even an older version of the NBR database yet their risk amplification differed [24]. Taylor et al., on the other hand, merely focused on age and TBSA as variables correlating with death after burn injury. They fittingly concluded that pediatric patients should be evaluated separately from adults and the elderly since the importance of risk factors varies by cohort [10]. Age, TBSA, inhalation disorder, comorbidities, and lack of available beds were also mortality risks in a large British multi-institutional analysis. These findings indicate that the burdens of burn injuries are internationally universal regardless of the healthcare system. [25] The Baux [26] and the FLAMES (Fatality by Longevity, acute physi-ology and chronic health evaluation II (APACHE II) score, Measured Extent of Burn, and Sex) score [15] are prognostic factors that are often encountered in burn research. However, they are created by compiling two or more measures, such as age, gender, TBSA, or the APACHE II score, into one composite variable as a form of outcome estimate and may yet again lack the input of other risk factors.
ethnicity, are inherent to an individual patient and sim-ply need to be kept at the back of one’s mind. In cases where a highly adverse prognosis is established, with-drawal of life support may represent a sensible option for these patients [28]. Furthermore, after the initially critical period after burn injuries when most deaths oc-curred (Fig. 4), patients had increasing mortality rates with 7, 30, and 90 days of hospitalization—4.4, 9.3, and 11.6%, respectively. Some of the results presented in this article play a role in the current development of the Burn Quality Improvement Program (BQIP) [29], which may ultimately produce a calculator to estimate realistic outcomes of burned patients using data col-lected in the NBR. We employed a large multi-center database in a detailed multivariable analysis to assess the individual impact of each perceivable risk factor. The variety of results in the literature shows that re-gression models need to be carefully designed for ac-curate hazard estimates.
Our study is not without limitations. The NBR is an administrative database that is tended to by the institu-tions and their study staff who upload the patient de-tails that depend on accurate reporting and are subject to individual errors. The countless participants in-cluded in our study come from a vast variety of institu-tions. Certain US states do not operate burn centers or none that reported to the NBR within our study period (Fig. 2). Our results may therefore vary between hospi-tals. Furthermore, most variables have experienced modifications over the recent years and may include portions with missing data, which we had to disregard or remove from our analyses as described in this arti-cle’s methodology. Comorbidities and complications re-ported in this article originate from separate files, which had to be carefully restructured and merged with the main dataset containing the majority of variables. Furthermore, information about prior treatment at other hospitals is not provided for patients who are transferred to an NBR burn center. Although the NBR provides the cause of death for most cases, it does not report how often withdrawal of treatment occurred. Due to the nature of the database, we also cannot evaluate various surgical techniques used in the treat-ment of our patients who had an average of 1.7 ± 4.6 (survival group) and 4.0 ± 8.7 (death group) procedures performed during their hospitalization. The odds ratios of our regression analysis may fluctuate between differ-ent patidiffer-ents who may presdiffer-ent with differdiffer-ent types of burns and different Abbreviated Burn Severity Index (ABSI) scores [30]. The risks identified in this study originate from thousands of cases provided by the NBR and are average figures of US burn centers.
As this is a retrospective study, all significant findings have associative and not causative character.
Conclusion
This study is one of the first that analyzed various risk factors and their individual impact on death after burn injuries on a large multi-institutional scale. The diagno-sis of inhalation injury, the occurrence of inpatient com-plications, the need for operative or invasive procedures, and lack of health insurance were determined as leading contributors to mortality. Age and burned TBSA con-tinuously increased the probability of death. Knowing that the majority of critical burn patients (52.0%) passed away within the first 7 days of admission, physicians and staff in burn centers should be aware of these risk factors. Additional research is warranted to help under-stand why certain patient characteristics (uninsured sta-tus, female gender) are such significant contributors for mortality after burns.
Abbreviations
ABA:American Burn Association; ABSI: Abbreviated Burn Severity Index; APACHE II: Acute physiology and chronic health evaluation II; ARDS: Acute respiratory distress syndrome; BQIP: Burn Quality Improvement Program; CHF: Chronic heart failure; CI: Confidence interval; CVA: Cerebrovascular accident; DVT: Deep venous thrombosis; FLAMES: Fatality by Longevity, APACHE II score, Measured Extent of Burn, and Sex; ICU: Intensive care unit; MI: Myocardial infarction; NBR: National Burn Repository; N/A: Not available; OpR: Operating room; OR: Odds ratio; SD: Standard deviation; TBSA: Total body surface area; US: United States
Availability of data and materials
The raw data used in this study are available through the American Burn Association upon reasonable written request (https://ameriburn.org/research/ obtaining-burn-data/).
Disclosure
The American Burn Association and its hospitals participating in the National Burn Repository are the source of the data used herein. They have not verified and are not responsible for the statistical validity of the data analyses or the conclusions presented in this article. The authors obtained written permission from the ABA before accessing the database.
Authors’contributions
DZ, JDF, and AE designed the study. DZ, VC, SB, and AMN analyzed and interpreted the data. DZ drafted the manuscript. VC, SB, LKB, JDF, and AE reviewed and revised the manuscript. DZ and AMN made the revisions after the journal’s first peer review. All authors approved the final manuscript in its current form and consent to publication.
Ethics approval and consent to participate
No informed consent or institutional review board approval was obtained as the patient data from the National Burn Repository are only available in a de-identified format. No studies on animals were performed. The authors adhered to the Declaration of Helsinki at all times.
Consent for publication Not applicable.
Competing interests
None of the authors, nor their close family members, has a financial interest in any of the products, devices, or drugs mentioned in this manuscript. Furthermore, the authors declare that no commercial associations or financial disclosures exist that might pose or create a conflict of interest with information presented in this manuscript.
Author details
1Institute for Reconstructive Surgery, Houston Methodist Hospital, Weill
TX 77030, USA.2Division of Plastic Surgery, The University of Texas Medical Branch, Galveston, TX, USA.3School of Medicine, The University of Texas Medical Branch, Galveston, TX, USA.
Received: 9 April 2018 Accepted: 16 July 2018
References
1. Saffle JR. The current status of the NATIONAL TRACS/ABA Burn Registry. J Burn Care Rehabil. 1997;18(2):172–5.
2. Bessey PQ, Phillips BD, Lentz CW, Edelman LS, Faraklas I, Finocchiaro MA, et al. Synopsis of the 2013 annual report of the national burn repository. J Burn Care Res. 2014;35(Suppl 2):S218–34.
3. Taylor SL, Lee D, Nagler T, Lawless MB, Curri T, Palmieri TL. A validity review of the National Burn Repository. J Burn Care Res. 2013;34(2):274–80. 4. American Burn Association. Burn Incidence Fact Sheet,http://ameriburn.org/
who-we-are/media/burn-incidence-fact-sheet/; 2016 [accessed 02 Sept 2017]. 5. Carr JA, Phillips BD, Bowling WM. The utility of bronchoscopy after
inhalation injury complicated by pneumonia in burn patients: results from the National Burn Repository. J Burn Care Res. 2009;30(6):967–74. 6. Bedri H, Romanowski KS, Liao J, Al-Ramahi G, Heard J, Granchi T, et al. A
national study of the effect of race, socioeconomic status, and gender on burn outcomes. J Burn Care Res. 2017;38(3):161–8.
7. Osler T, Glance LG, Hosmer DW. Simplified estimates of the probability of death after burn injuries: extending and updating the Baux score. J Trauma. 2010;68(3):690–7.
8. Ryan CM, Schoenfeld DA, Thorpe WP, Sheridan RL, Cassem EH, Tompkins RG. Objective estimates of the probability of death from burn injuries. N Engl J Med. 1998;338(6):362–6.
9. Pourhoseingholi MA, Baghestani AR, Vahedi M. How to control confounding effects by statistical analysis. Gastroenterol Hepatol Bed Bench. 2012;5(2):79–83. 10. Taylor SL, Lawless M, Curri T, Sen S, Greenhalgh DG, Palmieri TL. Predicting
mortality from burns: the need for age-group specific models. Burns. 2014; 40(6):1106–15.
11. Kerby JD, McGwin G Jr, George RL, Cross JA, Chaudry IH, Rue LW 3rd. Sex differences in mortality after burn injury: results of analysis of the National Burn Repository of the American Burn Association. J Burn Care Res. 2006; 27(4):452–6.
12. Miller SF, Bessey PQ, Schurr MJ, Browning SM, Jeng JC, Caruso DM, et al. National Burn Repository 2005: a ten-year review. J Burn Care Res. 2006; 27(4):411–36.
13. Bloemsma GC, Dokter J, Boxma H, Oen IM. Mortality and causes of death in a burn centre. Burns. 2008;34(8):1103–7.
14. Fazeli S, Karami-Matin R, Kakaei N, Pourghorban S, Faramani R, Safari-Faramani B. Predictive factors of mortality in burn patients. Trauma Monthly. 2014;19(1):e14480.
15. Gomez M, Wong DT, Stewart TE, Redelmeier DA, Fish JS. The FLAMES score accurately predicts mortality risk in burn patients. J Trauma. 2008;65(3):636–45. 16. Woods JFC, Quinlan CS, Shelley OP. Predicting mortality in severe
burns—what is the score?: evaluation and comparison of 4 mortality prediction scores in an Irish population. Plastic and Reconstructive Surgery Global Open. 2016;4(1):e606.
17. O’Keefe GE, Hunt JL, Purdue GF. An evaluation of risk factors for mortality after burn trauma and the identification of gender-dependent differences in outcomes. J Am Coll Surg. 2001;192(2):153–60.
18. Strassle PD, Williams FN, Napravnik S, van Duin D, Weber DJ, Charles A, et al. Improved survival of patients with extensive burns: trends in patient characteristics and mortality among burn patients in a tertiary care burn facility, 2004–2013. J Burn Care Res. 2017;38(3):187–93.
19. Pompermaier L, Steinvall I, Fredrikson M, Sjoberg F. Inclusion of coexisting morbidity in a TBSA% and age based model for the prediction of mortality after burns does not increase its predictive power. Burns. 2015;41(8):1868–76. 20. Knowlin L, Stanford L, Moore D, Cairns B, Charles A. The measured effect
magnitude of co-morbidities on burn injury mortality. Burns. 2016;42(7):1433–8. 21. Karimi K, Faraklas I, Lewis G, Ha D, Walker B, Zhai Y, et al. Increased mortality
in women: sex differences in burn outcomes. Burns Trauma. 2017;5:18. 22. Wilper AP, Woolhandler S, Lasser KE, McCormick D, Bor DH, Himmelstein
DU. Health insurance and mortality in US adults. Am J Public Health. 2009; 99(12):2289–95.
23. McClellan C. The Affordable Care Act’s Dependent Care Coverage and Mortality. Med Care. 2017;55(5):514–9.
24. McGwin G Jr, George RL, Cross JM, Rue LW. Improving the ability to predict mortality among burn patients. Burns. 2008;34(3):320–7.
25. Stylianou N, Carr M, Kontopantelis E, Buchan I, Dunn K. Patient outcomes vs. service workload: an analysis of outcomes in the burn service of England and Wales. BMC Health Serv Res. 2015;15:133.
26. Roberts G, Lloyd M, Parker M, Martin R, Philp B, Shelley O, et al. The Baux score is dead. Long live the Baux score: a 27-year retrospective cohort study of mortality at a regional burns service. J Trauma Acute Care Surg. 2012; 72(1):251–6.
27. Afify MM, Mahmoud NF, Abd El Azzim GM, El Desouky NA. Fatal burn injuries: a five year retrospective autopsy study in Cairo city, Egypt. Egyptian J Forensic Sci. 2012;2(4):117–22.
28. Pham TN, Otto A, Young SR, Kramer CB, Heimbach DM, Gibran NS, et al. Early withdrawal of life support in severe burn injury. J Burn Care Res. 2012; 33(1):130–5.
29. American Burn Association. Burn Quality Improvement Program, Version 2.3, http://ameriburn.org/wp-content/uploads/2017/05/16d-0615-pq_mk-bqip-definitions-edited-may-2_june-15-2016.pdf; 2016 [accessed 02 Sept 2017]. 30. Tobiasen J, Hiebert JM, Edlich RF. The abbreviated burn severity index. Ann