R E S E A R C H
Open Access
Gene expression profiling in uveal
melanoma: technical reliability and
correlation of molecular class with
pathologic characteristics
Kristen M. Plasseraud
1, Jeff K. Wilkinson
2, Kristen M. Oelschlager
2, Trisha M. Poteet
2, Robert W. Cook
1,
John F. Stone
2and Federico A. Monzon
1*Abstract
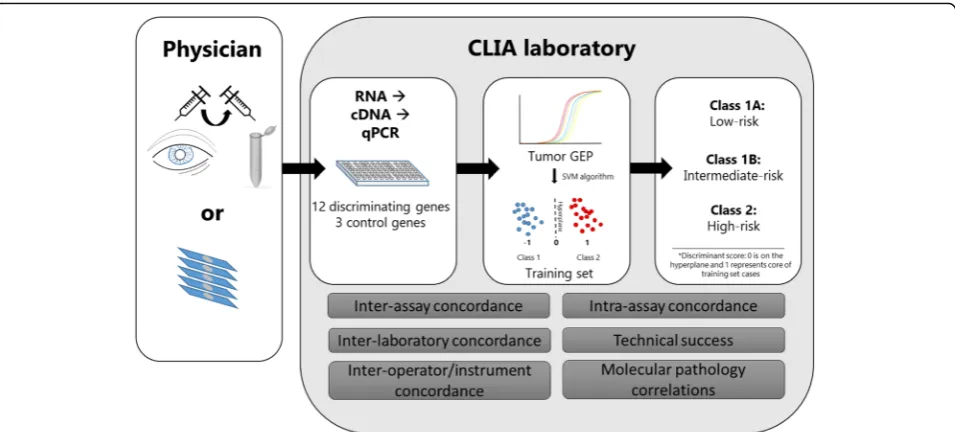
Background:A 15-gene expression profile test has been clinically validated and is widely utilized in newly diagnosed uveal melanoma (UM) patients to assess metastatic potential of the tumor. As most patients are treated with eye-sparing radiotherapy, there is limited tumor tissue available for testing, and technical reliability and success of prognostic testing are critical. This study assessed the analytical performance of the 15-gene expression test for UM and the correlation of molecular class with pathologic characteristics.
Methods:Inter-assay, intra-assay, inter-instrument/operator, and inter-site experiments were conducted, and concordance of the 15-gene expression profile test results and associated discriminant scores for matched tumor samples were evaluated. Technical success was determined from deidentified clinical reports from January 2010 -May 2016. Pathologic characteristics of enucleated tumors were correlated with molecular class results.
Results:Inter-assay concordance on 16 samples run on 3 consecutive days was 100%, and matched discriminant scores were strongly correlated (R2= 0.9944). Inter-assay concordance of 46 samples assayed within a one year period was 100%, with an R2value of 0.9747 for the discriminant scores. Intra-assay concordance of 12 samples run concurrently in duplicates was 100%; discriminant score correlation yielded an R2of 0.9934. Concordance between two sites assessing the same tumors was 100% with an R2of 0.9818 between discriminant scores. Inter-operator/ instrument concordance was 96% for Class 1/2 calls and 90% for Class 1A/1B calls, and the discriminant scores had a correlation R2 of 0.9636. Technical success was 96.3% on 5516 samples tested since 2010. Increased largest basal diameter and thickness were significantly associated with Class 1B and Class 2 vs. Class 1A signatures. Conclusions:These results show that the 15-gene expression profile test for UM has robust, reproducible performance characteristics. The technical success rate during clinical testing remains as high as first reported during validation. As molecular testing becomes more prevalent for supporting precision medicine efforts, high technical success and reliability are key characteristics when testing such limited and precious samples. The performance of the 15-gene expression profile test in this study should provide confidence to physicians who use the test’s molecular classification to inform patient management decisions.
Keywords: Uveal melanoma, Gene expression profiling, Prognosis, Analytic validity
* Correspondence:[email protected]
1Castle Biosciences, Inc., 820 S. Friendswood Drive, Suite 201, Friendswood, TX 77546, USA
Full list of author information is available at the end of the article
Background
Uveal melanoma (UM) is a rare, intraocular cancer that affects approximately 1600 patients per year in the United States [1]. Most patients are treated with eye-sparing radiotherapy, primarily through plaque brachy-therapy or proton beam radiation, while only a small proportion (~10%) will undergo enucleation. Despite the high rate of primary tumor control, ~50% of pa-tients will develop metastatic disease, primarily to the liver, after which prognosis is poor [2]. While the cli-nicopathologic features assessed in AJCC staging, in-cluding tumor size, ciliary body involvement, and extraocular extension, are important factors when assessing metastatic risk, even Stage I-II patients have a 12-30% UM-related mortality rate by 10 years [3, 4]. Because of this, frequent surveillance was generally rec-ommended to monitor all UM patients for disease spread [5, 6].
Gene expression profiles that are associated with low-risk (Class 1A), intermediate-low-risk (Class 1B), or high-risk (Class 2) outcomes have been shown to provide information useful for risk-tailored surveillance plans [7–9]. Because treatment of the primary tumor is highly effective with plaque radiotherapy, enucleation is not common, and the amount of tumor tissue available for molecular prognostic testing is limited. During the de-velopment of the gene expression profiling test for UM prognostication (also known as DecisionDx®-UM), focus was placed on providing patients with a test that was robust and could be run successfully and repro-ducibly on a very small amount of tissue obtained through a fine needle aspirate biopsy (FNAB), as well as formalin-fixed paraffin embedded (FFPE) tissue from enucleations [8–10].
Recommendations for the development of clinically useful molecular biomarkers have suggested that a biomarker test needs to demonstrate clinical validity, utility, and analytic validity, and that supporting data for each must be transparent and readily available for both physicians and patients [11]. Several widely-used genomic tests for different types of cancer have achieved high levels of evidence for each of these cri-teria [12–17]. The clinical validity and clinical utility of the 15-gene expression profile test for UM was re-ported by the Cooperative Ocular Oncology Group (COOG) [9], and the prognostic accuracy of the test has been confirmed in multiple single- and multi-center studies [18–23]. The test’s impact on clinical decision-making for UM patients has also been demon-strated [23, 24]. The focus of this study was to evaluate performance metrics of the test in a CLIA-certified la-boratory setting, describe the rate of technical success on both FNAB and FFPE tissue from enucleations, and report correlations with pathological variables.
Methods
Tissue acquisition and processing
All samples were acquired during routine clinical testing for risk prognostication in UM patients. For FNAB sam-ples, UM tumor aspirates were frozen in RNase-free RNA stabilization buffer by the treating physician imme-diately after biopsy and shipped to the Castle Biosci-ences’ laboratory on dry ice (Fig. 1). All samples were immediately processed with the PicoPure RNA Isolation Kit (Molecular Devices, Sunnyvale, CA). For tumors re-moved through enucleation, five-micron sections from FFPE tissue were used; the first of six sequential sections were stained with hematoxylin and eosin. Tumor tissue containing at least 80% tumor nuclei density was marked and manually dissected from unstained slides using a sterile scalpel and processed for RNA isolation according to the Ambion RecoverAll Total Nucleic Acid Isolation Kit (Life Technologies Corporation, Grand Island, NY). Reverse transcription of RNA into cDNA was performed using the Applied Biosystems High Capacity cDNA Re-verse Transcription Kit (Life Technologies Corporation).
DecisionDx-UM gene expression profiling and molecular classification
Gene expression profiling was performed as previously described [9, 25]. From 2010 through 2014, quantitative PCR was performed on a 7900HT Fast Real-Time PCR System (Thermo Fisher Scientific), after which it was performed on the current system, a QuantStudio 12K Flex Real-Time PCR System (Applied Biosystems). Com-plementary cDNA was pre-amplified with 14 cycles and then diluted 20-fold with Tris-EDTA (TE). Fifty microli-ters of diluted, pre-amplified cDNA was mixed with 50 uL of 2X Taqman Gene Expression Master Mix and loaded in triplicate onto customized microfluidics PCR cards containing the gene-specific primers and probes for the 12 discriminating genes and endogenous control genes (Additional file 1: Table S1).
either a negative discriminant score (Class 1) or posi-tive discriminant score (Class 2). The discriminant score can theoretically range from >0 to positive or negative infinity, however, only the absolute (positive) value of the discriminant score is reported clinically alongside the respective Class result. A discriminant score is considered reduced confidence if it is <0.1. For Class 1 cases, summation of theRAB31andCDH1ΔCt values determined whether the sample was Class 1A or Class 1B based on a mathematical threshold. Class 1B UMs have differentialRAB31/CDH1expression relative to Class 1A tumors.
Technical reliability studies
De-identified DecisionDx-UM test results from January 2010 through May 2016 were analyzed according to tissue type, successful molecular classification, and re-sultant class assignment. Institutional review board sub-mission of the technical reliability study was not required as it constitutes technical data on file only, and contains no patient-specific protected health informa-tion. As such, this analysis is exempt from the regulatory review requirements as set forth in section 46.101 (b) of 45 CFR 46 [26]. Analytic validation experiments were performed on cDNA generated from the RNA extracted from UM tumor specimens. For these experiments, de-identified residual samples were used. Given that the majority of specimens are obtained via FNAB, most tumor samples are exhausted by performing the 15-gene expression profile test and residual samples are limited.
As such, samples used in reproducibility experiments were not consecutive samples, but in each experiment, leftover samples from approximately the same time period were used. Samples were between 1 and 10 weeks old (from date of tissue receipt) and remained frozen after initial processing until reliability experiments.
Results
Inter-assay and intra-assay repeatability
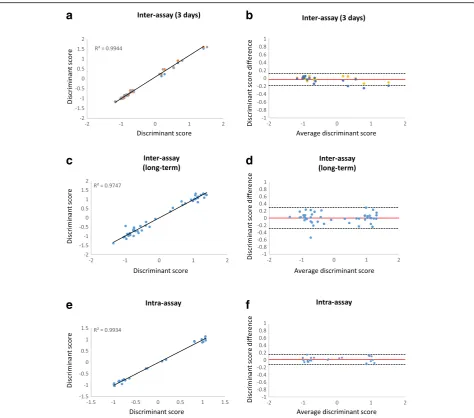
To evaluate the repeatability of gene expression profiling and class assignment agreement on the same sample be-tween separate PCR runs, DecisionDx-UM testing was performed on 16 samples on three consecutive days, resulting in 48 molecular classifications (Table 1). The class assignment concordance for each sample across all three days was 100% (eight Class 1A, three Class 1B, and five Class 2 tumors). Multiple regression analysis of the discriminant scores from the three runs showed an average R2value of 0.9944 (Fig. 2a). The majority of vari-ation in discriminant scores between runs fell within the 95% confidence interval (−0.1809 to 0.1219), with an es-timated bias of−0.0295 (Fig. 2b).
were 100% concordant for all samples (7 Class 1A, 15 Class 1B, and 24 Class 2 tumors). Regression analysis showed an R2 of 0.9747 (Fig. 2c). The estimated bias in discriminant scores was 0.0049 and most variation in dis-criminant scores fell within the 95% confidence interval (−0.2816 to 0.2914) (Fig. 2d).
Intra-assay repeatability was tested by running two replicates of four samples on the same PCR card, and re-peating this experiment on a second card. This was per-formed with three sets of four samples, resulting in 24 paired molecular classifications from 12 tumor speci-mens. Class assignment agreement was 100% for the four samples within each card and between the two cards (Table 1; five Class 1A, two Class 1B and five Class 2 tumors). The R2 value from correlation analysis was 0.9934 (Fig. 2e). As shown on a Bland-Altman plot (Fig. 2f ), all (24/24) of the paired intra-assay discriminant scores had differences that fell within the 95% confi-dence interval (−0.1182 to 0.1472) and the estimated bias was 0.0145.
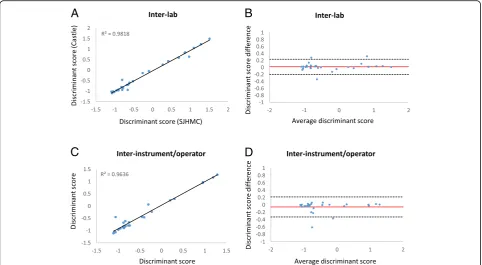
Transfer of the test to a new laboratory location afforded the opportunity to test the inter-assay reliability of the test when performed in different laboratories. Twenty-nine samples were run at our CLIA-certified contract laboratory (St. Joseph’s Hospital and Medical Center, Phoenix AZ) and a new Castle Biosciences, Inc. facility (Table 1). The DecisionDx-UM Class calls were 100% concordant between the two laboratories. The R2 value of the correlation between discriminant scores was 0.9818 (p < 0.001) (Fig. 3a). The estimated bias was 0.0233 and 26/29 (90%) of the discriminant scores had an inter-lab difference that fell within the 95% confi-dence interval (−0.1939 to 0.2405; Fig. 3b).
Twenty-eight samples were run on two instruments by separate operators to analyze inter-instrument and– op-erator reliability (Table 1). Two Class 1 calls were dis-cordant for their 1A versus 1B subclassification. One
discordant sample had a Class 1B result because the RAB31/CDH1 expression fell just under the subclassifi-cation threshold, and its variability fell within the 95% confidence interval forRAB31/CDH1in reliability exper-iments. The remaining discordant case had a difference in RAB31/CDH1 between runs that fell outside of this confidence interval and was thus an outlier. Class 1 vs. Class 2 calls were 96% concordant (27/28). The case that was discordant for Class 1 vs. Class 2 did not have any unique characteristic that could potentially explain the discrepancy and thus seems to represent an outlier. As shown in Fig. 3c, correlation analysis of the discriminant scores between the two instruments generated an R2 value of 0.9636 (p < 0.001). The estimated bias was
−0.0540 (95% CI =−0.3266 to 0.2186) and only 1 sample fell outside of this confidence interval (Fig. 3d).
Technical success of clinical testing
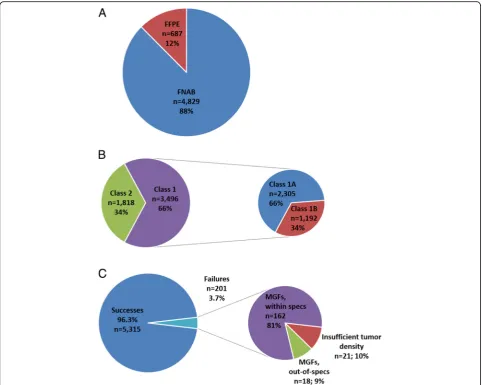
From January 2010 to May 2016, 5516 tumor specimens were tested. Of these, 4829 (88%) were FNABs and 687 (12%) were FFPE, the vast majority of which were 5-μm sections from enucleations and the remaining as FFPE cell blocks (Fig. 4a, Table 2). Gene expression profiling was successful for 96.35% (5315) of these tumors: 2305 (43.4%) were Class 1A, 1192 (22.4%) were Class 1B, and 1818 (34.2%) were Class 2 (Table 2, Fig. 4b-c).
Failure to generate a successful gene expression profile report can be due to i) the failure of multiple control and/or discriminating genes to amplify (multi-gene fail-ure [MGF]), or ii) insufficient tumor cell density (<80%) within a manually dissectable area of FFPE tissue as de-termined by a pathologist, which results in rejection of the tumor sample prior to testing. Overall, 180 (3.3%) of the samples tested resulted in MGFs and 21 (0.4%) sam-ples had insufficient tumor density (Table 2, Fig. 4c). Eighteen of the MGFs (10%) were related to out-of-specification FNAB specimens, meaning the FNABs
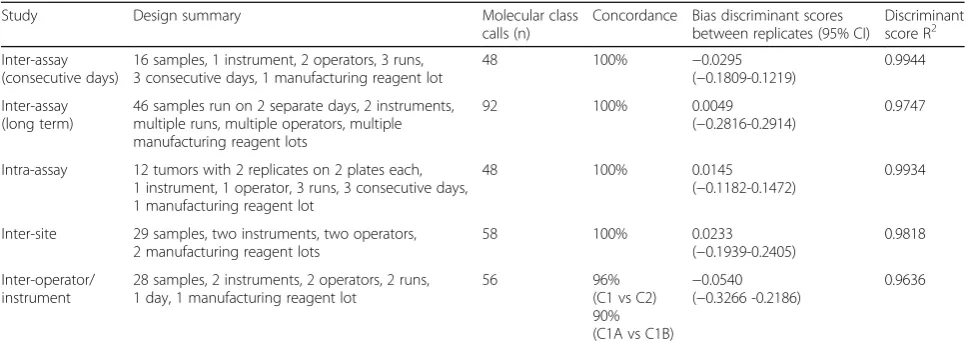
Table 1Summary of results from repeatability and proficiency studies
Study Design summary Molecular class
calls (n)
Concordance Bias discriminant scores between replicates (95% CI)
Discriminant score R2
Inter-assay (consecutive days)
16 samples, 1 instrument, 2 operators, 3 runs, 3 consecutive days, 1 manufacturing reagent lot
48 100% −0.0295
(−0.1809-0.1219)
0.9944
Inter-assay (long term)
46 samples run on 2 separate days, 2 instruments, multiple runs, multiple operators, multiple manufacturing reagent lots
92 100% 0.0049
(−0.2816-0.2914)
0.9747
Intra-assay 12 tumors with 2 replicates on 2 plates each, 1 instrument, 1 operator, 3 runs, 3 consecutive days, 1 manufacturing reagent lot
48 100% 0.0145
(−0.1182-0.1472)
0.9934
Inter-site 29 samples, two instruments, two operators, 2 manufacturing reagent lots
58 100% 0.0233
(−0.1939-0.2405)
0.9818
Inter-operator/ instrument
28 samples, 2 instruments, 2 operators, 2 runs, 1 day, 1 manufacturing reagent lot
56 96%
(C1 vs C2) 90% (C1A vs C1B)
−0.0540 (−0.3266 -0.2186)
were received thawed and/or were not within the accept-able volume range (10-220 uL). Success rates for FNAB and FFPE tissues were similar. Testing was successful for 4678 (97%) out of 4829 FNABs, with only 151 (3%) ex-periencing MGFs (Table 2). Of the 666 FFPE tumors that passed the quality control assessment and went on to gene expression profile testing, 637 (96%) were success-ful and 29 (4%) had MGFs.
To determine if long distance shipment has an effect on the reliability of gene expression profiling we evalu-ated performance on international samples. Since 2010, 218 tumor samples from outside of the United States
have been tested; 202 (93%) were fresh-frozen FNABs from Canada and four other countries outside of North America and the remaining 16 (8%) samples were FFPE tissues that came from Canada and two countries out-side of North America (data not shown). Only two MGFs occurred (both FNAB samples from Canada), resulting in 99% technical success for internationally shipped specimens.
Discriminant scores and confidence intervals
The discriminant score associated with the DecisionDx-UM Class reflects the inverse distance of the patient
a
b
c
d
e
f
sample to the hyperplane. As of May 2016, the discrim-inant scores have ranged from −1.56808 to +1.70482 (Fig. 5). The average discriminant score for Class 1 was
−0.81033 (95% CI =−0.256 to −1.365). The average dis-criminant score for Class 2 was 0.816144 (95% CI = 0.0528 to 1.567). A score between −0.1 to 0.1 is considered of reduced confidence and is reported clinically as such. However, a discriminant score with reduced confidence has not been associated with a dif-ferent outcome than a normal confidence score [25], and the vast majority (~97%) of the discriminant scores reported clinically have been reported within the nor-mal confidence range.
Pathologic characteristics of DecisionDx-UM-tested tumors
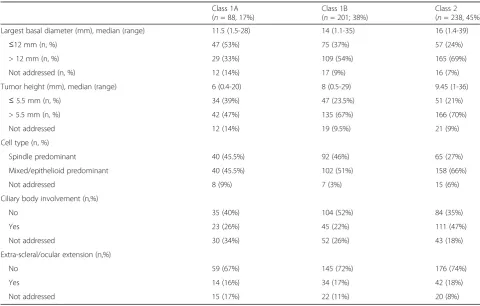
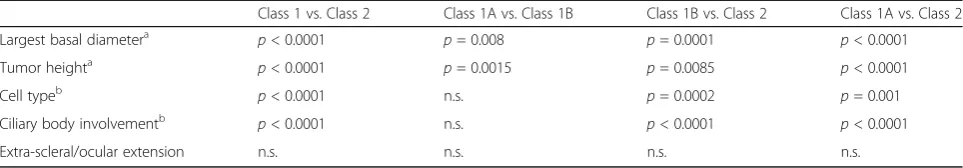
Associated de-identified pathological data was available for 527 FFPE tumors from enucleations tested between January 2010 and May 2016. The pathologic characteris-tics of these tumors are described in Table 3, with statis-tical analysis of correlation with molecular class presented in Table 4. Eighty-eight tumors (17%) were Class 1A, 201 (38%) were Class 1B, and 238 (45%) were Class 2. Class 2 tumors had significantly greater largest basal diameters (LBDs) than Class 1 tumors (p< 0.0001 by Mann-Whitney test). Compared to Class 1A tumors,
Class 1B tumors also had significantly greater LBDs (me-dian of 14 mm vs 11.5 mm,p= 0.008 by Mann-Whitney test). Similarly, Class 2 tumors were significantly thicker than Class 1 tumors (median of 9.45 mm vs 7, p < 0.0001), and within Class 1, Class 1B tumors were significantly thicker than Class 1A tumors (median of 8 mm vs 6 mm, p= 0.001). A Class 1 signature was as-sociated with predominantly spindle cell type, while a Class 2 signature was significantly associated with a mixed or predominantly epithelioid cell type (p< 0.0001 by Fisher’s exact). Class 1A and 1B tumors had similar cell morphologies, while Class 2 tumors were signifi-cantly associated with a mixed/predominantly epithelioid cell type compared to Class 1B tumors (p = 0.0002 by Fisher’s exact). There was no difference in ciliary body involvement between Class 1A and 1B tumors, but Class 2 tumors were more likely to have ciliary body involve-ment than Class 1A and 1B tumors (p< 0.0001 by Fish-er’s exact). There was no significant association with any molecular class and extra-ocular extension.
Discussion
Given the advances in molecular cancer diagnostics in the last decade, recommendations have been estab-lished to guide careful, thorough assessments of these tests [11, 27]. One of the major criteria for a clinically
A
B
C
D
useful, well-validated assay is that the test must demon-strate analytic validity, which includes reliability and re-producibility of the test to measure the intended molecular analytes [11, 27]. In this study, we report on the analytic validity of the 15-gene expression profile test (DecisionDx-UM) as performed in a CLIA-certified clinical laboratory. Reproducibility and reliability were demonstrated through i) inter-assay concordance, ii) inter-assay concordance of samples used for proficiency
testing and instrument verification throughout one year, iii) intra-assay concordance, iv) inter-lab concordance be-tween two CLIA-certified laboratories, and v) inter-instrument/operator concordance. Molecular classifica-tions by DecisionDx-UM were 100% concordant for four of these assessments, with only 3 discordant specimens out of the total 143 samples in the analytic experiments. The reported discriminant scores for the same tumor sample were highly correlated, as reflected by R2
values Fig. 4Clinical experience with DecisionDx-UM testing.aProportions of tissue type received for testing.bProportions of Class 1A, 1B, and 2 results in clinical setting from January 2010-May 2016.cTechnical success of DecisionDx-UM testing and proportions of technical failures due to multi-gene failures, out-of-specification samples, and insufficient tumor density
Table 2Clinical experience of DecisionDx-UM testing
Sample Type Received Successfully reported Multi-gene Failures (MGF) Insufficient tissue
within specs Outside specs
FNAB (n, % of row) 4829 4678 (97%) 133 (2.7%) 18 (0.3%) N/A
FFPE (n,% of row) 687 637 (93%) 29 (4%) N/A 21 (3%)
above 0.96 for the inter-assay, intra-assay, inter-instrument, and inter-lab experiments. Furthermore, the run-to-run, lab-to-lab, instrument-instrument, and intra-run variabilities between discriminant scores were all within acceptable limits that would not impact patient
care. These results demonstrate that the DecisionDx-UM class assignment for the same tumor specimen is consist-ent within the same PCR card and when run on separate days in different PCR cards, even with several weeks in be-tween runs. To our knowledge, this is the only report of Fig. 5Distribution of discriminant scores. The distribution of discriminant scores that have been reported clinically. The output of the SVM algorithm is negative for Class 1, but reported as a positive number. The 50th percentile is represented by theblue boxand theblack barsindicate the 90th percentile. Theblue lineis the median of each group and the red stars indicate the minimum and maximum observed scores of each Class
Table 3Morphologic characteristics and correlation with molecular class result in enucleated cases
Class 1A (n= 88, 17%)
Class 1B (n= 201; 38%)
Class 2 (n= 238, 45%)
Largest basal diameter (mm), median (range) 11.5 (1.5-28) 14 (1.1-35) 16 (1.4-39)
≤12 mm (n, %) 47 (53%) 75 (37%) 57 (24%)
> 12 mm (n, %) 29 (33%) 109 (54%) 165 (69%)
Not addressed (n, %) 12 (14%) 17 (9%) 16 (7%)
Tumor height (mm), median (range) 6 (0.4-20) 8 (0.5-29) 9.45 (1-36)
≤5.5 mm (n, %) 34 (39%) 47 (23.5%) 51 (21%)
> 5.5 mm (n, %) 42 (47%) 135 (67%) 166 (70%)
Not addressed 12 (14%) 19 (9.5%) 21 (9%)
Cell type (n, %)
Spindle predominant 40 (45.5%) 92 (46%) 65 (27%)
Mixed/epithelioid predominant 40 (45.5%) 102 (51%) 158 (66%)
Not addressed 8 (9%) 7 (3%) 15 (6%)
Ciliary body involvement (n,%)
No 35 (40%) 104 (52%) 84 (35%)
Yes 23 (26%) 45 (22%) 111 (47%)
Not addressed 30 (34%) 52 (26%) 43 (18%)
Extra-scleral/ocular extension (n,%)
No 59 (67%) 145 (72%) 176 (74%)
Yes 14 (16%) 34 (17%) 42 (18%)
analytic validity for any prognostic test for UM. Compar-able analytic validation has not yet been reported for fluorescence in situ hybridization (FISH), microsatellite analysis (MSA), single nucleotide polymorphism (SNP) ar-rays, or multiplex-ligation probe amplification (MLPA), all of which can be used to detect monosomy 3 and other chromosomal copy number changes that have been asso-ciated with UM metastasis, or next-generation sequencing to detect mutations and chromosomal aberrations to esti-mate UM prognosis.
Gene expression profiling is one of the clinically sig-nificant variables for disease prognostication recom-mended by the 2017 AJCC staging guidelines [28], and as such, the DecisionDx-UM test is routinely used across the United States and has been clinically available since 2010. The prognostic test was developed after two dis-tinct molecular subtypes of UM were identified and shown to have correlation with outcomes [7, 10, 29, 30]. A 15-gene RT-PCR test was developed to identify these UM molecular subtypes and prospectively validated in multiple studies [8, 9, 20, 21, 23]. As eye-sparing treat-ments are frequently utilized in the contemporary man-agement of UM and enucleations are less common, the standard practice for physicians utilizing DecisionDx-UM is to collect a biopsy prior to or at the time of radio-active plaque or proton beam clip placement. Due to the lack of residual tissue aside from that obtained during biopsy, successful gene expression profiling on a single biopsy is critical. While the technical success of the 15-gene expression profile assay has been previously re-ported as ranging from 95 to 99% [8, 9, 19], many of the samples in those studies were tested in the research laboratory that developed the assay, which was then li-censed by Castle Biosciences, Inc. in 2009. In this report, we demonstrate that 96.4% of 5516 samples that have been clinically tested at Castle Biosciences’ laboratory generated successful molecular classification reports, es-tablishing the consistency of technical success from the test. Of the unsuccessful tests, 39 out of 201 (19%) were due to samples outside of quality control specifications (for FNABs, incorrect volume and/or not frozen,n= 18; for FFPE tissues, insufficient tumor volume, n = 21). Thawed samples and those with insufficient/excessive
volume have been previously reported to be associated with technical failures of gene expression profiling [8]. The technical success rate of DecisionDx-UM testing is substantially higher than what has been previously re-ported for other molecular methods used in UM prog-nostication, including FISH, MSA, and array CGH, which range from 50 to 87% in much smaller sample sets [31–34].
Of the 5315 successful tests reported, 43.4% were Class 1A, 22.4% were Class 1B, and 34.2% were Class 2. Overall, these proportions are similar to class those re-ported in the Cooperative Ocular Oncology Group (COOG) study, which were 47% Class 1A, 13%, Class 1B and 40% Class 2 [9]. Likewise, other single- and multi-center studies that analyzed subsets of the clinically tested patients reported here have shown similar propor-tions of Class 1A, 1B, and 2 results [21, 23, 35].
Of the enucleation specimens tested for which there were associated pathology data, the proportion of Class 1 patients shifted to be predominately Class 1B vs. Class 1A, and the proportion of Class 2 tumors was also in-creased compared to the total clinical population. Given the significantly increased LBDs and thicknesses of enu-cleation specimens (i.e. those that necessitated removal of the globe), an increase in Class 2 and Class 1B tumor classification is not unexpected. Importantly, there were no significant differences between Class 1A and 1B tu-mors in terms of cell morphology, ciliary body involve-ment, or extraocular extension, underscoring the utility of molecular testing to delineate risk in these tumors that otherwise share similar pathologic features. Overall, the pathology and molecular class data in our clinically tested cohort reflect published reports that greater LBD and tumor thickness tend to be clinicopathologic features associated with more aggressive tumors [9, 20, 22, 23], and these riskier phenotypes are most frequently seen in Class 1B or Class 2 tumors. An advantage of gene ex-pression profiling is that it reflects objective, intrinsic tumor biology, whereas measurements of LBD in particu-lar can be subjective due to variation between observers and in techniques used for size measurement [36]. Add-itionally, cytopathologic analysis can be impaired by a high rate of insufficient cellularity from FNABs [19]. Several
Table 4Statistical comparisons between molecular class and tumor pathology in enucleated cases
Class 1 vs. Class 2 Class 1A vs. Class 1B Class 1B vs. Class 2 Class 1A vs. Class 2
Largest basal diametera p< 0.0001 p= 0.008 p= 0.0001 p< 0.0001
Tumor heighta p< 0.0001 p= 0.0015 p= 0.0085 p< 0.0001
Cell typeb p< 0.0001 n.s. p= 0.0002 p= 0.001
Ciliary body involvementb p< 0.0001 n.s. p< 0.0001 p< 0.0001
Extra-scleral/ocular extension n.s. n.s. n.s. n.s.
a
Mann-Whitney test;b
studies have shown that GEP is the most significant independent prognostic factor for metastatic risk when compared to clinicopathologic features, including LBD [9, 18–20, 22, 23, 37].
Conclusions
In summary, the results of these analytic performance data demonstrate the reproducibility and reliability of the DecisionDx-UM test. This is confirmed by the high correlation of discriminant scores and concordance of molecular classifications on samples subjected to repeat testing. The robust high technical success rate of the test on even small amounts of tissue obtained by FNAB has been maintained from the test’s original development through clinical implementation and testing of more than 5000 patients, and represents an important aspect of testing, given that patients who receive eye-sparing radiotherapy, usually do not have the opportunity to be biopsied again after treatment.
Additional file
Additional file 1: Table S1.12 Discriminating genes in DecisionDx-UM. (DOCX 16 kb)
Abbreviations
COOG:Collaborative Ocular Oncology Group; FFPE: Formalin-fixed, paraffin-embedded; FISH: Fluorescence in situ hybridization; FNAB: Fine needle aspirate biopsy; LBD: Largest basal diameter; MGF: Multi-gene failure; MLPA: Multiplex ligation probe amplification; MSA: Microsatellite analysis; UM: Uveal melanoma
Acknowledgements Not applicable.
Funding
This study was sponsored by Castle Biosciences, Inc.
Availability of data and materials
The datasets generated and/or analyzed during the current study are not publicly available due the proprietary nature of the 15-gene expression pro-file test.
Authors’contributions
KMP, JW, KO, TP, JS, and FM generated the data. KMP, JW, JS, and FM analyzed the data. KMP, RC, and FM wrote the manuscript. All authors reviewed and approved the final manuscript.
Ethics approval and consent to participate
Institutional review board submission of the technical reliability study was not required as it constitutes technical data on file only, and contains no patient-specific protected health information (PHI). All pathology reports were de-identified of PHI. As such, this analysis is exempt from the regulatory review requirements as set forth in section 46.101 (b) of 45 CFR 46 [26].
Consent for publication Not applicable.
Competing interests
All authors are employees and option holders at Castle Biosciences, Inc.
Publisher’s Note
Springer Nature remains neutral with regard to jurisdictional claims in published maps and institutional affiliations.
Author details
1Castle Biosciences, Inc., 820 S. Friendswood Drive, Suite 201, Friendswood, TX 77546, USA.2Castle Biosciences Laboratory, 3737 N. 7th St, Suite 160, Phoenix, AZ 85014, USA.
Received: 18 April 2017 Accepted: 24 July 2017
References
1. Singh AD, Topham A. Incidence of uveal melanoma in the United States: 1973-1997. Ophthalmology. 2003;110(5):956–61.
2. Collaborative Ocular Melanoma Study Group. The COMS randomized trial of iodine 125 brachytherapy for choroidal melanoma: V. Twelve-year mortality rates and prognostic factors: COMS report no. 28. Arch Ophthalmol. 2006; 124(12):1684–93.
3. Kivela T, Kujala E. Prognostication in eye cancer: the latest tumor, node, metastasis classification and beyond. Eye (Lond). 2013;27(2):243–52. 4. Kujala E, et al. Staging of ciliary body and choroidal melanomas based on
anatomic extent. J Clin Oncol. 2013;31(22):2825–31.
5. Diener-West M, et al. Screening for metastasis from choroidal melanoma: the collaborative ocular melanoma study group report 23. J Clin Oncol. 2004;22(12):2438–44.
6. Eskelin S, et al. Tumor doubling times in metastatic malignant melanoma of the uvea: tumor progression before and after treatment. Ophthalmology. 2000;107(8):1443–9.
7. Onken MD, et al. Gene expression profiling in uveal melanoma reveals two molecular classes and predicts metastatic death. Cancer Res. 2004;64(20):7205–9.
8. Onken MD, et al. An accurate, clinically feasible multi-gene expression assay for predicting metastasis in uveal melanoma. J Mol Diagn. 2010;12(4):461–8. 9. Onken MD, et al. Collaborative ocular oncology group report number 1:
prospective validation of a multi-gene prognostic assay in uveal melanoma. Ophthalmology. 2012;119(8):1596–603.
10. Onken MD, et al. Prognostic testing in uveal melanoma by transcriptomic profiling of fine needle biopsy specimens. J Mol Diagn. 2006;8(5):567–73. 11. Febbo PG, et al. NCCN task force report: evaluating the clinical utility of
tumor markers in oncology. J Natl Compr Cancer Netw. 2011;9(Suppl 5):S1– 32. quiz S33
12. Walsh PS, et al. Analytical performance verification of a molecular diagnostic for cytology-indeterminate thyroid nodules. J Clin Endocrinol Metab. 2012; 97(12):E2297–306.
13. Hu Z, et al. Analytical performance of a bronchial genomic classifier. BMC Cancer. 2016;16:161.
14. Vachani A, et al. Clinical utility of a bronchial genomic classifier in patients with suspected lung cancer. Chest. 2016;150(1):210–8.
15. Silvestri GA, et al. A bronchial genomic classifier for the diagnostic evaluation of lung cancer. N Engl J Med. 2015;373(3):243–51.
16. Duick DS, et al. The impact of benign gene expression classifier test results on the endocrinologist-patient decision to operate on patients with thyroid nodules with indeterminate fine-needle aspiration cytopathology. Thyroid. 2012;22(10):996–1001.
17. Alexander EK, et al. Preoperative diagnosis of benign thyroid nodules with indeterminate cytology. N Engl J Med. 2012;367(8):705–15.
18. Chappell MC, et al. Uveal melanoma: molecular pattern, clinical features, and radiation response. Am J Ophthalmol. 2012;154(2):227–32. e2 19. Correa ZM, Augsburger JJ. Sufficiency of FNAB aspirates of posterior uveal
melanoma for cytologic versus GEP classification in 159 patients, and relative prognostic significance of these classifications. Graefes Arch Clin Exp Ophthalmol. 2014;252(1):131–5.
20. Correa ZM, Augsburger JJ. Independent prognostic significance of gene expression profile class and largest basal diameter of posterior Uveal melanomas. Am J Ophthalmol. 2016;162:20–7. e1
22. Walter SD, et al. Prognostic implications of tumor diameter in association with gene expression profile for Uveal melanoma. JAMA Ophthalmol. 2016; 134(7):734–40.
23. Plasseraud KM, et al. Clinical performance and management outcomes with the DecisionDx-UM gene expression profile test in a prospective multicenter study. Journal of Oncology. 2016;2016:1–9.
24. Aaberg TM Jr, et al. Current clinical practice: differential management of uveal melanoma in the era of molecular tumor analyses. Clin Ophthalmol. 2014;8:2449–60.
25. Harbour JW. A prognostic test to predict the risk of metastasis in uveal melanoma based on a 15-gene expression profile. Methods Mol Biol. 2014; 1102:427–40.
26. Office for Human Research Protections. 45 Code of Federal Regulations Part 46 (45 CFR 6). Department of Health and Human Services; 2009.
27. Simon RM, Paik S, Hayes DF. Use of archived specimens in evaluation of prognostic and predictive biomarkers. J Natl Cancer Inst. 2009;101(21):1446–52. 28. Kivela, T., et al., Uveal Melanoma, in American Joint Committee on Cancer
(AJCC) Staging Manual, M.B. Amin, Edge, M.B., Greene, F.L., Byrd, D.R., Brookland, R.K., Washington, M.K., Gershenwald, J.E., Compton, C.C., Hess, K.R., Sullivan, D.C., Jessup, J.M., Brierley, J.D., Gaspar, L.E., Schilsky, R.L., Balch, C.M., Winchester, D.P., Asare, E.A., Madera, M., Gress, D.M., Meyer, L.R., Editor. 2017, Spring. 29. Onken MD, et al. Loss of heterozygosity of chromosome 3 detected with
single nucleotide polymorphisms is superior to monosomy 3 for predicting metastasis in uveal melanoma. Clin Cancer Res. 2007;13(10):2923–7. 30. Worley LA, et al. Transcriptomic versus chromosomal prognostic markers and
clinical outcome in uveal melanoma. Clin Cancer Res. 2007;13(5):1466–71. 31. Midena E, et al. In vivo detection of monosomy 3 in eyes with
medium-sized uveal melanoma using transscleral fine needle aspiration biopsy. Eur J Ophthalmol. 2006;16(3):422–5.
32. Young TA, et al. Fluorescent in situ hybridization for monosomy 3 via 30-gauge fine-needle aspiration biopsy of choroidal melanoma in vivo. Ophthalmology. 2007;114(1):142–6.
33. Shields CL, et al. Chromosome 3 analysis of uveal melanoma using fine-needle aspiration biopsy at the time of plaque radiotherapy in 140 consecutive cases. Trans Am Ophthalmol Soc. 2007;105:43–52. discussion 52-3
34. Desjardins L, et al. FNA biopsies for genomic analysis and adjuvant therapy for uveal melanoma. Acta Ophthalmol. 2010;88:0.
35. Schefler A, et al. Ocular Oncology Study Consortium (OOSC) Report No. 2: Effect of Clinical and Pathologic Variables on Biopsy Complication Rates. San Francisco: American Association of Retina Specialists; 2016.
36. Augsburger JJ, et al. Accuracy of clinical estimates of tumor dimensions. A clinical-pathologic correlation study of posterior uveal melanomas. Retina. 1985;5(1):26–9.
37. Decatur CL, et al. Driver mutations in Uveal melanoma: associations with gene expression profile and patient outcomes. JAMA Ophthalmol. 2016; 134(7):728–33.
• We accept pre-submission inquiries
• Our selector tool helps you to find the most relevant journal
• We provide round the clock customer support
• Convenient online submission
• Thorough peer review
• Inclusion in PubMed and all major indexing services
• Maximum visibility for your research
Submit your manuscript at www.biomedcentral.com/submit