Open Access
Software
Internet Image Viewer (iiV)
Joel T Lee*
1, Kristin R Munch
1, John V Carlis
2and José V Pardo
1Address: 1Cognitive Neuroimaging Unit, VA Medical Center, Minneapolis, MN 55417, USA and 2Computer Science Department, University of Minnesota, Minneapolis, MN 55455, USA
Email: Joel T Lee* - [email protected]; Kristin R Munch - [email protected]; John V Carlis - [email protected]; José V Pardo - [email protected]
* Corresponding author
Abstract
Background: Visualizing 3-dimensional (3-D) datasets is an important part of modern neuroimaging research. Many tools address this problem; however, they often fail to address specific needs and flexibility, such as the ability to work with different data formats, to control how and what data are displayed, to interact with values, and to undo mistakes.
Results: iiV, an interactive software program for displaying 3-D brain images, is described. This tool was programmed to solve basic problems in 3-D data visualization. It is written in Java so it is extensible, is platform independent, and can display images within web pages.
iiV displays 3-D images as 2-dimensional (2-D) slices with each slice being an independent object with independent features such as location, zoom, colors, labels, etc. Feature manipulation becomes easier by having a full set of editing capabilities including the following: undo or redo changes; drag, copy, delete and paste objects; and save objects with their features to a file for future editing. It can read multiple standard positron emission tomography (PET) and magnetic resonance imaging (MRI) file formats like ECAT, ECAT7, ANALYZE, NIfTI-1 and DICOM. We present sample applications to illustrate some of the features and capabilities.
Conclusion: iiV is an image display tool with many useful features. It is highly extensible, platform independent, and web-compatible. This report summarizes its features and applications, while illustrating iiV's usefulness to the biomedical imaging community.
Background
A basic problem in brain research concerns data visualiza-tion. The data stored, in a 3- or 4- dimensional (three spa-tial dimensions and time) image array, become difficult to visualize with standard data graphing or 2-D image dis-play tools. Yet, viewing these data becomes essential for increased understanding, to grasp noise properties, to spot artifacts, and to see relationships in the data that algorithms cannot automatically detect. These issues are
not only important for the people performing the research, but also for sharing data and insight with others.
Many tools exist to help in visualizing and presenting data. They range from purely 2-D image displays with no image processing capability to 3-D image displays with special tools for extracting features, statistics, etc. They can be divided into 2-D image manipulation tools, data processing tools, and tools specific to brain imaging. For example, image manipulation tools like Adobe®
Pho-Published: 29 May 2008
BMC Medical Imaging 2008, 8:10 doi:10.1186/1471-2342-8-10
Received: 28 September 2007 Accepted: 29 May 2008
This article is available from: http://www.biomedcentral.com/1471-2342/8/10
© 2008 Lee et al; licensee BioMed Central Ltd.
toshop® excel at 2-D pictures and video but do not deal
with 3-D data or brain imaging formats. Data processing tools such as MATLAB™, IDL® and the Visualization
Toolkit (VTK) [1] have multiple functions for processing and display but require writing programs or scripts for reading, processing, and displaying brain images.
Tools specific to brain imaging include ANALYZE™ [2], SPM [3], AIR [4], MRIcro [5], Brainvox [6], Brain Voyager [7], Stimulate [8], ImageJ [9], Insight Segmentation and Registration Toolkit (ITK) [10], and several others. These tools support, to differing extents, brain imaging data for-mats, data analysis, and/or display. These programs were primarily designed around a specific processing problem and have display capabilities orientated towards that sin-gle problem, often displaying only one data view at a time. ANALYZE and SPM are major packages with multi-ple processing capabilities but still have display options that are cumbersome and/or inflexible. The display options within these packages do not offer user-friendly features such as rearranging display objects by dragging or undoing accidental changes.
Another notable toolkit is the Medical Imaging Interac-tion Toolkit (MITK) [11]. This toolkit combines VTK and ITK and adds features that make it easier to interact with these toolkits including multiple consistent views of the same data, interactions and undo/redo. MITK requires writing and compiling programs for specific applications.
Two other Java based image kits include NeatVision [12] and BIL-kit [13]. NeatVision is a medical imaging analysis and software development environment emphasizing computer-aided diagnostics (CAD). The Medical Imaging and Visualization Toolkit (BIL-kit) includes a large range of capabilities from image segmentation to geometric model generation and 3D visualization. Like most toolkits both these require assembling tools to produce specific applications or results. Our simple display appli-cation emphasizes visualization and comparison of proc-essed results and does not incorporate extensive processing. Future additions to iiV might look at utilizing features or results from one or both of these toolkits.
Modern brain imaging techniques like positron emission tomography (PET) and magnetic resonance imaging (MRI) generate 3-D arrays of voxels (volume pixels). Voxel values generated by these techniques correspond to measures like radiation decay counts, field intensities, z-values, etc.; these values do not represent visual colors. The third dimension is not easily represented on a flat dis-play screen. Standard 2-D viewers are not sufficient to view these data. The data require techniques to map voxel values to colors, to convert 3-D data into 2-D views, and to discern the areas of the brain under observation relative
either to an individual brain or to a standardized brain space.
To visualize counts, field intensities, z-values, etc., these parameters get mapped to a color table where the inten-sity and/or hue of the colors represent the magnitudes. Visualizing 3-D arrays involves various techniques: dis-playing sequences of 2-D image slices (one for each of the indices of the 3rd dimension); displaying orthogonal slices; and generating 3-D perspective views.
Data such as MRI scans include enough high resolution anatomical information that brain areas and structures become discernible by experienced viewers. Functional techniques such as PET and functional MRI (fMRI) pro-duce images with relatively little anatomical information and often have to be registered to structural MRI data to reference the underlying anatomy. The functional data may be displayed side-by-side with the anatomical MRI or overlaid on top of the MRI. When overlaying, the non-sig-nificant portions of the functional data can be omitted (completely transparent), so that portions of the underly-ing structural MRI can be seen. Alternatively, the func-tional data can have slight transparency. Or, the functional data can provide color hues while the MRI pro-vides grey level intensities.
Data from all brain imaging methods often get mapped to a standard space to allow comparison across subjects, studies, and sites. Many standard spaces exist as well as multiple methods for registering to standard spaces. The two most common brain spaces are the Talairach space [14] and the MNI space [15,16]. Registration techniques are found in programs such as SPM, AIR, Automated PET Activation Analysis Package [17-20] and Neurostat [21]. Techniques range from simple linear scaling to complex nonlinear warping.
An important part of data display is user interaction. Allowing the user to interactively modify features of dis-played data can help them grasp properties of the data to a greater extent than when viewing static displays. Even interactive editing features like undo/redo can allow a user to flip back and forth between changes, assisting in the identification of noteworthy differences.
A last background note indicates the variety of brain imag-ing data formats and the problem of readimag-ing these for-mats. Every camera and software tool seems to produce a different file format. Some common PET formats include Siemens/CTI ECAT 6 and 7, ANALYZE, NIfTI [22], and DICOM®. Most cameras are adopting the DICOM
Although data storage is getting cheaper, it is helpful if a tool supports a given format so that converted files do not have to be created, tracked and stored outside of the tool.
A relatively new format is NIfTI. NIfTI extends the ANA-LYZE 7.5 format incorporating increased flexibility, and storage of transform parameters to map voxel locations to standardized space. NIfTI specifies that compliant tools incorporate this mapping to indicate correct orientations. When iiV reads NIfTI formatted files it automatically dis-plays the data with the most complete transform mapping available in the header.
As noted above, many existing tools address the visualiza-tion problem but do not have the needed flexibility for all research groups, which leads many researchers to develop their own display tools. This paper introduces a new tool called iiV (internet image Viewer), developed by the Cog-nitive Neuroimaging Unit, as our own display tool. Like other tools, it does not address all problems, but we feel it has reached a high enough level of utility to be useful to other groups. In the following sections we describe iiV's implementation, discuss its major features, show exam-ples of various uses, as well as present future directions.
Implementation
The following outlines some of iiV's details concerning the software design and implementation.
A. Programming environment
iiV is written in Java 1.1 and utilizes Swing, BeanShell 2.0b and ACME Lab GIF Encoder packages. iiV makes strong use of Java's object oriented paradigm, multi-threading, and object reflection. iiV's display area and user interface build directly upon Swing's component ori-ented, single-threaded programming model, and model-view-controller (MVC) graphical user interface (GUI) framework. BeanShell provides iiV with a scripting envi-ronment that emulates the Java language syntax. iiV uti-lizes this scripting for initialization, for saving displayed information, for creation of animated presentations, and for cut and paste abilities. ACME Lab tools are used for GIF image encoding of the display area.
1) Java
Object oriented programming becomes incorporated with Java's structure of classes that define contracts with other code in the form of methods. Object oriented program-ming separates the notion of what is to be done, defined by the semantics of class (object) methods, from how it is done, which is defined by the method's code. This separa-tion of "what" and "how" helps break up programming tasks into units that are easier to manage and debug. Object oriented programming enables overloading, allowing different methods to have the same name but
different semantics to perform similar tasks; inheritance, allowing classes to extend the utility of previously defined classes; and interfaces, defining methods but not code (classes implementing the interface must provide the code).
Multithreading allows two or more sections of the same program to run simultaneously. Unlike separate pro-grams, the threads share memory and resources. Java and the underlying operating system handle the distribution of CPU time to the different threads much like to different programs. Multithreading allows time consuming tasks like file input/output (I/O) to run simultaneously with tasks like GUI interaction that need to be responsive. Nei-ther of these types of tasks tends to be CPU intensive, but if the GUI had to wait for I/O, the user might have to wait as well. Also, other tasks can be performed while waiting. Processing some tasks like I/O in another thread also gives the possibility of interrupting that thread if it takes too long.
Since multiple threads of the same program share resources, there needs to be a mechanism to prevent one thread from accessing a resource while it is invalid or not ready because another thread is modifying it. Java pro-vides an object based synchronization lock that only one thread can grab at a time. Other threads requesting the lock freeze until the prior thread releases the lock. Syn-chronization locking can lead to deadlocks with two threads waiting on each other to release separate locks. Synchronization deadlocks can be intermittent and hard to debug. iiV avoids synchronization problems by only using synchronization around local code with limited branching, e.g., synchronizing only around local private functions or simple functions (like system math calls) that should not involve further synchronization.
The Java Reflection application programmer's interface (API) gives the programmer tools to create instances of, and call methods for, classes at run time without knowl-edge of the class at the compile time. iiV uses reflection to add dialogs, new display components types, and file types. This allows users to plug in new dialogs and file types at run time. It also allows iiV to run without loading unnecessary dialogs and file types – that can save time when running across the Internet within a web browser.
2) Swing
dis-play are subclasses of java.awt.Component. Most are sub-classes of iiv.display.DisplayComponent, as seen in Fig. 1, which shows part of its API documentation. The iiv.dis-play.DisplayComponent class implements most of the interfaces iiV uses for controlling displayed object features like Croppable, Flippable, and Zoomable. The iiV.dis-play.SingleImg class, shown in Fig. 2, is the primary class for displaying single slices from 4-D data files. It imple-ments some additional interfaces such as CoordinateMa-ppable, Overlayable, and ScaleInterface. Display
component features are also accessed via the Java reflec-tion package as highlighted in the code sample in Fig. 3.
GUI interaction requires a lot of synchronization. An early version of iiV utilized the Java's Abstract Windowing Toolkit (AWT) directly and was prone to synchronization deadlocks. With the introduction of Java's Swing compo-nents, the probability of deadlocks was reduced by per-forming all GUI updates within a single Swing event thread. A section of code that needs to interact with the
iiv.display. DisplayComponent class structure from iiV API documentation
Figure 1
iiv.display. DisplayComponent class structure from iiV API documentation.
iiv.display
Class DisplayComponent
java.lang.Object
java.awt.Component
java.awt.Container
javax.swing.JComponent
iiv.display.DisplayComponent
All Implemented Interfaces:
CNUFileObject
,
Croppable
,
FilterSampling
,
Flippable
,
ImageObserver
,
LocationMapping
,
MenuContainer
,
Rotatable
,
Serializable
,
ShowPointImage
,
ShowStatus
,
Zoomable
Direct Known Subclasses:
CNUStdImgFile
,
DisplayColorMap
,
DisplayColorMapQuilt
,
DisplayDraw
,
ScriptableDisplayComponent
,
SingleImg
public abstract class
DisplayComponent
extends
JComponent
implements
ShowStatus
,
CNUFileObject
,
Zoomable
,
Rotatable
,
FilterSampling
,
Flippable
,
Croppable
,
LocationMapping
,
ShowPointImage
DisplayComponent defines standard routines specific to a components displayed by iiV.
Since:
iiV1.0
See Also:
GUI inserts code as a runnable object in the queue for the Swing event thread. The Swing event thread executes objects from this queue one after another. iiV is careful not insert code into the queue that would consume a lot of processing time or introduce new synchronization locks.
In the framework of the model-view-controller, the model represents data; the view renders the data as a user inter-face element; and the controller responds to events that produce updates to the model and/or view. In iiV this framework defines a single model with associated action/ event(s) which can associate with multiple GUI
compo-nents displayed in different menus and/or containers. iiV also extends this framework to track mouse events over an image and displays data values, crosshairs, and updated displays of brain slices showing related data.
3) BeanShell
iiV utilizes BeanShell for scripting. BeanShell allows a script to have full access to the power of java. Since scripts are basic text files, they can be edited with any text editor. Scripts are used in the following ways in iiV:
• Scripts are used for saving iiV settings to bring iiV up in the same mode later.
iiv.display. SingleImg class structure from iiV API documentation
Figure 2
iiv.display. SingleImg class structure from iiV API documentation.
Overview Package Class Tree Deprecated Index Help
PREV CLASS NEXT CLASS FRAMES NO FRAMES All Classes
SUMMARY: NESTED | FIELD | CONSTR | METHOD DETAIL: FIELD | CONSTR | METHOD
iiV117
iiv.display
Class SingleImg
java.lang.Object
java.awt.Component
java.awt.Container
javax.swing.JComponent
iiv.display.DisplayComponent
iiv.display.SingleImg
All Implemented Interfaces:
CNUFileObject,CoordinateMappable,Croppable,FilterSampling,Flippable,iiVScriptable,ImageObserver,
LocationMapping,MenuContainer,NumberFormattable,Overlayable,Rotatable,ScaleInterface,Serializable,
ShowPointImage,ShowStatus,SliceNumbering,Zoomable
public class SingleImg
extends DisplayComponent
implements ScaleInterface,CoordinateMappable,SliceNumbering,CNUFileObject,Overlayable,NumberFormattable,
iiVScriptable
Component to display a single slice of CNUData as an image with flip, zoom and show point abilities.
Since:
iiV1.0
See Also:
• Scripts are used for saving what is displayed so it can be redisplayed later.
• Scripts can be used for automating display sequences such as showing slices sequentially.
• Cut and paste utilizes scripting. This avoids problems with serialization, maintains information in human read-able form, and allows pasting into other copies of iiV as well as text editors.
4) ACME Labs GIF encoder
This is a java tool used to encode the display as a GIF for-matted image file.
B. iiV structure
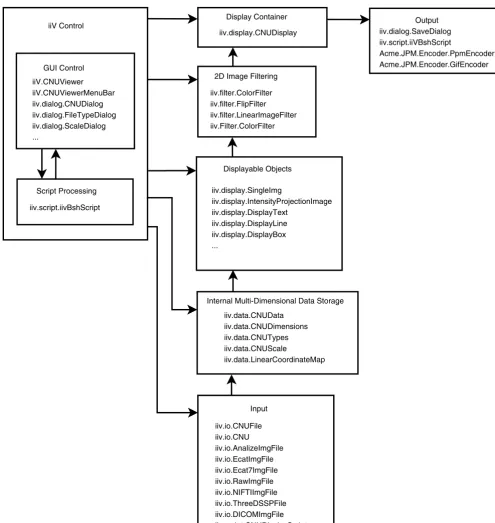
iiV is divided into 9 different packages, the top level iiv package and 8 sub-packages: iiv.display, iiv.data, iiv.dia-log, iiv.io, iiv.gui, iiv.filter, iiv.script, and iiv.util. A short overview of each package and how they interact is listed below. Fig. 4 shows the basic architecture emphasizing
Sample code demonstrating how java reflection is used to get a components feature
Figure 3
Sample code demonstrating how java reflection is used to get a components feature.
/**
* Gets the text from a single component.
*
* @param comp component to get text from
* @return
text from components getText or <code>null</code>
*/
public String getText(Component comp) {
if(comp == null) return null;
try {
Method method = comp.getClass().getMethod("getText", new Class[0]);
return (String) method.invoke(comp, new Object[0]);
} catch (NoSuchMethodException nsme) { // ignore
} catch (SecurityException se) { // ignore
} catch (IllegalAccessException iae) { // ignore
} catch (IllegalArgumentException iarge) { // ignore
} catch (InvocationTargetException ite) { // ignore
} catch (ClassCastException cce) { // ignore
}
how data flows from files to display, and the primary Java classes involved. The total API is available on line [23]. It includes a complete list of all classes and interfaces for
each package as well as their inheritance structure and summaries of their public fields, constructors, and meth-ods.
This basic iiV architecture diagram shows the control and flow of data from input files to display and saving
Figure 4
This basic iiV architecture diagram shows the control and flow of data from input files to display and saving.
Each block lists some of the primary Java classes involved.
iiV.CNUViewer iiV.CNUViewerMenuBar iiv.dialog.CNUDialog iiv.dialog.FileTypeDialog iiv.dialog.ScaleDialog ...
GUI Control
Display Container
iiv.display.CNUDisplay
Displayable Objects
iiv.display.SingleImg
iiv.display.IntensityProjectionImage iiv.display.DisplayText
iiv.display.DisplayLine iiv.display.DisplayBox ...
Internal Multi-Dimensional Data Storage
iiv.data.CNUData iiv.data.CNUDimensions iiv.data.CNUTypes iiv.data.CNUScale
iiv.data.LinearCoordinateMap Script Processing
iiv.script.iivBshScript
Input
iiv.io.CNUFile iiv.io.CNU
iiv.io.AnalizeImgFile iiv.io.EcatImgFile iiv.io.Ecat7ImgFile iiv.io.RawImgFile iiv.io.NIFTIImgFile iiv.io.ThreeDSSPFile iiv.io.DICOMImgFile iiv.script.CNUDisplayScript iiV Control
2D Image Filtering
iiv.filter.ColorFilter iiv.filter.FlipFilter iiv.filter.LinearImageFilter iiv.Filter.ColorFilter
Output iiv.dialog.SaveDialog iiv.script.iiVBshScript
1. The top level package iiv contains the main class CNU-Viewer that extends the java.awt.Applet. Extending the Applet class allows iiV to run inside a web browser. CNU-Viewer controls setup, default settings, reading and dis-playing data, access to display features, and access to other GUI's in the iiv.dialog package. The iiv package also includes two other classes, CNUViewerActions and CNU-ViewerMenubar, that define gui access to main features of the CNUViewer and iiv.display.CNUDisplay classes.
2. The iiv.display package contains the main display con-tainer class, displayable classes, and feature control inter-faces. The class CNUDisplay is the main controller and container for displaying objects. The primary displayable object is the SingleImg class which displays slices from iiv.data.CNUData objects. Properties from current display settings and the data itself determine default display prop-erties of the slices. These propprop-erties can be modified by display area GUI interaction as well as dialog windows and scripts. Most changes to the display area and objects go through special display functions to track changes and allow for undo/redo via the iiv.util.UndoRedo class.
3. The iiv.data package includes classes for storing, scaling, and coordinate mapping of data. These classes help with storing and accessing data including access to multi-dimensional arrays of different data types, conversions between data types, scaling of data, and mapping coordi-nates. The CNUData class falls under this package and is the main class for storing data displayed by the iiv.dis-play.SingleImg class.
4. The iiv.dialog package has dialog classes that define windows for controlling and interacting with displayed items. They talk through the main controller (iiv.CNU-Viewer), display area (iiv.display.CNUDisplay) and dis-played objects API to control how and what is disdis-played.
5. The iiv.io package contains file access classes including the different file type interpreters. Most of these classes extend iiv.data.CNUData class which is displayable by the iiv.display.SingleImg class or the iiv.display.IntensityPro-jectionImage class.
6. The iiv.gui package defines some GUI components that extend some of the standard Swing components. The class CNURowLayoutManager is in this package and is used by the main display container, iiv.display.CNUDisplay, to organize displayed objects in rows.
7. The iiv.filter package defines filter classes used to zoom, rotate, crop, etc. images. Most of these get inserted between raw 2-D data and the actual displayed image inside the iiv.display.SingleImg class.
8. The iiv.script package defines classes for dealing with scripts. The class iiVBshScript falls in this package and is the main class for running Bean Shell scripts.
9. The iiv.util package contains some general utility classes including the UndoRedo class for undo/redo capabilities.
C. Undo/redo
To allow undo/redo, iiV has an undo/redo controller class, iiv.util.UndoRedo, that modifiers of displayed objects register commands with – one command to undo and one to redo each modification. These are stored as iiv.util.DoCommands objects that store objects, methods, and method arguments. Because of the stored object and argument objects, undo/redo history becomes searchable for file objects, which reduces the need to read files multi-ple times.
D. Speed and memory considerations
Memory and speed have not been major concerns of iiV's design and methodology. Speed is not a major concern because iiV is mostly GUI, and today's processors handle this easily. Memory is more of a problem because 3-D image files can be large, and undo/redo can maintain a large history of unused objects in memory.
The Java Virtual Machine (JVM), when invoked, specifies maximum memory allocations. With today's computers, the JVM can be invoked with large amounts of memory. Java has a good garbage collector that removes objects when they are no longer referenced.
iiV loads file data completely into memory and maintains it there as long as it is referenced by any object enabling fast access to the original data. This includes objects refer-enced by undo/redo history that may no longer be dis-played. To reduce waste, iiV searches existing objects before loading new files and allows clearing and/or turn-ing off undo/redo history.
When run as an applet, load times across the web become the major concern. Load times involve both the size of iiV jar files (iiV executable code) and data files. To help with this, iiV, as noted above, can run without all its dialogs and file types. Also, data files can be compressed with GNU zip (gzip).
E. Neuroimaging data display
to the other (left to right, front to back, or top to bottom) can be displayed. To be more concise, but with reduced information, three orthogonal slices may be displayed. The underlying goal is to provide the right combination of slices with proper orientations to help visualize positions of, and relationships between, areas of interest. This is why iiV supports a very flexible display area with image objects that can be positioned anywhere, including over-lapping slices or other objects.
To relate functional data to anatomical data, the anatomy can be displayed as slice objects next to or behind related functional slices. When the anatomical data are located in the background, parts of the functional data may be set to be transparent – usually where voxels have small or insig-nificant values. This overlapping requires the functional and anatomical data sets be co-registered. Keeping the anatomical and functional data as separate objects allows independent modification of colors, contrast, thresholds, etc. iiV allows grouping to lock related objects together.
A second viewing technique available in iiV is intensity projections. This technique produces a seemingly trans-parent or x-ray view of the whole brain as a single 2-D view. Each voxel in the 2-D view shows the maximum (or minimum) intensity voxel selected from all voxels along a line parallel to a major axis. Intensity projections may be done parallel to any of the 3 major axes.
A third viewing technique is available for 3-D stereotactic surface projections (3D-SSP) data. This is data generated outside of iiV utilizing the NEUROSTAT [21] software package. The data is stored as a list of indices and voxel values for data projected to the surface of a brain. iiV reads and keeps track of these indices while displaying 8 surface views of the voxel values – left hemisphere, right hemi-sphere, anterior, posterior, superior, inferior, left medial hemisphere and right medial hemisphere. The 3D-SSP data is already in a standardized space, and iiV includes a spatial mapping to track Talairach coordinates for all loca-tions on the surface views.
iiV does not include the ability to generate its own 3-D perspective views (beyond intensity projections) or to per-form the actual registration of data to standard spaces. These problems depend greatly on the particular data type and often become computationally intensive, so they are best left to specialized tools. iiV can display 3-D perspec-tive views generated by other software, and can also dis-play coordinates in standard space when given linear mapping constants (or for a more complex mapping, given a java object that implements iiV's coordinate map-ping interface).
Results and discussion
To address limitations of existing tools, our laboratory developed its own internal visualization tool, iiV (internet image Viewer). We were able within iiV to address many of the problems noted in the background section above, including the ability to control the types of data for dis-play, to control how data are displayed, and to add many interactive capabilities to the display itself. In particular, iiV deals with data voxels to color representation, slice viewing, overlaying, mapping locations to standard space, and visualizing any number of slices simultaneously from various perspectives. The types of data we can display have grown as we have encountered new formats from different machines and collaborators. Our basic application pro-grammer's interface (API) allows easy addition of new for-mats.
iiV is a full-featured tool for displaying brain imaging data. The primary display objects are 2-D slices con-structed after reading a 3-D data file. Fig. 5 shows trans-verse slices of an MRI displayed within iiV with all the default settings. By default, upon reading a data file, iiV displays all transverse slices mapping the full voxel range to 256 grey level colors. Each displayed slice is an object with independent features that can be manipulated.
iiV has grown in utility and flexibility to the point of including many user friendly interactive features such as object dragging, copy, delete, paste, undo/redo, and a script language. Additional interactive capabilities include the ability to change object features such as zoom, crop-ping, rotation, scaling, thresholds, and color tables. Also, iiV allows selecting a voxel to view the original voxel value, quantified voxel value, location indices of the voxel, and location mapped to a standard coordinate space. Another interactive ability allows selecting a voxel and having slices from different views or other data auto-matically update to highlight the same or related voxel location.
The following lists the major features of iiV:
• Provides flexibility, portability, and user-friendliness.
• Performs the major utilities for displaying brain imaging data for improved understanding, sharing, and publish-ing.
• Displays 3-D data as slice objects orthogonal to the major axes.
• Displays 3-D stereotactic surface projections with loca-tion mapping to Talairach space.
• Presents multiple slices from the same or different files with each slice having independent features.
• Allows user to organize varying views of data for com-parison.
• Allows user to select a location in one object, then to automatically highlight the related location in other objects with crosshairs and slice tracking.
• Translates locations to standard spaces such as that of Talairach.
• Provides standard edit features including copy, delete, paste, and undo/redo.
Default display of an MRI stored as signed short
Figure 5
• Uses Java for cross-platform compatibility.
• Interacts easily with other Java applications.
• Runs optionally as an applet within web pages or embedded within other Java applications.
The following sections expound on these features.
A. Viewing slices
Data from 3-D files are displayed as slices orthogonal to any of the three major axes (see Fig. 6). When displaying brain images, slices are considered transverse (parallel slices orthogonal to the z-axis running from the bottom to the top of the brain), coronal (parallel slices orthogonal to
the y-axis running from the back to the front of the brain) or sagittal (parallel slices orthogonal to the x-axis running from the left to the right of the brain). This paper uses the term slice location to refer to the z-axis location for trans-verse slices, the y-axis location for coronal slices, and the x-axis location for sagittal slices.
iiV maintains the original 3-D data in memory to allow quick updating of scaling, colors, and slice locations as well as remapping the display back to voxel values. Voxels are mapped to display colors via linear scaling (with pos-sible maximum and minimum thresholds) and a color look-up table with 256 values (see Fig. 7). Scaling and color tables can be different for each slice displayed. Scale thresholds allow hiding voxels below or above a value.
This shows orthogonal views of an MRI with a transverse view on the left, coronal view on top right, and sagittal view on bot-tom right
Figure 6
The top picture outlines mapping short words (16 bit) whose values can range from -32768 to +32767 to color values
Figure 7
For example, when viewing normalized PET radiation count data, an investigator may not wish to see values below some minimum count corresponding to back-ground noise. Color tables can include transparent colors that allow see-through to objects in the background.
Displayed slices can be individually moved, zoomed, rotated, flipped, cropped, copied, and deleted. They may also employ new voxel scale factors, color maps, and coor-dinate maps. Slice locations can be incremented or decre-mented to display any slice parallel to the initial slice. Automatic annotation shows labels for orientation and slice location. Fig. 6 shows slices annotated with the fol-lowing labels: R, for right; L, for left; A, for anterior; P, for posterior; I, for inferior; and S, for superior. The number at the center bottom of each slice specifies the slice loca-tion in millimeters in Talairach coordinates. The annota-tion permits control of color, font and number format.
For examining specific voxels in the brain, iiV shows voxel values for locations selected with the mouse over an image. The values are displayed in a separate dialog win-dow or in a show point display line object as seen at the bottom of Fig. 6. Each show point display line is actually two lines. The first line shows the original data file name, the raw voxel value, the quantification factor, and the quantified voxel value. The second line shows the map-ping name, the raw location indices, and the location mapped into a standard space. A show point display line may show values for the data the mouse is currently select-ing, or it may be keyed to show values for specific data. For example, the mouse may select a voxel over an MRI, and the show point display line shows the corresponding voxel from PET data. There may be multiple show point display lines allowing the user to view corresponding voxel values from multiple sources.
To help locate specific voxels over multiple displayed slices, iiV includes the ability to display crosshairs, and to automatically update crosshair locations or slice loca-tions. The white lines in Fig. 6 demonstrate how cross-hairs highlight a voxel. The crosscross-hairs can automatically update to show the same location as that selected by the mouse over any image. If the selected location is in a dif-ferent slice then either the crosshairs become dashed lines or, with automatic slice updating, the slice location updates as well as the crosshairs. This automatic updating feature works well when viewing orthogonal slices of the same data. For example, selecting a voxel in the transverse view can automatically update the sagittal and coronal views to display the slices containing the selected voxel highlighted with crosshairs. Additionally, a voxel selected from one data set can reveal the corresponding voxel from another data set including data from a different subject or modality. If the data is not in the same space, iiV
calcu-lates the corresponding locations via coordinate mapping transforms.
As mentioned previously, voxels can be mapped to trans-parent colors. This allows overlaying slices on top of each other making voxels from the underlaid slice visible through the transparent voxels. To facilitate overlaying, iiV allows data with the same dimensions to be automat-ically overlaid. This auto-overlay process places a top slice over a displayed bottom slice while duplicating the view mode (transverse, sagittal or coronal), slice number, zoom and cropping. For data in the same space, this ensures the overlay slice displays spatially related data at the same locations as the slice behind it. An example of overlaying would be viewing a subject's PET data superim-posed upon the subject's structural MRI; where the PET counts are below a specified minimum, the MRI is visible instead of the PET. Another example is shown in the bot-tom right of Fig. 10 where t-values are shown overlaid on top of a standard MRI image.
B. Displaying intensity projections
Data from 3-D files are also viewable as intensity projec-tion images (see Fig. 8). As with standard slices, intensity projections appear as 2-D images orthogonal to one of the three major axes – except each displayed voxel is the max-imum (or minmax-imum) value from all voxels along a line parallel to the axis. A projection can be restricted to a range of orthogonal indices allowing for half brain projec-tions, etc.
Most features of standard slices are available except those related to the orthogonal dimension. Automatic labeling shows orientation values but not orthogonal location (slice location for normal slices), because it may vary from voxel to voxel within the projected view. When voxels are selected over projected views, iiV uses the original indices of the projected voxel for displaying and coordinate map-ping. When automatically updating crosshairs over pro-jected views the crosshairs become dashed lines when a voxel in another view is selected that has different indices from the original projected voxel. Conversely, when a voxel over a projection view is selected, standard slice views, with automatic crosshair and/or slice tracking ena-bled, update to show location of the original projected voxel.
C. Displaying 3-D stereotactic surface projections
the 3rd dimension corresponds to the 8 surface views. The
data is viewed as standard slices with a special default coordinate map for each slice. This coordinate mapping allows tracking related points with slices of standard 3-D image files.
D. Displaying other objects
In addition to viewing data, iiV has other built-in display objects, mainly for annotation. These include text, simple shape objects, color bars, and show point display lines. The simple shapes include lines with or without arrow heads, boxes and spheres (see Fig. 7 for text, color bar, line and box examples – boxes outline the color bars). Show point display lines track and display voxel locations and values selected over an image (the bottom of Fig. 6
con-tains a show point display line). These objects can be zoomed, cropped, flipped and rotated just like image slices. Object color, font, and number formatting can also be controlled.
There are three other built-in objects that can be displayed in the display area but are not normal display objects. These are a location cursor, grid lines, and paper outline. The location cursor indicates where the next object added will appear. This location can be dragged via mouse input and is automatically updated when new objects are added. The grid lines are equally spaced horizontal and vertical lines that can have any size spacing or any color and act as a reference for aligning objects. The dialog box for grid control allows snapping objects to align precisely
This figure contains images generated from a NIfTI Z-Stat sample data file downloaded from the NIfTI web site [22]
Figure 8
with grid lines. The paper outline is a box that can be cal-ibrated to correspond to what will fit when printing to paper.
E. User interface
The design of the iiV user interface tries to maximize dis-play area while maintaining utility and flexibility. User
friendliness is another high priority, but not at the sacri-fice of functionality.
iiV maximizes its display area by keeping control func-tions in menus or dialog windows that are usually hidden. Fig. 5 shows the standard display window. If objects in the display area do not fit within the window, scrollbars
The top 3 images show orthogonal views of raw PET data
Figure 9
appear along the right and/or lower edge of the display area. Scrollbars create a virtual display area as large as memory allows. The menu bar at the top of the display can be hidden to further maximize the visible area.
iiV's interface utility and flexibility comes from the ability to place any type of display object anywhere in the display area and to individually control object features. Objects are initially added to the display area without overlap, left to right, and top to bottom with a set number per row. Once displayed the user can drag objects anywhere within the display. Feature control is done with pull down menus or in specialized dialog windows. New object types and feature control dialogs can be added to iiV without recom-piling as long as they extend the correct Java class.
For ease of use, many of iiV's edit and mouse functions mimic standard editors. Examples include selecting objects by left clicking on them or right clicking to pop up a menu with edit features such as copy, delete, and paste.
F. Editing and scripting
To enhance user-friendliness, iiV includes many features that standard editors offer. These include copy, delete, paste, and undo/redo. Also, since iiV works with objects that may have set relationships to each other, the program allows for grouping and ungrouping. iiV includes the abil-ity to print or save the display as a standard 2-D image. Furthermore, the display can be saved as a script.
Scripting is a valuable feature that greatly extends iiV's flexibility. It allows redisplay in future sessions restoring full editing and interactive abilities. Since the script is stored as a text file, viewing different data with the same complex layout simply involves text editing and replacing file names with those for the alternate data. In this way a script can act as a template. iiV automatically runs the script name ".cnu" if it exists in the user's home directory which allows setting individual preferences.
Since iiV processes scripts with BeanShell, iiV scripts have full access to the Java programming environment and can perform many complex tasks such as running interactive animations or creating complex displays with prompting for file names.
G. Run environments
iiV is run within a Java Virtual Machine (JVM). The avail-ability of JVM for most major operating systems makes it extremely portable.
iiV can run as an applet within a web browser. This is con-venient for interactive display of brain imaging data within web sites. As an applet, iiV has almost all the utility of a stand-alone version. Browsers put security restriction
on Java applets causing problems with some features and with some scripts. These restrictions may range from severe (e.g., applets unable to run at all) to lenient (e.g., treating applets as local code). One common restriction is that applets are not allowed to save to the local disk. Applets also cannot copy and paste to or from the system clipboard. Some restrictions can be overcome by changing applet security restrictions within the browser. There are also procedures to run certain applets as "trusted" with fewer restrictions than other applets. Even with most com-mon applet restrictions, iiV is a valuable interactive web display tool.
For simple data presentations and to decrease upload times to web browsers, iiV can run without loading any dialogs, menus or file formats. To this end, dialogs, menus and file formats are not compiled into iiV but are refer-enced by name and loaded when required utilizing the Java reflection API. This strategy allows iiV to load and run without the availability of certain tools. A core set of nor-mally referenced classes must exist to prevent Java from aborting with class loading exceptions.
iiV can easily be invoked and controlled from other soft-ware tools, especially those written in or with simple interfaces to Java. For example, our database management system (DBMS; Oracle v9i, Cupertino, CA) [24] can com-pare a patient's scan to a normative dataset. It can invoke iiV to display the results and to update crosshairs and slice locations upon user selection of specific results from a table (see Fig. 10). Selecting a point within iiV does the inverse – highlighting the nearest specific result in the table.
H. Extending iiV
iiV is easily extended in multiple ways:
• New file types can be added that extend the iiv.io.CNU-ImgFile class. iiV doesn't have to be modified or recom-piled to recognize the new class. The new class name is given to iiV either in the file type dialog or via a script command. After adding a new class name, the class name appears in the pull down menu for file types. Script com-mands can run every time iiV becomes invoked to always have the new file type available.
Oracle database interface tool that automates comparisons between a single subject to a group
Figure 10
• New control dialogs that extend java.awt.Dialog or iiv.dialog.CNUDialog can be added for functionality. These dialogs are readily invoked via script commands and appear in the dialog view menu.
Many other extensions to iiV are possible since it is written in Java and has clean class structure.
I. Examples of usage
iiV has proven effective; it is extensively used in our labo-ratory. The following list highlights sample uses of iiV:
• Viewing raw PET data – our first application of iiV was to display raw PET data immediately after reconstruction to look for basic problems such as abnormally low counts or head motion.
• Exploring PET comparison results – iiV is our primary tool for displaying voxelwise statistical maps of processed PET data.
• Creating presentations and journal figures – iiV is our main tool for creating data visualizations to share with others through presentations and publications.
• Viewing the results of database queries – we are currently developing Oracle database tools that work with a data-base of PET images to perform statistical analysis data-based on query parameters selected by the user. These queries pro-duce t-value images as well as lists of significant t-value peaks with their Talairach locations and probable brain regions. The database interaction tool is written in Java and easily interfaces with iiV to display the locations as the user selects them from the list. iiV displays the loca-tions as crosshairs over orthogonal slices of the t-value image overlaid on a reference MRI. This gives the user a better grasp of the location as well as the size and extent of the activation region surrounding a peak location (Fig. 10).
• Displaying within web pages – the next step in the devel-opment of database tools includes an interface for users to perform queries via a web browser to have iiV display results within the browser. We currently have a demon-stration of iiV that runs within a web browser available through the iiV home page [25].
J. Future direction
iiV continues to be a work in progress. One primary incen-tive has been the flexibility of having our own in-house tool which allows adding features as needs arise. Some features that we would like to add in the near future include the following:
• Re-sliced views – we plan to enable viewing slices at arbi-trary angles not just perpendicular to the major axes. This requires re-slicing the data while maintaining fast inverse mapping to the original data for voxel location and dis-play of associated parameter values.
• 3-D views – with 3-D packages available in Java, it will soon be easy to generate 3-D perspective views within iiV. Although other packages can generate 3-D views outside of iiV, implementing 3-D views would enable immediate access to voxel location and parameter values. Currently the only 3-D views available in iiV are 3D-SSP views gen-erated by NEUROSTAT [21] and intensity projections.
• Display results of the Talairach daemon – we plan to have iiV describe brain locations based on voxel locations mapped to Talairch locations as referenced by the Tairach Daemon [26].
• Display results of the MNI probabilistic atlas – we plan to have iiV describe probabilistic brain locations mapped to the MNI template as referenced by the MNI atlas [27].
• Object inspection dialog – an object inspection dialog would enable the inclusion of features of unknown dis-played objects and associated parameters. This would ease the addition of new object types.
Conclusion
Data visualization is a problem facing brain researchers on a daily basis, therefore promoting the development of new tools. No tool has the flexibility required by all researchers. Our in-house tool has reached a utilitarian level making it valuable to many researchers. iiV is prima-rily good at displaying slices from brain data in a flexible environment for object manipulation with robust editing features such as copy, paste, undo/redo, group/ungroup. iiV provides useful feedback to the user including the dis-play of voxel location and parameter values; crosshair tracking; automatic slice updating; and overlay features. iiV is written in Java and will run under all major operat-ing systems. iiV is a proven multipurpose tool that we plan to continue developing well into the future. This report provides an introduction to iiV's many features to promote wider use in biomedical imaging.
Availability and requirements
• Project name: iiV
• Project home page: http://james.psych.umn.edu/iiV
• Operating system(s): Java Virtual Machine (available for all major operating systems)
• Other requirements: BeanShell available at http:// www.beanshell.org/.
• License: none
• Any restrictions to use by non-academics: none
Abbreviations
API: application programmer's interface; AWT: Abstract Windowing Toolkit; BIL-kit: Medical Imaging and Visual-ization Toolkit; CAD: computer-aided diagnostics; DBMS: database management system; fMRI: functional MRI; GUI: graphical user interface; iiV: internet image Viewer; I/ O: input/output; ITK: Insight Segmentation and Registra-tion Toolkit; JVM: Java Virtual Machine; MITK: Medical Imaging Interaction Toolkit; MRI: magnetic resonance imaging; MVC: model-view-controller; PET: positron emission tomography; voxel: volume pixel; VTK: Visuali-zation Toolkit; 2-D: 2-dimensional; 3-D: 3-dimensional; 3D-SSP: 3-D stereotactic surface projection.
Competing interests
The authors declare that they have no competing interests.
Authors' contributions
JTL designed and programmed the software and wrote major portions the paper. JVP oversaw writing the soft-ware and wrote and edited portions the paper. KRM con-tributed to portions of the software including application to database results and wrote and edited portions the paper. JVC helped to conceive portions of the software and helped editing the paper. All authors read and approved the final paper.
Acknowledgements
This work supported in part by NIA/NIMH Human Brain Project grant AG20852; NARSAD; and the Department of Veterans Affairs.
MATLAB is a registered trademark of The MathWorks, Inc.
IDL is a registered trademark of Research Systems, Inc.
Adobe and Photoshop are either registered trademarks or trademarks of Adobe Systems Incorporated in the United States and/or other countries.
DICOM is the registered trademark of the National Electrical Manufactur-ers Association for its standards publications relating to digital communica-tions of medical information.
ANALYZE is a trademark of Biomedical Imaging Resource, Mayo Founda-tion, Rochester, MN.
References
1. Schroeder WJ, Martin K, Lorensen WE: The Design and Imple-mentation of an Object-Oriented Toolkit for 3D Graphics and Visualization. Proceedings IEEE Visualization: San Francisco, Cali-fornia, USA 1996:93-100.
2. Robb RA, Barillot C: Interactive display and analysis of 3-D medical images. IEEE Transactions on Medical Imaging 1989,
8(3):217-226.
3. Frackowiak RSJ, Friston KJ, Frith CD, Dolan RJ, Mazziotta JC, Eds:
Human Brain Function Academic Press USA; 1997.
4. Woods RP, Cherry SR, Mazziotta JC: Rapid automated algorithm for aligning and reslicing PET images. Journal of Computer Assisted Tomography 1992, 16:620-633.
5. Rorden C, Brett M: Stereotaxic display of brain lesions. Behav-ioural Neurology 2000, 12:191-200.
6. Frank RJ, Damasio H, Grabowski TJ: Brainvox: an interactive, multimodal visualization and analysis system for neuroana-tomical imaging. Neuroimage 1997, 5(1):13-30.
7. BrainVoyager QX Viewer [http://www.brainvoyager.com/]. Brain Innovations B.V., The Netherlands
8. Strupp JP: Stimulate: A GUI based fMRI Analysis Software Package[abstract]. Neuroimage 1996, 3(3):s607.
9. Abramoff MD, Magelhaes PJ, Ram SJ: Image Processing with ImageJ. Biophotonics International 2004, 11(7):36-42.
10. Insight Segmentation and Registration Toolkit [http:// www.itk.org/]
11. Wolf I, Vetter M, Wegner I, Böttger T, Nolden M, Schöbinger M, Has-tenteufel M, Kunert T: The Medical Imaging Interaction Toolkit. Medical Image Analysis 2005, 9:594-604.
12. Whelan PF, Sadleir RJT, Ghita O: NeatVision: visual program-ming for computer-aided diagnostic applications. Radiograph-ics 2004, 24:1779-1789.
13. Huang S, Baimouratov R, Xiao P, Ananthasubramaniam A, Nowinski WL: A Medical Imaging and Visualization Toolkit in Java. Jour-nal of Digital Imaging 2006, 19(1):17-29.
14. Talairach J, Tournoux P: Co-planar Stereotaxic Atlas of the Human Brain
New York: George Thieme; 1988.
15. Evans AC, Collins DL, Milner B: An MRI-based stereotactic atlas from 250 young normal subjects [abstract]. Journal Soc Neuro-sci 1992, 18:408.
16. Evans AC, Collins DL, Mills SR, Brown ED, Kelly RL, Peters TM: 3D statistical neuroanatomical models from 305 MRI volumes.
Proceedings IEEE-Nuclear Science Symposium and Medical Imaging Con-ference 1993:1813-1817.
17. Minoshima S, Berger KL, Lee KS, Mintun MA: An Automated Method for Rotational Correction and Centering of Three-dimensional Functional Brain Images. J Nucl Med 1992,
33:1579-1585.
18. Minoshima S, Koeppe RA, Mintun MA, Berger KL, Taylor SF, Frey KA, Kuhl DE: Automated Detection of the Intercommissural Line for Stereotactic Localization of Functional Brain Images. J Nucl Med 1993, 34:322-329.
19. Minoshima S, Koeppe RA, Frey KA, Kuhl DE: Anatomic Standard-ization: Linear Scaling and Non-linear warping of Functional Brain Images. J Nucl Med 1994, 35:1528-1537.
20. Minoshima S, Koeppe RA, Fessler JA, Mintun MA, Berger KL, Taylor SF, Kuhl DE: Integrated and Automated Data Analysis Method for Neuronal Activation Studies Using [O-15]water PET. In
Quantification of Brain Function, Tracer Kinetics and Image Analysis in Brain PET Edited by: Uemura K, Lassen NA, Jones T, Kanno I. Amsterdam: Excerpta Medica (Elsevier); 1993:490-417.
21. Minoshima S, Frey KA, Koeppe RA, Foster NL, Kuhl DE: A diagnos-tic approach in Alzheimer's disease using three-dimensional stereotactic surface projections of fluorine-18-FDG PET. J Nucl Med 1995, 36:1238-1248.
22. Neuroimaging Informatics Technology Initiative [http:// nifti.nimh.nih.gov/]
23. internet image Viewer API [http://james.psych.umn.edu/iiV/doc/ api]
24. Munch KR, Carlis JV, Pardo JV, Lee JT: Bringing functional brain image analysis to the clinician: Initial assessment of an online interactive diagnostic aide. Comput Biol Med 2008, 38:155-164. 25. internet image Viewer [http://james.psych.umn.edu/iiV] 26. Lancaster JL, Summerln JL, Rainey L, Freitas CS, Fox PT: The
Talairach Daemon, a database server for Talairach Atlas Labels[abstract]. Neuroimage 1997, 5(4):s633.
Publish with BioMed Central and every scientist can read your work free of charge "BioMed Central will be the most significant development for disseminating the results of biomedical researc h in our lifetime."
Sir Paul Nurse, Cancer Research UK
Your research papers will be:
available free of charge to the entire biomedical community
peer reviewed and published immediately upon acceptance
cited in PubMed and archived on PubMed Central
yours — you keep the copyright
Submit your manuscript here:
http://www.biomedcentral.com/info/publishing_adv.asp
BioMedcentral
Pre-publication history
The pre-publication history for this paper can be accessed here:
![Figure 8This figure contains images generated from a NIfTI Z-Stat sample data file downloaded from the NIfTI web site [22]This figure contains images generated from a NIfTI Z-Stat sample data file downloaded from the NIfTI web site [22]](https://thumb-us.123doks.com/thumbv2/123dok_us/494973.1544131/14.612.54.558.90.431/figure-contains-generated-sample-downloaded-contains-generated-downloaded.webp)
