O R I G I N A L A R T I C L E
Relationship between clamp force and pull-out strength in lag
screw timber joints
Doppo Matsubara1•Yoshiaki Wakashima2•Yasushi Fujisawa2•Hidemaru Shimizu3• Akihisa Kitamori4• Koichiro Ishikawa5
Received: 8 May 2017 / Accepted: 19 July 2017 / Published online: 23 August 2017 ÓThe Japan Wood Research Society 2017
Abstract This study empirically examines the relationship between clamp force and pull-out strength in lag screw joints of timber members, using data obtained in tightening tests and pull-out tests. Maximum clamp force per unit screw length as determined from the tightening tests was lower than the lower bound for the 95% tolerance range for pull-out strength per unit screw length as determined from the pull-out tests. Moreover, X-ray CT (computed tomog-raphy) observations of anchor members from both tests revealed that failure behavior clearly differed between the tightening test and the pull-out test: tightening caused damage to the wooden, female thread in addition to major splitting damage in the wood perpendicular to the grain near the tip of the lag screw.
Keywords Lag screw jointsClamp forcePull-out strengthTightening test
Introduction
Lag screws which have benefits of minimal loosening and slippage during the initial application of loads are increasingly used to join timber members [1]. Construction management is an important component of ensuring lag screw joints are sufficiently strong, which require managers to exercise more caution than with bolt joints. For example, lag screws often cause wood cracking if screwed in without drilling a pilot hole, or driven in using a hammer [1]. These concerns are not limited to wood cracking: over-tightening lag screws may cause such joints to no longer perform at their true strength. Take for example the case of using a wrench to join a steel plate (or washer) to a timber member with a lag screw. Some of the force generated acts as a compressive force on the timber member, which generates an equivalent pull-out force on the lag screw. Tightening the lag screw until the pull-out force exceeds the wood’s pull-out strength causes the axial force on the joint (‘‘clamp force’’ below) to weaken, leading to poor adhesion between the two members. Among other construction management-related considerations, builders should ensure that lag screw joints are fastened with the proper amount of torque to prevent this from happening. To determine what con-stitutes ‘‘proper’’ torque, it is imperative to determine first the degree of clamp force caused by tightening a lag screw, and second how that clamp force relates to the pull-out strength of that screw. While many studies have been conducted on screw joints’ pull-out strength, shear strength, and other mechanical properties [2–9], we can find none that regard the relationship between clamp force and pull-out force for lag screws. We are currently devel-oping a high damping shear wall, in which the clamp force of lag screws in wood acts as a frictional resistance force between two timber members or between a timber member Part of this article was presented at the 67th Annual Meeting of the
Japan Wood Research Society, Fukuoka, Japan, March 2017.
& Doppo Matsubara
matsubara.doppo@iri-tokyo.jp
1 Tokyo Metropolitan Industrial Technology Research
Institute, 2-4-10, Aomi, Koto-Ku, Tokyo 135-0064, Japan
2 Toyama Prefectural Agricultural, Forestry and Fisheries
Research Center, 4940, Imizu, Toyama 939-0311, Japan
3 Sugiyama Jogakuen University, 17-3, Chikusa-ku, Nagoya,
Aichi 464-8662, Japan
4 Research Institute for Sustainable Humanosphere, Kyoto
University, Uji, Kyoto 611-0011, Japan
5 University of Fukui, 3-9-1, Fukui, Fukui 910-8507, Japan
and a steel plate [10]. Controlling the clamp force is an important part of generating the frictional resistance in this project. We thus became interested in clarifying the rela-tionship between clamp force and pull-out strength in lag screws, to investigate techniques for controlling the clamp force of lag screws.
In the present study, we empirically studied the rela-tionship between clamp force and pull-out strength using experimental data collected from tightening tests and pull-out tests. Our study also covers clamp force-related settings and considerations for preventing defects due to lag screw tightening.
Materials and methods
Tightening tests of lag screw timber joints
Lag screw joints were subjected to tightening tests according to the protocol in Matsubara et al. [11] using a bolt force tester (NST-500NM: Japan Instrumentation System Co., Ltd., Nara, Japan). Test specimens were composed of four parts: an attaching member, an anchor member, a round washer, and a lag screw (Fig.1). Attaching and anchor members were created from three conifers: Cryptomeria japonica, Chamaecyparis obtusa, and Pseudotsuga menziesii. Figure 2 contains their dimensions: attaching members were 309459200 mm while anchor members were 60945960 mm. Speci-mens were tested after sitting in the laboratory for approx. one month at 20±2°C. A bolt hole of u13 mm was
drilled in the attaching member; a pilot hole ofu7.5 mm and 55 mm deep was drilled in the anchor member. The curing room ranged from 32 to 43% humidity during the curing period (humidity was not strictly controlled). The density and moisture content of each specimen are shown in Table1. To estimate the effect of washer sizes on clamp force and tightening angle, round washers of three dimensions were tested: u3092.3 mm (diameter–thick-ness ratio=13.0), u3293.2 mm (10.0), and
u3594.5 mm (7.8). M12 lag screws were used, having a length of 180 mm and pitch diameter of 4.4 mm. One is pictured in Fig. 3along with detailed dimensions. During the tests, specimens were first set up in the testing device, and clamp force was measured by means of a load cell wedged between the attaching and anchor members. The tightening angle of the screw head was also measured. The screw was inserted along the wood perpendicular to the grain. The anchor member was held by a rotation-stopping component to limit any rotation due to tightening torque. Lag screws were tightened using a torque wrench until the screw head pressed against the round washer, i.e., until the axial force reached 10–30 N. Screws were tightened at a speed of 20 rpm until a reduction in clamp force was observed, according to the protocol in [11]. Screws were fastened for an effective screw length (i.e., the distance the screw embeds in the anchor member; see Fig.1) deter-mined prior to testing: 42.7 mm for specimens with
u3092.3 mm washers, 41.8 mm for specimens with
u3293.2 mm washers, and 40.5 mm for specimens with
u3594.5 mm washers. Six specimens were tested in each condition.
Attaching member Round washer
Lag screw Load cell
Tightening torque
Steel base
㸸M12 L=180
(UNIT : mm)
See (b)
See (a)
(a)
(b) Anchor member
㸸φ302.3
㸸φ323.2
㸸φ354.5
㸸Cryptomeria japonica
㸸Chamaecyparis obtusa
㸸Pseudotsuga menziesii
㸸Cryptomeria japonica
㸸Chamaecyparis obtusa
㸸Pseudotsuga menziesii
Initial screw lengthͤ
Rotation-stopping component 30
Pull-out tests of lag screw timber joints
Lag screw pull-out tests were performed using leftover anchor member from the tightening tests. The anchor members tested were made from the same three tree spe-cies. Figure4 shows the experimental method. Specimen dimensions, pilot hole diameter, and screw-insertion direction were identical to the tightening tests. Wood density and moisture content were within the ranges indi-cated in Table1. First, a screw was inserted into an anchor member fixed by the rotation-stopping component to a target screw length of 46 mm [here, 45.0–49.0 mm
(measured screw length)] using a torque wrench. Pull-out tests were conducted at a test speed of 88 mm/min (=tightening speed 20 rpm9pitch diameter of 4.4 mm) using a universal tester (AG-100kNX Plus: Shimadzu Corp., Kyoto, Japan). Load was measured over a single stroke. Six specimens were tested in each condition.
X-ray CT (computed tomography) scanning
Failure behavior following the tightening test and pull-out test was observed in each anchor member using an X-ray CT scanner (SkyScan2211, Bruker, Kontich, Belgium).
45
200 25
20 Bolt hole㸸φ13
L-direction
100 100
30
L-direction
(UNIT : mm)
60
45
60 Pilot hole㸸φ7.5
(a) Attaching member (b) Anchor member
55
Fig. 2 Dimensions of attaching member and anchor member
Table 1 Basic properties of test
materials Conifer species Member Density (kg/m
3) Moisture content (%)
Cryptomeria japonica Attaching member
Ave. 312 9.8
SD 15.4 0.7
Anchor member
Ave. 353 9.0
SD 7.3 0.4
Chamaecyparis obtusa Attaching member
Ave. 423 9.3
SD 20.6 1.2
Anchor member
Ave. 429 8.7
SD 8.2 0.6
Pseudotsuga menziesii Attaching member
Ave. 572 8.5
SD 70.2 1.0
Anchor member
Ave. 661 8.7
SD 11.5 0.7
Specimens were imaged using a flat-panel X-ray detector at a tube voltage of 50 kV and tube current of 320lA.
Results and discussion
Relationship between clamp force and tightening angle
Figure5 shows the relationship between clamp force and tightening angle obtained in the tightening tests for a rep-resentative specimen of each tree species. As tightening angle increases, clamp force continues to rise even after some initial yielding, but decreases after reaching a max-imum value. Figure6 shows the relationship between washer diameter–thickness ratio and maximum clamp force. Significant variation in clamp force due to diameter– thickness ratio is not visible for C. japonica members. However, C. obtusa and P. menziesii members exhibit
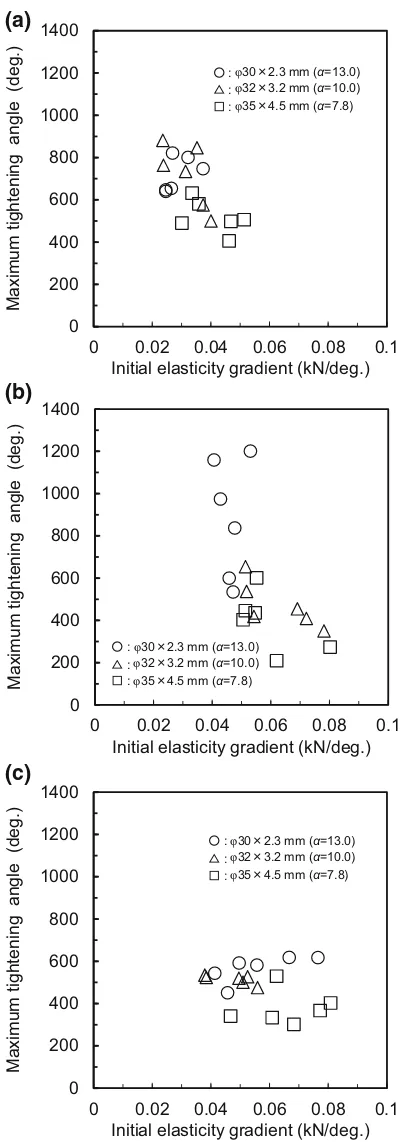
higher maximum clamp force at larger diameter–thickness ratios. In addition, Fig. 5 shows that larger diameter– thickness ratios result in the maximum clamp force being reached at larger tightening angles. We next investigated the relationship between maximum tightening angle in the maximum clamp force and the initial elasticity gradient (kN/°) based on the relationship between clamp force and tightening angle. Initial elasticity gradient was determined separately for each specimen by calculating the slope of the elasticity gradient using the method of least squares over the interval it appeared linear. Maximum tightening angle was determined by subtracting the x-intersect of the elas-ticity gradient from tightening angle. Figure7 shows the relationship between washer diameter–thickness ratio and maximum tightening angle. Maximum tightening angle seems to increase with increasing diameter–thickness ratio for C. japonica, C. obtusa, and P. menziesii specimens. Figure8 shows the relationship between initial elasticity gradient and maximum tightening angle. Although there is a rather large dispersion, maximum tightening angle tends to decrease with increasing initial elasticity gradient. Where embedment traces of round washer on attaching member were confirmed visually in all specimens, this finding can be attributed to the washer exhibiting higher embedment stiffness at smaller diameter–thickness ratios [12].
Comparison of pull-out strength and maximum clamp force
Figure9 shows the representative load–displacement pro-files obtained in the pull-out tests for a single test stroke, while Table2shows an overview of pull-out strength. Pull-out strength is defined in this study as the maximum load
121 59 8
21 11.6
4.4 9.3 11.8
(UNIT : mm)
Fig. 3 Detailed dimensions of lag screw
Rotation-stopping component
Load
Lag screw
Anchor member
Screw length
Lag screw
Load
Rotation-stopping
component
observed in the pull-out test. The table contains values for Pmax-L (kN/mm) and P5%-pull (kN/mm): these measures, respectively, indicate pull-out strength per unit screw
0 2 4 6 8 10 12 14
0 300 600 900 1200 1500
Clamp force
(kN)
Tightening angle (deg.)
φ30㽢2.3 mm (α=13.0)
φ32㽢3.2 mm (α=10.0)
φ35㽢4.5 mm (α=7.8)
0 2 4 6 8 10 12 14
0 300 600 900 1200 1500
Clamp force
(kN)
Tightening angle (deg.)
φ30㽢2.3 mm (α=13.0)
φ32㽢3.2 mm (α=10.0)
φ35㽢4.5 mm (α=7.8)
0 2 4 6 8 10 12 14
0 300 600 900 1200 1500
Clamp force
(kN)
Tightening angle (deg.)
φ30㽢2.3 mm (α=13.0)
φ32㽢3.2 mm (α=10.0)
φ35㽢4.5 mm (α=7.8)
(a)
(b)
(c)
Fig. 5 Relationship between clamp force and tightening angle. a Cryptomeria japonica, b Chamaecyparis obtusa, c Pseudotsuga menziesiiandadiameter–thickness ratio of round washer
y= 0.0296x+ 5.5662
R² = 0.0252
0 2 4 6 8 10 12 14
5 10 15
Max
imum clamp
force
(kN)
Diameter - thickness ratio
y= 0.3407x+ 5.2559
R² = 0.3545
0 2 4 6 8 10 12 14
5 10 15
Max
imum c
lamp
fo
rc
e
(k
N)
Diameter - thickness ratio
y= 0.1913x+ 8.957
R² = 0.4777
0 2 4 6 8 10 12 14
5 10 15
Max
imum
clamp force
(kN)
Diameter - thickness ratio
(a)
(b)
(c)
y= 35.719x+ 283.48 R² = 0.3184
0 200 400 600 800 1000 1200 1400
5 10 15
Max
imum tightening
angle
(deg.)
Diameter - thickness ratio
y= 95.518x- 398.77 R² = 0.5554
0 200 400 600 800 1000 1200 1400
5 10 15
Max
imum tightening
angle
(deg.)
Diameter - thickness ratio
y= 34.62x+ 130.6 R² = 0.5993
0 200 400 600 800 1000 1200 1400
5 10 15
Max
imum tightening
angle
(deg.)
Diameter - thickness ratio
(a)
(b)
(c)
Fig. 7 Relationship between maximum tightening angle and diam-eter–thickness ratio of round washer. a Cryptomeria japonica, bChamaecyparis obtusa, andcPseudotsuga menziesii
0 200 400 600 800 1000 1200 1400
0 0.02 0.04 0.06 0.08 0.1
Max
imum tightening
angle
(deg.)
Initial elasticity gradient (kN/deg.)
φ30㽢2.3 mm (α=13.0) φ32㽢3.2 mm (α=10.0) φ35㽢4.5 mm (α=7.8) 䕿:
䕧: 䕕:
0 200 400 600 800 1000 1200 1400
0 0.02 0.04 0.06 0.08 0.1
Max
imum
tightening
angle
(deg.)
Initial elasticity gradient (kN/deg.)
φ30㽢2.3 mm (α=13.0) φ32㽢3.2 mm (α=10.0) φ35㽢4.5 mm (α=7.8) 䕿:
䕧: 䕕:
0 200 400 600 800 1000 1200 1400
0 0.02 0.04 0.06 0.08 0.1
Max
imum tightening
angle
(deg.)
Initial elasticity gradient (kN/deg.)
φ30㽢2.3 mm (α=13.0) φ32㽢3.2 mm (α=10.0) φ35㽢4.5 mm (α=7.8) 䕿:
䕧: 䕕:
(a)
(b)
(c)
length and the lower bound for the 95% tolerance range for pull-out strength per unit screw length (confidence level=75%) [13]. Figure9and Table2both indicate that Pmax, Pmax-L, and P5%-pull were highest in P. menzeisii, followed byC. obtusa and C. japonica. Next, the maxi-mum clamp force obtained in the tightening tests was converted into maximum clamp force per unit screw length (FL: kN/mm). The relationship between FL and P5%-pull was then examined. Figure10 shows the relationship between washer diameter–thickness ratio andFL/P5%-pull.
0 2 4 6 8 10 12 14 16 18
0 2 4 6 8 10
Load
(kN)
Displacement (mm)
Cryptomeria japonica Chamaecyparis obtusa Pseudotsuga menziesii
Fig. 9 Load–displacement relationship obtained in pull-out tests
0 0.2 0.4 0.6 0.8 1 1.2
5 10 15
FL
/
P5%
̺
pull
Diameter - thickness ratio
0 0.2 0.4 0.6 0.8 1 1.2
5 10 15
FL
/
P5%
̺
pull
Diameter - thickness ratio
0 0.2 0.4 0.6 0.8 1 1.2
5 10 15
FL
/
P5%
̺
pull
Diameter - thickness ratio
(a)
(b)
(c)
Fig. 10 Relationship between FL/P5%-pull and diameter–thickness
ratio of round washer. a Cryptomeria japonica, b Chamaecyparis obtusa,cPseudotsuga menziesii,FL: maximum clamp force per unit
screw length, andP5%-pull: 5% lower limit value of pull-out strength
per unit screw length Table 2 Results of pull-out tests
Conifer species Pmax(kN) Pmax-L(kN/mm) P5%-pull(kN/mm)
Cryptomeria japonica
Max. 9.12 0.198 0.142
Min. 7.52 0.159
Ave. 8.32 0.179
SD 0.67 0.016
Chamaecyparis obtusa
Max. 11.83 0.252 0.204
Min. 9.92 0.216
Ave. 11.13 0.239
SD 0.81 0.015
Pseudotsuga menziesii
Max. 16.53 0.329 0.272
Min. 13.37 0.294
Ave. 14.93 0.312
SD 1.03 0.017
(a)
Pull-out(b)
Tightening―Cryptomeria japonica―
―Chamaecyparis obtusa―
(a)
Pull-out(b)
Tightening―Pseudotsuga menziesii―
(a)
Pull-out(b)
TighteningA B
A B A B
A B A B
B A B
A
Spling Spling Spling Spling Spling Spling
Spling Spling
Spling Spling Spling
60
60
45
UNIT : mm A
B 60
60
45
UNIT : mm
A B 60
60
45
UNIT : mm A
B 60
60
45
UNIT : mm
A B 60
60
45
UNIT : mm A
B 60
60
45
UNIT : mm 45
60
45 60
45 60
45
60
45
60
45
60 Fig. 11 X-ray CT-scan images
Here, the screw length in tightening forFLwas calculated according to the following equation:
Lscrew¼Linit:þ
Phmax
360 ; ð1Þ
whereLscrew is screw length in tightening, Linit. is initial screw length prior to tightening test (as described in Fig.1),Pis screw pitch (4.4 mm), andhmaxis maximum tightening angle calculated as described above. Strictly speaking, a lag screw expands when tightened, altering its pitch. We estimated the maximum expansion factors for the lag screw having the highest recorded maximum clamp force among all 54 specimens (*12 kN) based on screw length, cross-sectional area, and elastic Young’s modulus. As the value measured was only in the order of 0.09%, Eq. (1) simplifies this consideration by assuming a constant screw pitch. In addition, Eq. (1) is simplified by neglecting the deformation between the thread of the lag screw and the wood. No obvious trends were observed in the relationship between washer diameter–thickness ratio and FL/P5%-pull for any of the tree species. Generally speaking, however, FLshrunk more thanP5%-pull, withC.japonica,C.obtusa, andP.menzeisiihaving respective average and minimum FL/P5%-pullratios of 0.83 and 0.74, 0.88 and 0.78, and 0.84 and 0.78. Figure11 shows X-ray CT images of anchor members after the tightening (inu3594.5 mm) and pull-out tests. The images depict the damage sustained by anchor members in the tightening and pull-out tests. Major splitting damage was observed in the wood perpendicular to the grain near the tip of the lag screw in C.japonica, C.obtusa, andP.menzeisiispecimens. The female grooves that formed in the wood are relatively distinct, but some deformation behavior is visible in wooden ridges between the grooves, which have warped upward in the direction of the pull-out force. In comparison, significant splitting damage, similar to that sustained in the pull-out tests, was observed in each tree species following the tightening tests. However, the wooden grooves were lost in all tree species, failure behavior that clearly differed from that seen after the pull-out tests. We can consider these differences in failure behavior in combination withFLbeing smaller than
P5%-pull. Mechanical resistance on a lag screw is attributable to the compressive resistance placed on the screw thread along a joint’s axis by the surrounding wood [14]. When the lag screw is tightened, however, shear resistance generated from tightening torque are generated in addition to this compressive resistance. We can thus suppose that these composite mechanical elements result in the destruction of the wooden internal thread, and accordingly a smallerFLthanP5%-pull.
In summary, tightening resulted in a smaller maximum clamp force than the pull-out force observed in the pull-out test, and failure behavior in anchor members clearly
differed between the pull-out tests and the tightening tests. When assessing maximum clamp force, it appears neces-sary to multiplyP5%-pullby a reduction coefficient of some magnitude to prevent damage to anchor members due to tightening. We propose a value of 0.7 for this coefficient, asFLis approximately 70% ofP5%-pullwhen calculated for all specimens tested in this study (see Fig.10).
Conclusions
We performed tightening tests and pull-out tests on lag screw joints, and investigated the relationship between clamp force and pull-out strength data obtained in the experiments. Joints consisted of two timber members of three tree species (C. japonica, C. obtusa, and P. men-zeisii), M12 lag screws, and round washers of three sizes (u3092.3,u3293.2, andu3594.5 mm). Our findings are as follows:
1) In the tightening tests, maximum tightening angle increased with increasing washer diameter–thickness ratio, and maximum tightening angle decreased with increasing initial elasticity gradient.
2) In the pull-out tests,P.menzeisiihad the highest pull-out strength, followed byC.obtusaandC.japonica. 3) Maximum clamp force per unit screw length (FL) was lower than the lower bound for the 95% tolerance range for pull-out strength per unit screw length (P5%-pull). Their ratio (FL/P5%-pull) had respec-tive average and minimum values of 0.83 and 0.74 for C. japonica specimens, 0.88 and 0.78 for C. obtusa, and 0.84 and 0.78 for P. menzeisii specimens.
4) X-ray CT observations of anchor members following the tightening and pull-out tests revealed that failure behavior clearly differed between the two tests: tightening caused damage to the wooden, female thread in addition to major splitting damage in the wood perpendicular to the grain near the tip of the lag screw.
The findings above reveal that tightening the lag screw in a lag screw joint between timber members results in a smaller maximum clamp force than the pull-out strength for the same joint. They suggest the necessity of taking their relationship into account when deciding on a clamp force for tightening steps to prevent damage to the anchor member.
References
1. Japan Timber Engineering Society (2012) ISBN:978-4-7530-1856-7 C3052. Inoue-shoin Co. Ltd., Tokyo, pp 173-175 2. Tokuda M, Hirashima Y, Matsubara H (1989) The strength of
lag-screw joints I. Lateral strength parallel to the grain (in Japanese). Mokuzai Gakkaishi 35(6):473–481
3. Tokuda M, Hirashima Y, Matsubara H (1989) The strength of lag-screw joints II. Lateral strength perpendicular to the grain (in Japanese). Mokuzai Gakkaishi 35(6):482–488
4. McLain TE (1997) Design axial withdrawal strength from wood I. Wood screws and lag screws. Forest Prod J 47(5):77–84 5. Pirnbacher G, Brandner R, Schickhofer G (2009) Base
parame-ters of self-tapping screws. In: Proceedings, CIB-W18, Duben-dorf, paper 42-7-1
6. Frese M, Blass HJ (2009) Models for the calculation of the withdrawal capacity of self-tapping screws. In: Proceedings, CIB-W18, Dubendorf, paper 42-7-3
7. Graham DA, Carradine DM, Bender DA, Dolan JD (2010) Monotonic and reverse-cyclic loading of lag screw connections for log shear wall construction. J Matelials in Civil Eng 22(1):88–95
8. Kobayashi K, Yasumura M (2013) Influences of number and spacing of fasteners on single shearing properties of
steel-to-timber joints with lag screws (in Japanese). Kozo Kogaku Ron-bunshu B 59B:537–543
9. Yeh MC, Lin YL, Huang GP (2014) Investigation of the struc-tural performance of glulam beam connections using self-tapping screws. J Wood Sci 60(1):39–48
10. Wakashima Y, Shimizu H, Fujisawa Y, Ishikawa K, Kitamori A, Matsubara D (2016) High damping shear walls using wood friction joints. In: Proceeding of world conference on timber engineering, Vienna, Austria
11. Matsubara D, Nakano T, Shimada M, Funada R, Hattori N (2015) Effect of tightening velocity on the torque coefficient of timber jointing with bolts (in Japanese). Mokuzai Gakkaishi 61(1):33–39 12. Matsubara D, Shimada M, Hirai T, Funada R, Hattori N (2016) Embedment of metal washers into timber members of bolted timber joints I. Application of the theory of a beam on an elastic foundation (in Japanese). Mokuzai Gakkaishi 62(4):119–132 13. Architectural Institute of Japan (2006) Standard for structural
design of timber structures (in Japanese). Architectural Institute of japan, Tokyo, pp 373–375