ORIGINAL ARTICLE
Influence of moisture content on estimating Young’s modulus
of full-scale timber using stress wave velocity
Mariko Yamasaki1 · Chika Tsuzuki2 · Yasutoshi Sasaki1 · Yuji Onishi3
Received: 18 November 2016 / Accepted: 21 February 2017 / Published online: 31 March 2017 © The Japan Wood Research Society 2017
Keywords Stress wave propagation velocity · Young’s modulus · Moisture content
Introduction
For the purposes of forestry management and carbon stocks meant restraining carbon emissions, wood utiliza-tion, especially the material use of the wood which is not broken down of wood as much as possible attracts attention all over the world. In the case of material use, the quality assessment of the actual timber being used may be neces-sary since timber is a biologically varying material. Among the quality assessments of timber, especially while seeking the mechanical properties of such structural lumber in use, grading according to Young’s modulus plays a very
impor-tant role [1]. Grading timber according to Young’s modulus
not only allows us to understand the elastic properties of the timber individually, but also allows the fracture strength of the timber to be predicted. In recent years, grading lum-ber has become a major issue, particularly in Europe and the United States.
Furthermore, if it is possible to make good use of meas-uring the Young’s modulus at the stage of standing trees and logs to determine its usage application, it is possible to utilize the timber more efficiently, subsequently adding value to the timber. Currently, in Japan, the usage of logs is mainly determined based on visual observations of the shape. However, studies on selecting a timber according to future application using the Young’s modulus of standing
tree and logs have been performed (for example, 2–10]). In
these studies, the longitudinal vibration test or ultrasonic and stress waves for the Young’s modulus measurement were adopted and the qualitative effectiveness has been shown. However, of course, the Young’s modulus of log, Abstract The effect of moisture content on the stress
wave propagation velocity was investigated in order to estimate the Young’s modulus of full-scale timbers in an air-drying state using the measurement of stress wave propagation velocity above the fiber saturation point. Using Japanese cedar lumber, the velocity and the density under high-moisture condition and air-drying states were meas-ured respectively; after measuring the modulus of elasticity in an air-drying state, the moisture content of each condi-tion was measured. By performing numerical analysis on these data, the relationship between the moisture content and the rate of change of velocity of full-scale timbers was derived. This relationship was used to estimate the Young’s modulus of the timber in the air-drying state from the velocity in high-moisture condition. First, the velocity and the Young’s modulus in an air-drying state were esti-mated accurately from its density, moisture content and velocity under high-moisture condition. In cases where the density could not be measured, using the database of mechanical properties with the Monte Carlo simulation method, the Young’s modulus of the full-scale timber in an air-drying state might be estimated within 20% accuracy from its moisture content and velocity under high-moisture condition.
* Mariko Yamasaki
marikoy@agr.nagoya-u.ac.jp
1 Department of Biosphere Resources Science, Graduate
School of Bioagricultural Sciences, Nagoya University, 464-8601 Nagoya, Japan
2 Kanefusa Corporation, Oguchi, Aichi 480-0192, Japan
3 Miyagi Prefectural Forestry Technology Institute,
namely green wood under highly moist condition is differ-ent from the value of the Young’s modulus in the air-drying state when being used. Therefore, it is necessary to have some sort of moisture correction to estimate the Young’s modulus in the air-drying state. In the cases of stress wave and ultrasound, since the free water within the cell pores cannot follow the vibration, it is known that the Young’s modulus, calculated from the velocity and density, is
over-estimated above the fiber saturation point (FSP) [11–14].
Moisture correction on the velocity or density is, there-fore, also required to determine the Young’s modulus under high-moisture condition. For Young’s modulus measure-ment during high-moisture condition via the stress wave
method, Sobue [11] proposed the mobility of free water
and performed the moisture correction by adjusting the density, and some researchers used this approach in their
reports [12, 14]. In the researches which investigate the
influence of moisture content of wood on the velocity, they measure the velocity some times in the course of the drying process generally. Therefore, the size of a test specimen is around 500 mm in length and it is smaller than full-scale timber in most cases for experimental reasons. However, in the case of wood, there are large differences between small specimen and full-scale timber used in the actual building because full-scale timber has some defect like knots and intra-subject variation. Therefore, it is important to use the full-scale timber as specimen for the investiga-tion of mechanical or physical properties of wood used in
the buildings. Unterwieser and Schickhofer [10] were used
the relatively large spruce specimen and investigated the influence of moisture content on the velocity and dynamic Young’s modulus. They measured the velocity by two methods, that is, measurements of natural frequency and ultrasonic runtime, then reported the empirical formula to obtain the velocity at 12% moisture content from that below and above FSP.
In this study, with the aim of estimating the Young’s modulus of a full-scale timber in the air-drying state from the stress wave propagation velocity, measured in high-moisture condition, the effect of high-moisture content on the stress wave propagation velocity was examined. Specimen was general size of structural timber in Japan, which had larger dimension than that used in the Unterwieser and
Schickhofer’s research [10]. Because the full-scale
tim-ber was used as a test specimen, it was difficult to dry the specimen so as to uniformly distribute moisture. Therefore, in this study the experiment was done only twice at the green condition and the air-drying state and the numerical method was used for analysis. Specifically, using Japanese cedar lumber, the density and the stress wave propagation velocity in high-moisture condition and in the air-drying state were measured, respectively; after bending test to measure the modulus of elasticity in the air-drying state,
the moisture content was measured using the oven-drying method. By carrying out numerical analysis on these data, the relationship between the moisture content and the rate of change of velocity in the timber was derived. Using this relationship, the method of estimating the Young’s modu-lus of the full-scale timber in the air-drying state from the stress wave propagation velocity in high-moisture condition was suggested and its effectiveness was verified.
Materials and methods
Determination of moisture content: stress wave velocity curve
Full‑scale test for analysis
First, the symbols in the present paper are listed in Table 1.
To examine the relationship between the stress wave propa-gation velocity and moisture content of the full-scale tim-ber as well as the relationship between Young’s modulus with these former two parameters, the following experi-ments were conducted. The test specimens were full-scale
sawn lumbers of Japanese cedar (Cryptomeria japonica D.
Don) from the Miyagi Prefecture in Japan. The dimensions
of the specimens were 120 (b) × 210 (h) × 4000 (l) mm.
The number of test specimens, n, was 38. Before drying
[moisture content, ub = (113.2 ± 29.5)%] and after drying
[moisture content, ua = (16.4 ± 8.3)%], the density (ρ,
cal-culated from the weight and volume), and the stress wave
propagation velocity (before drying, Vb; after drying, Va)
of each specimen were measured. For the numerical anal-ysis, to be described later, group A with a moisture con-tent higher than the fiber saturation point (hereafter, FSP)
after drying (ua > 28%; number of test specimens, n = 6)
and group B with a moisture content lower than the FSP
after drying (ua < 28%; number of test specimens, n = 32)
were created by adjusting the drying period. As for drying condition, one-half specimens were dried under high tem-perature (outsourcing, drying period of 7 days, maximum dry-bulb temperature of 120 °C) and the others were dried under middle temperature (at Miyagi Prefectural Forestry Technology Institute, drying period of 14 days, initial dry-bulb temperature of 60 °C and final dry-dry-bulb temperature of 75 °C).
The stress wave propagation velocity was measured using a portable stress wave propagation timer, FAKOPP, with installation of transmission sensors at the two ends of the specimen (cross sections of timber), respectively.
As shown in Fig. 1, the sensor installation positions on
value of stress wave propagation velocity at that point was obtained. From the stress wave propagation veloci-ties at the three points per test specimen (M1, P, M2), P data are the pith data, whereas the average values of M1 and M2 are the data for mature wood because they were located outside from 15 annual rings. Besides, averag-ing the values usaverag-ing (P1+(M1 + M2)/2)/2) gave the aver-age data of the test specimen. In addition, in the study
by Guan et al. [14], the relationship between the moisture
content and the rate of change of velocity using small test
specimens, taken from the heartwood or sapwood was examined. In this study, the measurement points M1 and M2 were different, which may or may not be sapwood. Clear division between heartwood and sapwood for these data was impossible.
Furthermore, to examine the modulus of elasticity (MOE) in the air-drying state, a full-scale bending test on specimens after drying was carried out. The bending test, based on a standard test method that is ISO-compliant, was a four-point bending test with a distance of 3780 mm between the supporting points (18 times of the beam height) and trisecting the distance between the support-ing and load point into 1260 mm (6 times of the beam height). With the stroke control of constant displacement
speed set at 20 mm min−1, the loading was performed
using full-scale mechanical testing equipment. The bending load from the load cell, attached to the equip-ment, as well as the bending deflection from the displace-ment gauge, installed on the neutral axis of the specimen center, was measured using data loggers, respectively. These captured data were recorded in a personal com-puter. From the relationship of the measured load and the central bending deflection, the modulus of elasticity (MOE) was determined.
After completing the bending test, samples with width of about 20 mm were taken in longitudinal direction of timber, approximately 1 m from the end of the remaining fractured specimens to determine the moisture contents
after drying, ua, using the oven-drying method. Then the
moisture contents after drying, ub, was obtained by weight
change. Table 1 Symbols in the present paper
Mechanical properties V Stress wave velocity (m s−1)
u Moisture content (%)
Vu/V0 The ratio of stress wave velocity at certain moisture content (Vu) to stress wave velocity at 0% moisture content
(V0) (Change rate of stress wave velocity)
V28H Stress wave velocity at u = 28% calculated by u − Vu/V0 curve above FSP (u ≧ 28%) (m s−1)
V28L Stress wave velocity at u = 28% calculated by u− Vu/V0 curve below FSP (u ≦ 28%) (m s−1)
ρ Density (kg m−3)
FSP Fiber saturation point (at 28% moisture content in this paper)
ρV2 Young’s modulus by calculation of stress wave velocity and density (GPa) (Young’s modulus using stress wave
method)
MOE Modulus of elasticity in bending (GPa)
Subscript 0 0% moisture content (oven-dry condition)
15 15% moisture content (air-dried condition)
b Mechanical property before drying (u ≧ 28%)
a Mechanical property after drying (u ≧ 28% or u ≦ 28%)
Coefficient p Slope of u− Vu/V0 curve below FSP (u ≦ 28%) (1/%)
q Slope of u− Vu/V0 curve above FSP (u ≧ 28%) (1/%)
r Intercept of u− Vu/V0 curve above FSP (u ≧ 28%)
Other n Number of specimen
Numerical analysis
Using some data of full-scale timbers in the “Full-scale test for analysis” as described above, the transition of stress
wave propagation velocity, V, with the change in moisture
content of the full-scale timber [hereafter, named the
rela-tionship of moisture content (u) − rate of change of
veloc-ity (Vu/V0)] was determined using the numerical analysis
method, shown below. A schematic diagram for the
rela-tionship of u − Vu/V0 is shown in Fig. 2. With the
horizon-tal axis as the moisture content (u), the vertical axis as
the rate of change of velocity (Vu/V0) is normalized when
the moisture content is 0%. According to Sandoz [3], it is
considered that the influence of moisture content on stress wave propagation velocity of the timber is different below the FSP, containing only bound water, from above the FSP, containing also free water. Therefore, in this study, it
was assumed that the u − Vu/V0 relationship shows bilinear
behavior before and after the FSP (for example, [3]). The
relationship is represented by the Eq. (1), below the FSP,
and Eq. (2), above the FSP.
To obtain the bilinear equation, V0 is required to serve
as the reference. Since V0 is the stress wave propagation
velocity in absolute-dry condition, its measurement using a full-scale timber is very difficult. Thus, in the present
numerical analysis, a valid V0 was first estimated from the
range of 4000–6000 m s−1 with respect to the experimental
results of both before drying and after drying via the fol-lowing method. Using this estimated value to determine the
coefficients of Eqs. (1) and (2), the validities of both
equa-tions were verified. The analysis procedure is as follows:
1. Prepare the following set of data to be used in the
anal-ysis; Group A: Ai (ubi, Vbi, uai, Vai), (i = 1, 2,…,6), (uai
> 28%), Group B: Bj (ubj, Vbj, uaj, Vaj), (j = 1, 2,…,31),
(uaj < 28%). As described below, for verification of the
analysis, one set of experimental values in Group B was not used in the numerical analysis.
2. With respect to one data set, Ai (i = 1, 2,…,6), in Group
A, conduct the analysis following steps (3)–(7);
3. Assuming V0 as a reference for the rate of change of
velocity within the range 4000–6000 m s−1 at intervals
of 10 m s− 1 in this study, conduct calculations
follow-ing steps (4) and (5) for the one assumed value;
4. Using the data set of Ai and the assumed V0 in step
③, calculate the coefficients of p(V0), q(V0), r(V0) for
the bilinear relationship of Vu/V0 from Eqs. (1) and (2)
(Fig. 3a). These coefficients vary with respect to the
assumed value of V0 (Fig. 3b).
5. If the assumed value of V0 in step (4) is close to the
true value when the coefficients of p(V0), q(V0), r(V0)
(1)
Vu
V0 =pu+1 (u≦28%),
(2)
Vu
V0
=qu+r (u≧28%).
0.6 0.7 0.8 0.9 1.0 1.1
0 20 40 60 80 100
Vu/V0=pu+1
Vu/V0=qu+r
Moisture content u (%) FSP
(28%)
Change rate of stress wave velocity
Vu
/
V0
Fig. 2 Schematic diagram of moisture content—the change rate of stress wave velocity curve
Data set of Group Ai
Calculated value
0 20 40 60 80 100 (ua,Va/V0)
1
Vu/V0=p(V0)u+1
V28/V0
Vu/V0=q(V0)u+r(V0)
(ub,Vb/V0)
Moisture content u (%) FSP
(28%)
Ch
an
ge
ra
te
of
stre
ss
wave
veloci
ty
Vu
/
V0 (a)
0 20 40 60 80 100 Moisture content u (%)
V0(m s-1) 4200 4400 4600 4800 5000 5200
FSP (28 %) 1
Change
ra
te of
st
re
ss wave
veloci
ty
Vu
/
V0 (b)
0 20 40 60 80 100 (ub,Vb/V0)
(ua,Va/V0)
V28j
Moisture content u (%) 1
V28/V0
Data set of Group Bj
Calculated value
FSP (28%)
Ch
an
ge
ra
te
of
stre
ss
wave
veloci
ty
Vu
/
V0 (c)
are valid values, use another set of experimental data to
calculate the velocity at the FSP, V28L, from the side of
low moisture content (u ≦ 28%) and the velocity at the
FSP, V28H, calculated from the side of high moisture
content (u ≧ 28%), both results should match.
Thus, to obtain reasonable coefficients of p, q, and r, the
following method of verifying data was created using the
data set of Group B, Bj (j = 1, 2,…,31).
The calculated velocity at the FSP from the side of low
moisture content, V28L, is obtained by transforming Eq. (1)
into Eq. (3); the calculated velocity at the FSP from the
side of high moisture content, V28H, is obtained by
trans-forming Eq. (2) into Eq. (4).
After substituting the coefficients of p(V0), q(V0), r(V0)
from the relationship of u − Vu/V0 obtained in Step ④ and
one of data set in Group B, Bj, into these equations, then
the difference in both, ΔV28j, is calculated using Eq. (5)
(Fig. 3c).
Calculate the sum of ΔV28j, SA(V0), corresponding to
the 31 sets of Bj;
6. Corresponding to Ai, set the V0i to be V0 to minimize
the obtained SA(V0) in Step (5);
7. Corresponding to the V0i obtained in Step (6), set each
coefficient of p(V0i), q(V0i) and r(V0i) to be pi, qi and
ri, as the analysis results of Ai;
8. Compute the coefficients p, q, r of Eqs. (1) and (2) by
averaging the values from the analysis results of all Group A.
Full‑scale test for the verification of analysis result
To validate the u − Vu/V0 relationship obtained in the above
analysis, verification was carried out as follows. Using the experimental groups described in “Full-scale test for analy-sis”, the one remaining data set not used was subjected to the verification method. The relationship of data for
analy-sis and data for verification is shown in Fig. 4.
Specifically, the above numerical analysis was carried out using 31 sets of data, excluding one set of experimental
(3) V28L=
Va⋅(28p+1) ua⋅p+1
,
(4) V28H= Vb⋅(28q+r)
ub⋅q+r
.
(5)
ΔV28j=|
|V28Lj−V28Hj||.
(6)
SA(V0
) =
31 ∑
j=1 ΔV28j.
values, from Group B (n = 32) to determine the u − Vu/V0
relationship according to the preceding paragraph. The
validity of the u − Vu/V0 relationship, obtained in the
anal-ysis, was verified using the one set of data that was not used for the analysis at that time. From a combination of specimens for analysis and the specimen for verification,
the analysis result for each specimen of Group A (n = 6)
can be obtained 31 ways. In other words, using the other 31 specimens in Group B for the analysis of each specimen in Group A, the analysis results on the number of
speci-mens in Group A (n = 6; coefficients of relationship, p, q,
r) are obtained for the exclusive one specimen in Group B,
as shown in Fig. 5. These average values can be verified by
the exclusive specimen in Group B.
Results and discussion
Relationship between moisture content and the rate of change of stress wave velocity
The physical properties and Young’s modulus of the
cedar full-scale specimens are listed in Table 2.
Look-ing at the influence of the measurement points along end Fig. 4 Schematic diagrams of data using numerical analysis and ver-ification
0.6 0.7 0.8 0.9 1.0
Pith A1 A2 A3 A4 A5 A6
0 20 40 60 80 100 Moisture content u (%)
FSP (28 %)
Change rate of stress wave veloci
ty
Vu
/
V0
section on the stress wave propagation velocity, the meas-urements on the mature wood are slightly larger than the measurement on the pith for both before and after drying of both Groups A and B. This trend can also be seen in
previous research [15]. However, there was also no
signif-icant statistical difference between both groups. For the
Young’s modulus after drying, comparing the ρa(o)Va(o)2,
calculated from density and stress wave propagation
velocity and the MOEa(o), ρV2 was larger than MOE by
8.3% at the measurement points of pith and by 13.9% at the mature wood, respectively. It is considered that this tendency, which was also observed in the previous study
[16], is due to the frequency-dependent (time-dependent)
influence of the Young’s modulus caused by the viscoe-lasticity of the timber.
By conducting numerical analysis on these data, the
u − Vu/V0 relationship of full-scale timber was obtained.
Based on the respective measurement points of the stress wave propagation velocity for the analysis, the
coefficients of the u − Vu/V0 relationship are
summa-rized in Table 3. As for the moisture content below FSP,
the slopes of the relationship, p, were at −0.00645 and
−0.00586 on the pith and the mature wood, respectively;
whereas the slopes for above FSP, q, were at −0.00215
and −0.00218, respectively. There was not much dif-ference between measurement points; but regardless of measurement point, the rate of change of velocity with change in moisture content below the FSP was larger than that above the FSP. Such tendency has also been observed
in a lot of previous studies (for example, [3, 10–12, 14,
17–19]). The slopes, p, were about three times of the
slopes, q. First, this could be due to the well-known fact
that the Young’s modulus increases with a decrease in the moisture content below the FSP, whereas the Young’s modulus of the timber is constant above the FSP. Even above the FSP, the velocity does not become constant and changes under the influence of moisture content because the free water in the cell lumen cannot follow the
vibra-tion with high speed [3]. The results of the regression
analysis on the extracted data of Guan et al. [14]
[Japa-nese cedar, size of specimen: 20(T) × 20(R) × 500(L) mm]
are also shown in Table 3. Comparing the present
analy-sis results with the results of Guan, as shown in Table 3,
the overall trends are generally similar. However, looking in detail, the rate of change of velocity with respect to moisture content in the present analysis results is larger than that in the results of Guan. Since the suggested results of Guan here are only intended to fit the regres-sion equation into one data set, the number of samples was very limited. Furthermore, since the size of the spec-imen and the measurement methods are different, it was not possible to simply compare and was suggested that the full-scale timber is susceptible to moisture content.
Table
2
Ph
ysical and mec
hanical pr
oper
ties of specimens
St
andar
d de
viation is giv
en in r
ound br
ac
ke
ts
an means number of specimen b MOE means modulus of elas
ticity in bending
Exper i-ment al -gr oup n a Bef or e dr ying Af ter dr ying Young’
s modulus (Af
ter dr ying) ρb (k g m −3 ) ub (%) Vb (m s −1) ρa (k g m −3 ) ua (%) Va (m s −1) ρa Va 2 (GP
a)
MOE
b (GP
The validity of the u − Vu/V0 relationship derived in this method was verified using the one dataset, which was not used in the numerical analysis to determine the
coefficients for the u − Vu/V0 relationship, among the
experimental data of Group B. In other words, using the relational expressions obtained, the stress wave propa-gation velocity in the air-drying state (moisture content
after drying, ua), Va(e), was estimated from the stress wave
propagation velocity in high-moisture condition
(mois-ture content before drying, ub), Vb(o); then the estimated
value Va(e) and the observed value Va(o) were compared.
The values used are the coefficients of the u − Vu/V0
rela-tionship, shown in Table 3. The relationship of the
esti-mated value, Va(e), and the observed value, Va(o), is
plot-ted in Fig. 6a. The estimation accuracy (estimated value/
observed value) of Va is listed in Table 4. As shown in
these figure and tables, for any measurement point of the pith and mature wood, the estimated values and the observed values also showed very good agreement. Addi-tionally, to examine the versatility of this relationship, it
was verified using the experimental data of Sandoz [2]
and Unterwieser and Schickhofer [10]. Using spruce as
a test specimen [Size of specimen: 100 (Width) × 140 (Height) × 2800 (Length) mm], Sandoz examined the cor-relation between the ultrasonic velocity, measured at 22% moisture content and the ultrasonic velocity, measured at 14% moisture content. Therefore, for the results of San-doz, the velocity at 14% moisture content was estimated from the velocity at 22% moisture content using the
u − Vu/V0 relationship, obtained in the present analysis;
these estimated values were compared with the observed
values. The results are shown in Fig. 6b. The estimation
accuracy was 0.99 ± 0.01 which was very good. Simi-larly, for the experimental data reported by Unterwieser and Schickhofer, which were obtained using the relatively large test specimen of spruce [Size of specimen: 202 mm and 98 mm (Width) × 49 mm and 41 mm (Height) × 4500 (Length) mm], the velocity at 12% moisture content was estimated from the ultrasonic velocity above FSP. As a result, the estimation accuracies were 1.02 ± 0.001 (using coefficients of the relational expression at pith shown
in Table 3), 1.01 ± 0.001 (at mature), 1.02 ± 0.001 (for
average), respectively, which also showed very good
accuracy. Hence, it is considered that the u − Vu/V0
Table 3 Coefficients of the relational expression of moisture content and change rate of velocity
Standard deviation is given in round brackets
an means number of analyzed data set (Group A)
b Analyzed with data extracted from Guan [14]. Size of Guan’s specimen is 20(T) × 20(R) × 500(L) mm
Measurement position na V
0 (m s−1) Vu/V0 = pu + 1 Vu/V0 = qu + r
p (1/%) q (1/%) r
Present Pith 6 5302 (312) −0.00645 (0.00061) −0.00215 (0.00038) 0.8796 (0.0277)
Mature wood 6 5390 (309) −0.00586 (0.00056) −0.00218 (0.00035) 0.8970 (0.0257)
Average 6 5346 (309) −0.00616 (0.00057) −0.00216 (0.00036) 0.8880 (0.0262)
Guanb Heartwood 1 – −0.00541 −0.00161 0.8895
Sapwood 1 – −0.00396 −0.00108 0.8979
Overall 2 – −0.00498 −0.00123 0.8836
Fig. 6 Relationship between estimated and observed velocity
3000 4000 5000 6000
Pith Mature Average
Estimated velocity Va(e) (m s-1)
Ob
served
st
re
ss wave
ve
loci
ty
Va(
o)
(m
s
-1)
(a)
3000 4000 5000 6000
3000 4000 5000 6000 3000 4000 5000 6000
(b)
Estimated velocity V14(e) (m s-1)
Ob
served
ul
tras
onic
velo
ci
ty
V14
(o
)
(m
s
relationships obtained by the analysis of this study are valid and also excellent in versatility.
Estimation of Young’s modulus in an air-drying state using stress wave velocity measured under high-moisture content condition
Comparison with experimental MOE
Using the estimated stress wave propagation velocity in
the air-drying state (low moisture content state), Va(e), from
the previous section, the Young’s modulus ρa(e)Va(e)2 in the
air-drying state (moisture content after drying, ua) was
cal-culated. The aim of this study is to estimate the Young’s modulus in the air-drying state from the stress wave prop-agation velocity of the high-moisture condition. Thus,
without measuring the ρa(o), the required density under the
moisture content after drying, ρa(e) at ua, in the calculation
was derived from the density under high-moisture
condi-tion, ρb(o) using the following equation with consideration
of volume change of timber.
Here, α is overall shrinkage rate; δ is the average
shrink-age rate for 1% moisture content; the subscripts L, R and T indicate the longitudinal direction, the radial direc-tion and the tangential direcdirec-tion of timber, respectively.
In this paper, though all the moisture contents, u, are
expressed with the % notation, the ua and ub in Eq. (7), are
not expressed with % notation. Extracted from the
litera-ture [20] for this study, αL = 0.19%, αR = 2.68% and αT =
6.57%; dividing these values by 28, the values of δL, δR,
δT were then obtained. Comparing this estimated ρa(e)Va(e)2
with the ρa(o)Va(o)2 and the MOE
a(o), obtained from the
experiments in the air-drying state, the estimation accuracy was verified. The estimation accuracy are collectively
sum-marized in Table 4. As shown in Table 4, the estimation
accuracies for any measurement points of pith and mature
wood were also very high; for ρa(o)Va(o)2 and MOE
a(o), the overall estimation accuracies were 1.00 ± 0.09 and 1.12 ± 0.12, respectively. The estimation accuracy for MOE
was lower than the case of ρV2. As mentioned above, this is
because the Young’s modulus of the timber calculated from
the stress wave propagation velocity and density with ρV2
is different from the MOE obtained by bending test in the first place.
Next, the estimation accuracy of the Young’s modulus, corrected to a moisture content of 15%, was examined. (7)
𝜌a(e)=
(
1+ua
)
(
1+ub
)
⋅
(
1+ 𝛼L
)
⋅
(
1+ 𝛼R
)
⋅
(
1+ 𝛼T
)
(
1+100ua𝛿L
)
⋅
(
1+100ua𝛿R
)
⋅
(
1+100ua𝛿T
)𝜌b(o).
Table
4
The lis
t of es
timation accur
acy
St
andar
d de
viation is giv
en in r
ound br ac ke ts Subscr ip
ts of “a”, “15”, “(e)”, “(o)” and “(AS
TM)” mean “mois
tur
e content af
ter dr
ying”, “mois
tur
e content of 15%”, “es
timated v
alue”, “obser
ved v
alue” and “obser
ved v
alue collected b
y
AS
TM me
thod [
21
]” (see T
able 1 ) Em means Y oung’
s modulus es
timated using Monte Car
lo simulation (see T
able
1
) and MOE means modulus of elas
ticity in bending
an means number of anal
For the estimated ρ15(e)V15(e)2, the stress wave propagation
velocity under 15% moisture content, V15(e), was derived
from the stress wave propagation velocity under
high-mois-ture condition, Vb(o) (moisture content before drying, ub),
using the u − Vu/V0 relationship, obtained in this analysis;
the density under 15% moisture content, ρ15(e), was derived
from the density under high-moisture content condition,
ρb(o), using a same method as described before, that is, with
Eq. (7), then ρ15(e)V15(e)2 was calculated. On the other hand,
for the observed value of Young’s modulus, the moisture content correction was carried out from individual data of
moisture content ua, using the ASTM D2915-98 method
[21] with the following equation.
Here, extracted from ASTM [21], γ = 1.44, β = 0.0200.
When the Young’s modulus Ea in the Eq. (8) is ρa(o)Va(o)2
or MOEa(o), the Young’s modulus E15 in the Eq. (8) will
become ρV2 or MOE, respectively (hereafter, referred
to as ρV2
15(ASTM) or MOE15(ASTM), respectively). For the
results, the estimation accuracy is shown in Table 4. For
ρV2
15(ASTM) and MOE15(ASTM), the average estimation accu-racies in total were 1.02 ± 0.09 and 1.13 ± 0.12, respec-tively. That is, also for the estimation of Young’s modulus
at 15% moisture, it is shown that the ρ15(e)V15(e)2, derived
from density, moisture content, stress wave propagation velocity in the high-moisture content stage, exceeding the
FSP, is nearly accurate to the ρV2
15(ASTM), obtained using
the u − Vu/V0 relationship in this analysis; furthermore,
even the MOE can be estimated within an error of 10–20%.
Estimation by Monte Carlo simulation without density
As described above, using the u − Vu/V0 relationship
ana-lyzed in this study, it was feasible to estimate the Young’s
modulus in the air-drying state (ρV2 or MOE) with high
(8) E15=Ea×
(𝛾−𝛽⋅15)
(𝛾−𝛽⋅ua)
.
accuracy from the stress wave propagation velocity Vb(o),
measured at high moisture content. However, since the measurement of both density and moisture content are required for this estimate, the work onsite is, therefore, complicated, in particular when the measurement target is the log, these measurements are practically impossible. Therefore, the Young’s modulus estimation was examined without using these parameters to determine the accuracy of estimation.
First, when the density was unknown, that is, only the stress wave propagation velocity and the moisture content were known, the estimation accuracy of MOE was veri-fied. The moisture content in this case is not the moisture content on surface; it is the average moisture content of the timber as a whole. The estimation was carried out using
the Monte Carlo simulation method [22]. That is, using the
existing database, related to the density–Young’s modu-lus relationship of the full-scale timber in the air-dying state, on a simulation with random numbers, the Young’s modulus was estimated from the stress wave propagation velocity only, without measuring the density. The
data-base of Japanese cedar (n = 7875) was used as the reference
[23]. While setting the moisture contents of the estimated
Young’s modulus for comparison, there were the
experi-mental value during the measurement, ua, and the average
equilibrium moisture content of Japan at 15%. The estima-tion accuracy (estimated value/observed value) is shown in
Table 4. In addition, Fig. 7 shows the comparison of the
estimated Em(e) and MOE(o), in which the measurement
points of stress wave propagation velocity on the pith are taken as an example of the relationship between estimated
value and observed value. Figure 7a shows the comparison
in the case of the moisture content after drying, ua; also,
Fig. 7b shows a comparison in the case of 15% moisture
content. As shown in Table 4, for ρ(o)V(o)2 and MOE
(o) for
any moisture content, the estimation errors of Em(e) (that is,
Ema(e)/ρa(o)Va(o)2, E
ma(e)/MOEa(o), Em15(e)/ρV15(ASTM)2, Ema(e)/
Fig. 7 Estimation accuracy of bending Young’s modulus without using density data. a Moisture content at experiment and b moisture content of 15%
4 5 6 7 8 9 10 11 12 13
(a)
Pith
Observed Young's modulus
MO
Ea(o)
(GPa
)
Estimated Young's modulus
ma(e)
E (GPa)
4 5 6 7 8 9 10 11 12 13
4 5 6 7 8 9 10 11 12 13 4 5 6 7 8 9 10 11 12 13
(b)
Pith
Observed Young's modulus
MO
E15(ASTM
)
(GPa
)
Estimated Young's modulus
m15(e)
MOE15(ASTM)) were within 10% and 20%, respectively. The estimation accuracy only dropped slightly, compared to the results derived from the measured density, as described above. The estimated values were larger than the observed values because the density of the specimen used in this experiment is considered to be slightly lower [(379 ± 37) kg
m−3], compared to the density distribution of the database
used as a reference in the Monte Carlo simulation method
[(411 ± 45) kg m−3]. Nonetheless, the extent of this error is
very insignificant. Using this estimation method it is possi-ble to ensure practical estimation accuracy without measur-ing the density.
Estimation accuracy without MC data
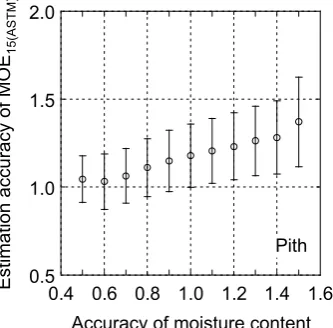
Onsite at a log market, it is often difficult to obtain the real moisture content of full-scale timbers instantly and non-destructively. Therefore, for the case where both density and moisture content are unknown, that is, only the stress wave propagation velocity can be measured, examining whether it is possible to estimate the Young’s modulus in the air-drying state with some accuracy was carried out. First, an arbitrary moisture content above the FSP was assumed to be corresponding to the stress wave propaga-tion velocity in high-moisture condipropaga-tion (before drying), Vb(o); V15(e) in the air-drying state (moisture content of 15%) was estimated from the stress wave propagation velocity
Vb(o) at that time using the u − Vu/V0 relationship obtained
in this study. Subsequently, using a Monte Carlo simula-tion method as described above, the Young’s modulus in
the air-drying state (moisture content of 15%), Em15(e), was
estimated from this V15(e) and compared with the observed
value, MOE15(ASTM). As an example, the results in the case
of measurement on the pith are shown in Fig. 8, with the
horizontal axis as the accuracy of moisture content, that is
the ratio of the assumed value over the real measured value,
ub; if the value is closer to 1, it means that the assumed
value is closer to the measured value of the moisture con-tent. The vertical axis is the estimated accuracy of MOE in the air-drying state (moisture content of 15%). From
Fig. 8, when the assumed value of moisture content is half
of the true value (0.5 on the horizontal axis), the estimation
accuracy of MOE15(ASTM) becomes 1.04 ± 0.13; in contrast,
when the assumed value of moisture content is 1.5 times (1.5 on the horizontal axis), the estimation accuracy of MOE becomes 1.37 ± 0.26. For instance, in a full-scale tim-ber of 80% moisture content, MOE is estimated by assum-ing the moisture content as 40%. Although the assumed moisture content is incorrect, the estimated value is about the same as the observed value. As mentioned above, this is because the Young’s modulus derived via the Monte Carlo method without measuring the density has been overesti-mated about 20%. This point is offset by having underesti-mated the moisture content, the resulting estimation accu-racy hence improves. Conversely, assuming 120% moisture content on an 80% moisture content of a full-scale timber to estimate MOE, the value is being overestimated by about 40%. For this result, the difference in the measurement position is hardly found.
From above, even when both the density and the mois-ture content were not known, while measuring the stress
wave propagation velocity Vb, of full-scale timber above
the FSP, if the moisture content was set to be lower in the analysis, it was suggested that the Young’s modulus of full-scale timber in the air-drying state could be mated with a relatively good accuracy. Being able to esti-mate the Young’s modulus in the air-drying state at the stage of log is a very useful technique for efficient utiliza-tion of wood; that is, using the appropriate wood in the appropriate place.
Conclusion
In this study, aiming to estimate the Young’s modulus of full-scale timber in the air-drying state from the stress wave propagation velocity measurement under high-mois-ture condition, the effect of moishigh-mois-ture content on the stress wave propagation velocity was investigated. That is, hav-ing measured the stress wave propagation velocity, mois-ture content, density and Young’s modulus of the timber before drying and after drying, these experimental data were used via numerical analysis to derive the relationship between moisture content and rate of change of velocity of the full-scale timber. Using the obtained relationships, the Young’s modulus of timber in the air-drying state was estimated from the stress wave propagation speed under 0.5
1.0 1.5 2.0
0.4 0.6 0.8 1.0 1.2 1.4 1.6 Accuracy of moisture content
Estimation accuracy of MO
E15(ASTM)
Pith
Fig. 8 Change of estimation accuracy of MOE15 caused by
high-moisture condition and its effectiveness was verified. The obtained results are as follows:
1. Using the relationship between moisture content and rate of change of velocity, derived via numerical analysis, the stress wave propagation velocity and the Young’s modulus could be estimated from the density, moisture content and stress wave propagation velocity of full-scale timber before drying (moisture condition above the fiber saturation point) with high accuracy. For the estimation of stress wave propagation veloc-ity, the results were verified experimentally and even with different tree species, the relationship equations derived in this study were fully applicable.
2. In the case that the density cannot be measured, using the existing database of mechanical properties with Monte Carlo simulation method, the Young’s modulus of full-scale timber in the air-drying state could be esti-mated from the moisture content and the stress wave propagation velocity before drying within an estima-tion error of 20%.
3. Even when both density and moisture content are unknown, if the moisture content is set lower in the analysis, the Young’s modulus in bending (MOE) of full-scale timber in the air-drying state could be calcu-lated from its stress wave propagation velocity before drying.
References
1. Sobue N (1995) Grading of tree, log, lumber and wood-based material using Young’s modulus (in Japanese). In: The Japan wood research society, Working group of wood-based materials and timber engineering 1995 autumn symposium ‘Performance evaluation and non destructive test of wood-based materials’, Nagoya international exhibition hall, Nagoya
2. Sandoz JL (1989) Grading of construction timber by ultrasound. Wood Sci Technol 23:95–108
3. Sandoz JL (1993) Moisture content and temperature effect on ultrasound timber grading. Wood Sci Technol 27:373–380 4. Nanami N, Nakamura N, Arima T, Okuma M (1993) Measuring
the properties of standing trees with stress wave III. Evaluating the properties of standing trees for some forest stands (in Japa-nese). Mokuzai Gakkaishi 39:903–909
5. Nakamura N (1996) Measurement of the properties of standing trees with ultrasonics and mapping of the properties’ (in Japa-nese). Bull Tokyo Univ For 96:125–135
6. Ikeda K, Kino N (2000) Quality evaluation of standing trees by a stress-wave propagation method and its application I. Seasonal change of moisture contents of sugi standing trees and evaluation with stress wave propagation velocity (in Japanese). Mokuzai Gakkaishi 46:181–198
7. Ikeda K, Arima T (2000) Quality evaluation of standing trees by a stress-wave propagation method and its application II.
Evalua-tion of sugi stands and applicaEvalua-tion to producEvalua-tion of sugi (Crypto‑
meria japonica D. Don) structural square sawn lumber (in Japa-nese). Mokuzai Gakkaishi 46:189–196
8. Wang X, Ross RJ, Green DW, Brashaw B, Englund K, Wolcott M (2004) Stress wave sorting of red maple logs for structural quality. Wood Sci Technol 37:533–537
9. Ishiguri F, Matsui R, Iizuka K, Yokota S, Yoshizawa N (2008) Prediction of the mechanical properties of lumber by stress-wave velocity and Pilodyn penetration of 36-year-old Japanese larch tress. Holz Roh Werkst 66:275–280
10. Unterwieser H, Schickhofer G (2011) Influence of moisture con-tent of wood on sound velocity and dynamic MOE of natural fre-quency– and ultrasonic runtime measurement. Eur J Wood Prod 69:171–181
11. Sobue N (1993) Simulation study on stress wave velocity in wood above fiber saturation point (in Japanese). Mokuzai Gak-kaishi 39:271–276
12. Wang SY, Chuang ST (2000) Experimental data correction of the dynamic elastic moduli, velocity and density of solid wood as a function of moisture content above the fiber saturation point. Holzforschung 54:309–314
13. Wang SY, Chiu CM, Lin CJ (2002) Variations in ultrasonic wave velocity and dynamic Young’s modulus with moisture content for Taiwania plantation lumber. Wood Fiber Sci 34:370–381 14. Guan H, Nishino Y, Tanaka C (2002) Estimation of moisture
content in sugi wood with sound velocity during natural drying process (in Japanese). Mokuzai Gakkaishi 48:225–232
15. Kodama Y (1990) A method of estimating the elastic modu-lus of wood with variable cross-section forms by sound veloc-ity. I. Application for logs (in Japanese). Mokuzai Gakkaishi 36:997–1003
16. Arriaga F, Íñiguez-González G, Esteban M, Divos F (2012) Vibration method for grading of large cross-section coniferous timber species. Holzforschung 66:381–387
17. Sakai H, Minamisawa A, Takagi K (1990) Effect of moisture content on ultrasonic velocity and attenuation in woods. Ultra-sonics 28:382–385
18. Lee CJ, Wang SY, Yang TH (2011) Evaluation of moisture con-tent changes in Taiwan red cypress during drying using ultra-sonic and tap-tone testing. Wood Fiber Sci 43:57–63
19. Chan JM, Walker JC, Raymond CA (2011) Effects of moisture content and temperature on acoustic velocity and dynamic MOE of radiate pine sapwood. Wood Sci Technol 45:609–626
20. Fushitani M (1985) Shrinkage and swelling. In: Fushitani M et al (eds) Wood science 2/ physics of wood, Buneido Shuppan, Tokyo, p 62
21. ASTM D2915-98 (1998) Standard practice for evaluating allow-able properties for grades of structural lumber. ASTM Interna-tional, West Conshohocken
22. Yamasaki M, Sasaki Y (2010) Determining Young’s modulus of timber on the basis of a strength database and stress wave propa-gation velocity I: an estimation method for Young’s modulus employing Monte Carlo simulation. J Wood Sci 56:269–275 23. Yamasaki M, Sasaki Y, Iijima Y (2010) Determining Young’s