Article
Simulation Analysis of Solution Transportation
Absorption Chiller with the Capacity from 25 RT to
1000 RT
Koji Enoki 1, Fumi Watanabe 2, Seigo Tanaka 3, Atsushi Akisawa 2,* and Toshitaka Takei 2
1 Department of Mechanical Engineering and Intelligent Systems, The University of Electro-Communications, 1-5-1, Chofugaoka, Chofu-shi, Tokyo 182-8585, Japan
2 Department of Mechanical System Engineering, Tokyo University of Agriculture and Technology, 2-24-16, Koganei-shi, Tokyo 184-8588, Japan
3 Former affiliation: Department of Mechanical System Engineering, Tokyo University of Agriculture and Technology, 2-24-16, Koganei-shi, Tokyo 184-8588, Japan
* Correspondance: [email protected] Tel: +81 42 338 7226, Fax: +81 42 338 7226
Abstract: Utilization of wasted heat instead of fuel combustion is effective to reduce primary energy consumption for mitigating global warming problem. Because wasted heat sources are not necessarily located close to areas of heat demand, one of the difficulties is that wasted heat has to be transferred from heat source side to heat demand side, which may require heat transportation over long distance. From this point we proposed and have examined new idea of heat transportation using ammonia-water as the working fluid which system is named Solution Transportation Absorption chiller, in short STA. Our previous studies of STA were mainly the experimental investigation with STA facility which cooling power was 25RT (90kW). As a result, the COP of STA was found almost same value 0.65 with the conventional absorption chiller without depending on the transportation distances. The simulation using AspenHYSYS also examined with same experimental condition. The experimental data showed good agreement with the simulation calculation. In this study, we examined the large-scale cooling power STA on simulation. The examination cooling powers were from 90 kW (25RT) to 3517 kW (1000RT). All cooling power achieved around COP 0.64 including pump power consumptions. In addition, we performed the dynamic simulation. As the results, there was no effect of pipeline size on the cooling capacities and mass flow rates. Furthermore, the stability time of the cooling capacities and mass flow rates were almost same regardless of the pipeline size and cooling capacity. In other words, STA may be achieved the same COP even though having various complex conditions compared with the conventional absorption chiller.
Keywords: absorption chiller; thermal energy transportation; solution transportation; ammonia-water; COP; simulation
1. Introduction
Utilization of wasted heat instead of fuel combustion is effective to reduce primary energy consumption for mitigating global warming problem. Because wasted heat sources are not necessarily located close to areas of heat demand, one of the difficulties is that wasted heat has to be transferred from heat source side to heat demand side, which may require heat transportation over long distance. Conventional ways conducted in actual district heating and cooling systems are to transport steam and chilled water for heating and cooling respectively. Both working media need to be insulated to prevent heat loss.
absorbed into the weak solution at the absorber. The process produces strong solution and absorption heat which needs to be released to the outside. When the strong solution is heated in the generator, the refrigerant vapor goes out to the condenser where it turns into liquid by cooling. Then the liquid refrigerant returns to the evaporator and repeats the same process continuously. If the chilled water which produced by the evaporator want to transport to long distance, it is necessary to insulate the pipeline, so it surely occurred heat loss.
(a) Conventional absorption chiller system
(b) STA system
Fig.1 Comparison between conventional absorption system and STA
As one means of solving the problem, heat transportation is a traditional issue to utilized unexploited heat from industry, for example. Chemical components such as methane or methanol are examined to transfer thermal energy over long distance [1]. Exothermic and endothermic reactions work to absorb heat from outside and discharge heat to demand side, respectively. In the case using methanol, H2 and CO decomposed from methanol at heat source side with the temperature
of 150-200 °C are transported to user side, where methanol synthesis reaction is operated to supply heat of 150 °C. Then methanol goes back to the heat source side. These systems incorporate pipelines to transport chemical components. In contrast, there exists batch systems to carry phase change materials by truck vehicles [2], [3], [4]. It is possible to transfer thermal energy of different temperature levels of 50 °C or 100 °C by selecting appropriate PCM materials. Heat of 100 °C can be converted into cooling at heat use side. This kind of system has been operated some places in Japan to utilize waste incineration heat [5]. Transporting chemical materials by trucks also works for heat transportation in the similar way. Ogura analyzed a system with "chemical heat pump container" which uses CaSO4 and water as the working pair [6]. A model analysis of PCM transportation to
utilize industrial surplus heat for district heating system was conducted by Ciu et al. which compared the performance by transportation modes such as trucks, railways and maritime [7].
system divides an absorption chiller into two parts. The generator and the condenser are located on heat source side while the evaporator and the absorber are on heat demand side. Both the conventional system and STA system satisfy the same boundary condition of heat recovery and heat supply to the demand side, STA can work for transferring thermal energy as the conventional system does even though the temperature of the media is ambient. The point of this technology is to convert thermal energy into concentration difference of refrigerant and solutions where heat is stored as chemical potentials. Thermal energy of wasted heat is converted into the concentration difference among the refrigerant of almost pure ammonia, strong solution with higher ammonia concentration and weak solution with lower ammonia concentration. Because the thermal energy is then free from the temperature, it can be transported at ambient temperature. With no requirement of insulation, the pipelines can be simplified and cost-effective. Moreover, the pressure of heat source side which have a generator and condenser is approximately 1.5 MPa, it is about 4 times higher compared with heat demand side, the transporting pump for the refrigerant and weak solution are not necessary. In comparison with the conventional absorption chiller, these advantages of STA might be suitable or activate for community central heating and air-conditioning and so on.
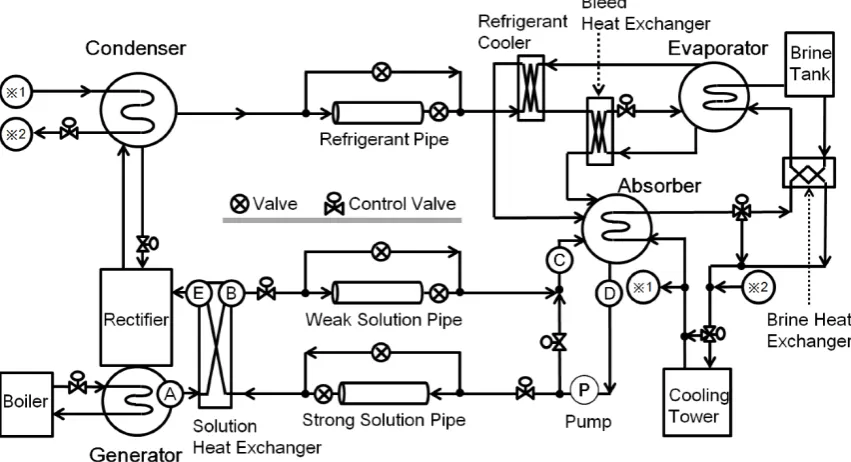
Our previous studies of STA were to mainly examine the effect of transportation distance and examine the behaviors part-load cooling operation in steady / non-steady conditions using experimental facility which cooling power was 90 kW (25RT) [9] [10]. Figure 2 and Fig. 3 show the experimental facility and the schematic flow diagram of STA. The experimental results showed that the solution transportation distances were not effect on COP and its value about 0.60 - 0.70, almost same with conventional absorption chiller. Furthermore, the behaviors part-load cooling operations in non-steady conditions (cooling power changing from 100 % to 60% and from 60 % to 100%) were almost same behaviors instead of the solution transportation distances. We built simulation model of STA (25RT) using the simulation soft AspenHYSYS, the simulation data could reproduce the characteristics of the experimental data, especially COP and behaviors of facility between the experimentation and simulation showed a good match [11].
Fig.3 Schematic flow diagram of STA experimental facility
Furthermore, the study of STA excepting ours exists. Lin et al. investigated STA experimentally with solution transportation of 30m and the cooling output of 700W [12].
In this study, we examined the large-scale cooling power STA based on AspenHYSYS simulation. The examination cooling powers were from 90 kW(25RT) to 3517 kW(1000RT), so we got beneficial data for practical use.
2. Simulation Modelling and Condition
2.1 Simulation Modelling
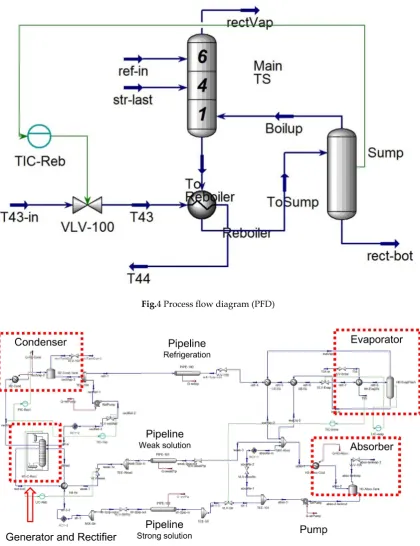
As previously described, We had already built simulation model of STA (25RT) which can reproduce the characteristics of experimental data in steady/non-steady state, then we used this AspenHYSYS model on this study.
Fig.4 Process flow diagram (PFD)
Fig.5 Simulation model of STA on AspenHYSYS
2.2 Simulation Condition
and weak solution were not required. The temperature of cooling water which flow in the absorber and condenser was set at 32 °C that was assumed the summer condition.
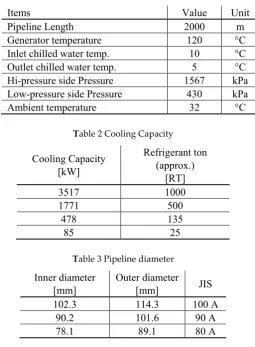
Table 2 shows the setup conditions of cooling capacity, and the information of the using pipelines are shown in Table 3. In Table 3, “JIS” is short for Japanese Industrial Standards, JIS pipeline often use in the Japanese industry. The front number of the JIS symbol almost accord with the inner diameter in a unit of mm.
Table 1 Simulation condition
Items Value Unit
Pipeline Length 2000 m
Generator temperature 120 °C
Inlet chilled water temp. 10 °C
Outlet chilled water temp. 5 °C
Hi-pressure side Pressure 1567 kPa
Low-pressure side Pressure 430 kPa
Ambient temperature 32 °C
Table 2 Cooling Capacity
Cooling Capacity [kW] Refrigerant ton (approx.) [RT] 3517 1000 1771 500 478 135 85 25
Table 3 Pipeline diameter
Inner diameter [mm]
Outer diameter
[mm] JIS
102.3 114.3 100 A
90.2 101.6 90 A
78.1 89.1 80 A
2.3. Definition of COP (Coefficient of Performance)
In this simulation, we defined the two kinds of COPs. One is the ratio of cooling power (evaporator output) QEVA [W] to heating input (generator input) QGEN [W], as shown in Eq. (1).
GEN EVA H
Q Q
COP = (1)
where COPH [-], QEVA = cooling power [W], QGEN = heating input [W]
The other type is including the pump power consumption of the strong solution E [W], as shown in Eq. (2)
E Q Q COP + = GEN EVA E (2)
3. Simulation Results
3.1 Static Simulation
3.1.1 The Effect of Cooling Capacity under the Pipeline Diameter Fixed to 100 A
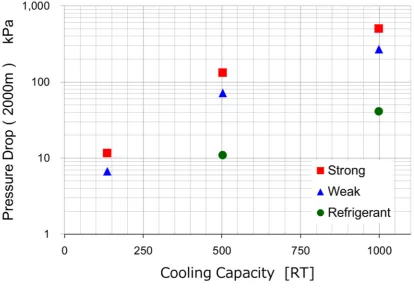
First, we examined the effect of cooling capacity under the pipeline diameter fixed to 100 A (pipeline length 2000 m). Figure 6 and Fig. 7 show the relation between cooling capacity and mass flow rate or pressure drop. Of course, mass flow rate and pressure drop increased with increasing cooling capacity, however, in case of big cooling capacity 1000 RT, the pressure drops of weak solution and refrigerant were enough low to transport them without pump. That is, weak solution and refrigerant can drive by the utilization of the pressure differences.
Fig.7 Pressure drop
Table 4 shows the pump power consumption of strong solution. Naturally, the pump power consumption increased with increasing cooling capacity, however, according to the results of Fig. 8, the COPH and COPE for each of the cooling capacity were almost same. This is caused by the power
consumption is very low as about 1 % compared to the cooling output. Furthermore, there is no effect of cooling capacity on COPs which were about 0.64, this means that STA may have the potential to achieve the almost same COP of the conventional absorption chiller regardless of the cooling capacity.
Table 4 Pump power consumption
Refrigerant ton (approx.)
[RT]
Pump power [kW]
1000 (3517 kW) 38.9
500 (1771 kW) 19.4
135 (478 kW) 4.8
Fig.8 Comparison between COPH and COPE
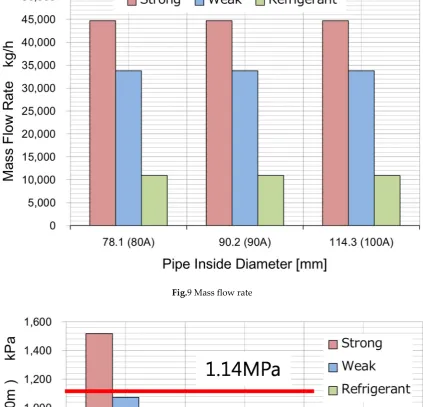
3.1.2. The Effect of Pipeline Sizes under the Cooling Output Fixed to 1000 RT
Fig.9 Mass flow rate
Fig.10 Pressure drop
Thus, we need to select pipeline size carefully to the pressure drop of the weak solution if we want to be drive by the utilization of the pressure differences.
cooling capacity were almost same as 0.64 regardless of pipeline sizes. Even limit pipeline size 80 A to transport weak solution only the pressure differences between high-pressure and low-pressure sides, the power consumption is very low as about 2 % compared to the cooling output. It will be one of advantage point of STA.
Table 5 Pump power consumption
JIS pipeline (Inner diameter)
Pump power [kW]
100 A (114.3 mm) 59.5
90 A (90.2 mm) 47.4
80 A (78.1 mm) 39.8
3.2 Dynamic Simulation
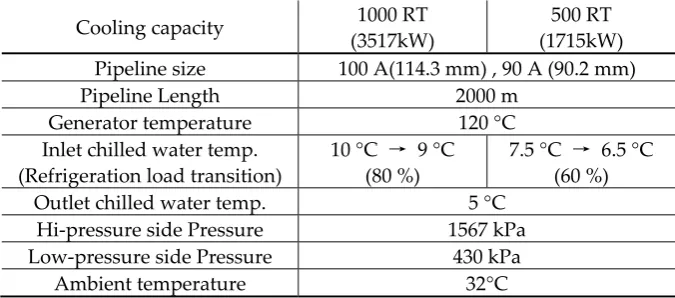
3.2.1 Dynamic Simulation Condition
Table 6 shows the dynamic simulation condition in this study. The cooling capacities were 2 conditions, 1000 RT and 500 RT, and the pipeline sizes were 100 A and 90 A. The pressure drop of weak solution on 80A was almost same as the pressure differences between high-pressure and low-pressure sides, so dynamic simulation could not work, because the mass flow rate of weak solution was sometimes higher than the static condition. So in this study, the two pipeline sizes were used.
Table 6 Dynamic simulation condition
Cooling capacity 1000 RT
(3517kW)
500 RT (1715kW)
Pipeline size 100 A(114.3 mm) , 90 A (90.2 mm)
Pipeline Length 2000 m
Generator temperature 120 °C
Inlet chilled water temp. (Refrigeration load transition)
10 °C → 9 °C (80 %)
7.5 °C → 6.5 °C (60 %)
Outlet chilled water temp. 5 °C
Hi-pressure side Pressure 1567 kPa
Low-pressure side Pressure 430 kPa
Ambient temperature 32°C
3.2.2. Effect on the Inlet Chilled Water Temperature and the Cooling Power
Figure 12 shows the changing refrigeration load point. Inlet chilled water temperatures of two cooling capacity were changed at the time 4 minute in this study, however outlet chilled water temperature was not changed. The inlet chilled water was changed from 10 °C to 9 °C on 1000 RT (refrigeration load from 100% to 80 %), and from 7.5 °C to 6.5 °C on 500 RT (refrigeration load from 100% to 60 %). In Figure 12, there was no effect of pipeline size on the temperature swing. Furthermore, the stability time of the inlet temperature was the same regardless of the cooling capacity.
Figure 13 shows the behaviour of the cooling capacity due to a change of the inlet chilled water temperature. The cooling capacity changing could be immediately observed after the inlet temperature changed. However, it is not possible to find the effects of the pipeline size in the same cooling capacity. Moreover, the times which the cooling capacity became steady state were almost same between two capacities.
3.2.3. Effect on the Mass Flow Rates
refrigerant and solutions in 100 A were somewhat larger than those of 90 A. However, for an overall tendency, there was no effect of pipeline size on the mass flow rates. Furthermore, the stability time of the mass flow rates were almost same regardless of the pipeline size and cooling capacity.
Fig.11 Comparison between COPH and COPE
Fig.12 Inlet chilled water temperature 6
7 8 9 10 11 12
0 1 2 3 4 5 6 7 8 9 10
Temperat
ure
[ ˚C ]
Time [min]
1000RT : 100A
1000RT : 90A
Fig.13 Cooling capacity
(a) Refrigirant
0 500 1000 1500 2000 2500 3000 3500 4000
0 25 50 75 100 125 150 175 200
Cooling capacity
[kW]
Time [min]
1000RT : 100A
1000RT : 90A
500RT : 100A
500RT : 90A
0 2000 4000 6000 8000 10000 12000 14000
0 25 50 75 100 125 150 175 200
Mass
flo
w
rate
[kg
/h]
Time [min]
(b) Strong solution
(c) Weak solution
Fig.14 Mass flow rate
4. Conclusion
In this study, we examined the large-scale cooling power STA on simulation. The examination cooling powers were from 90 kW (25RT) to 3517 kW(1000RT). All cooling power achieved around COP 0.64 including pump power consumptions. In addition, we performed the dynamic simulation. As the results, there was no effect of pipeline size on the cooling capacities and mass flow rates. Furthermore, the stability time of the cooling capacities and mass flow rates were almost same regardless of the pipeline size and cooling capacity. In other words, STA may be achieved the same COP even though having various complex conditions compared with the conventional absorption chiller.
Acknoledgment
This study was financially supported by NEDO, New Energy and Industrial Technology Development Organization. The authors also appreciate the cooperation of JX Nippon Oil and Energy Corporation who jointly conducts the project as a partner.
References
[1] Q. Ma, L. Luo, Z. R. Wang, G. Sauce, A review on transportation of heat energy over long distance: Exploratory development, Renewable and Sustainable Energy Reviews, 2009, 13 (6–7), pp.1532–1540. [2] A. Kaizawa, H. Kamano, A. Kawai, T. Jozuka, T. Senda, N. Maruka, N. Okinaka, T. Akiyama, Technical
feasibility study of waste heat transportation system using phase change material from industry to city, ISIJ International, 2008, 48 (4), pp. 540–548.
0 10000 20000 30000 40000 50000 60000
0 25 50 75 100 125 150 175 200
Mass
flow rate [
kg/h] Time [min] 0 5000 10000 15000 20000 25000 30000 35000 40000
0 25 50 75 100 125 150 175 200
Mass
flow rate [kg/h
]
[3] T. Nomura, N. Okinaka, T. Akiyama, Technology of latent heat storage for high temperature application: A review. ISIJ International, 50 (9) pp. 1229–1239. (2010)
[4] T. Nomura, N. Okinaka, T. Akiyama, Waste heat transportation system, using phase change material (PCM) from steelworks to chemical plant. Resources, Conservation and Recycling, 2010 54 (11), pp.1000– 1006.
[5] Sanki Engineering Co. Ltd. Homepage. www.sanki.co.jp/product/thc. 2016 (accessed June 2016) (in Japanese).
[6] H. Oguraa, Energy recycling system using chemical heat pump container. Energy Procedia. 14, pp. 2048– 2053. (2012)
[7] J. NW. Chiu, J. C. Flores, V. Martin, B. Lacarriere, Industrial surplus heat transportation for use in district heating, Energy, 2016, 110, pp. 139-147.
[8] Y.T. Kang, A. Akisawa, Y. Sambe, T. Kashiwagi, Absorption heat pump systems for solution transportation at ambient temperature STA cycle, Energy, 2000, 25(4), pp.355–370.
[9] Akisawa, F. Watanabe, Marlinda, K. Enoki, Y. Ueda, T. Takei, K. Araki, Experimental investigation of heat transportation based on absorption mechanism, Proc. of 3rd Annual International Conference on Sustainable Energy and Environmental Sciences SEES2014, Singapore, 2014
[10] F. Watanabe, K. Enoki, Marlinda, S. Tanaka, Y. Ueda, A. Akisawa, T. Takei, K. Araki, Experimental investigation of solution transportation absorption chiller in steady/non-steady state with heat transportation of 500 meters, Proc. 2014 Int. sorption Heat Pump Conference, Maryland, USA, 2014, 1051, [11] S. Tanaka, F. Watanabe, K. Enoki, A. Akisawa, Y. Ueda, T. Takei, Development of Simulation Model Based
on Experiments ofSolution Transportation Absorption Chiller with 200m, Proc. of the 2013 JSRAE Annual Conference, Saga, 2013, B112 (in Japanese)
[12] P. Lin, R. Z. Wang, Z. Z. Xia, Q. Ma, Experimental investigation on heat transportation over long distance by ammonia-water absorption cycle, Energy Conversion and Management. 50, pp. 2331–2339. (2009)