* Tel.: +44 (0)
20 8231 2466E-mail address: kourosh.behzadian@uwl.ac.uk
Water Efficiency Conference 2018
Resilience of Integrated Urban Water Systems
Kourosh Behzadian
*1, S. Jamshid Mousavi
2, Zoran Kapelan
3, Amir Alani
41
Senior Lecturer, School of Computing and Engineering, University of West London, London,
UK 2Professor, Department of Civil and Environmental Engineering, Amirkabir University of Technology (Tehran Polytechnic), Tehran, Iran 3 Professor, Centre for Water Systems, College of Engineering, Mathematics and PhysicalSciences, University of Exeter, Exeter, UK 4Professor, School of Computing and Engineering, University of West London, London, UK,
ABSTRACT
Strengthening the resilience of integrated urban water systems (UWS) comprised of water supply and sewer systems against floods and water shortages can be a challenging task. In this paper, a new set of resilience performance indicators is introduced for concurrent assessment of both failure conditions of water shortage and floods in the UWS. A number of potential intervention strategies such as rainwater harvesting (RWH) and greywater recycling (GWR) schemes for enhancement of UWS resilience are evaluated through a conceptual model of urban water metabolism assessment. Modelling of main UWS components is conducted using the WaterMet2 to simulate the performance of intervention strategies in UWS through urban water metabolism. WaterMet2 calculates key performance indicators of urban water metabolisms over a long-term planning horizon that can be used to calculate various resilience performance indicators. The demonstration of the suggested approach on a real-world case study reveals how different elements of resilience performance can be improved in the UWS by specific strategies against failure events such as flood and water shortage conditions.
Keywords: Resilience indices, urban water systems, rainwater harvesting, WaterMet
21. INTRODUCTION
The abovementioned resilience indicators has been defined and applied separately for analysis of intervention strategies implemented in either water supply systems [2, 6, 8, 9] or wastewater/stormwater systems [11, 12, 13]. However, when analysing intervention strategies that may have impact on both water supply and sewer systems (e.g. water recycling schemes), performance assessment of resilience for all components are of paramount importance. In other words, for assessment of intervention strategies in integrated urban water systems (IUWS), resilience should be analysed concurrently for both water supply and sewer systems. For example, both water shortage and flood resilience need to be enhanced simultaneously for many IUWS. Despite a plethora of research works and technical reports related to resilience in water systems, none of them has considered the resilience improvement for IUWS. Drawing upon the various available definitions of resilience, this paper aims to develop new multi-component indicators for resilience that represent a comprehensive picture of resilience in IUWS and evaluate the performance assessment of water shortage and excess runoff (flood) resilience in IUWS for a number of water recycling schemes. The multi-component resilience
indicators are estimated by using a conceptual urban water metabolism model called WaterMet2
to simulate the performance of IUWS [14]. The demonstration of the suggested approach on a real-world case study reveals how the performance of flood and water shortage resilience of IUWS can be evaluated for different strategies which will help decision makers select appropriate strategies that can lead to the resilient IUWS of interest.
2. METHODOLOGY
This study uses various concepts of resilience performance assessment of water systems to develop multi-component resilience indicators for concurrent analysis of water recycling intervention strategies that can influence both water supply and sewer systems. This approach is used for performance assessment of water shortage and flood resilience in IUWS. In this study, water shortage resilience is analysed for water supply system under population growth while flood resilience is evaluated for sewer system under standard historic climate. The
intervention options analysed here include a number of separate rainwater harvesting (RWH)
and greywater recycling (GWR) schemes implemented in IUWS. All this is analysed through an
integrated model that incorporates main components of IUWS including water supply and sewer systems. Performance assessment of these interventions in IUWS is undertaken by using the WaterMet2 model for a long-term planning horizon. Further details of multi-component resilience indicators, the IUWS model, case study and associated assumptions are presented in the next sections.
2.1 Multi-component resilience indicators
Most of the references outlined above indicate that resilience concept in urban water systems (UWS) is related to the ability of these systems to recover/return from failure conditions such as excess runoff and water shortage to a normal state. However, interpretation of researchers and practitioners are subtly variant which has led to different indicators for quantifying resilience in the IUWS. For example, some researchers have expanded flood resilience in four capacities ‘incorporating the above definition as: 1) to avoid damage; 2) to reduce damage if a flood exceeds a desired threshold; 3) to recover quickly to a normal state, and 4) to adapt to an uncertain future [3]. In other words, this implies that resilient cities are less vulnerable and more resistance against extreme flood events. The same definition can be extended for water shortage resilience.
fully met in water supply system or runoff exceeds the sewer capacity in sewer system. It should also be noted that the indicators analysed in this study cannot be exhaustive measuring all aspects of resilience and other resilience indicators can be developed based on social, technical, and socio-technical frameworks of water systems [5,10].
Table 1. Multi-component resilience indicators in UWS
No Name Water supply system Sewer system Ref.
1 Min recovery rate
1 𝑀𝑎𝑥 𝑇𝐹
where Max TF = the longest failure duration i.e. time period that water demand is not fully delivered
1 𝑀𝑎𝑥 𝑇𝐹
where Max TF = the longest failure duration i.e.
time period that runoff exceeds sewer capacity
[9,10]
2 Average recovery rate
1 𝐴𝑣𝑒(𝑇𝐹)
where Ave (TF)= average failure duration as above over the planning horizon
1 𝐴𝑣𝑒(𝑇𝐹)
where Ave (TF)= average failure duration as above over the planning horizon
[2,4,6,9,10]
3 Max
Severity 𝑀𝑎𝑥 (
𝐷𝑖− 𝑆𝑖
𝐷𝑖 ) × 100
𝑖𝑓 𝐷𝑖> 𝑆𝑖
where Si = water supply at time step i and Di = water demand at time step i
𝑀𝑎𝑥 (𝑅𝑖− 𝐶𝑖
𝐶𝑖 ) × 100
𝑖𝑓 𝑅𝑖> 𝐶𝑖
where Ri=runoff generated at time step i and Ci= conveyance
capacity at time step i
[6,10]
4 Average
severity 𝐴𝑣𝑒 (
𝐷𝑖− 𝑆𝑖
𝐷𝑖 ) × 100
𝑖𝑓 𝐷𝑖> 𝑆𝑖
as above where average water deficit over the planning horizon is calculated.
𝐴𝑣𝑒 (𝑅𝑖− 𝐶𝑖
𝐶𝑖 ) × 100
𝑖𝑓 𝑅𝑖> 𝐶𝑖
as above where average excess runoff over the planning horizon is calculated. [8,10] 5 Max volumetric severity 𝑀𝑎𝑥 (∑(𝐷∑ 𝐷𝑖− 𝑆𝑖)
𝑖 ) × 100
𝑖𝑓 𝐷𝑖> 𝑆𝑖
as above where the largest consecutive water deficit is calculated.
𝑀𝑎𝑥 (∑(𝑅∑ 𝐶𝑖− 𝐶𝑖)
𝑖 ) × 100
𝑖𝑓 𝑅𝑖> 𝐶𝑖
as above where the largest consecutive excess runoff is calculated.
[6]
6 Average volumetric severity
𝐴𝑣𝑒 (∑(𝐷∑ 𝐷𝑖− 𝑆𝑖)
𝑖 ) × 100
𝑖𝑓 𝐷𝑖> 𝑆𝑖
as above where the average consecutive water deficit over the planning horizon is calculated.
𝐴𝑣𝑒 (∑(𝑅∑ 𝐶𝑖− 𝐶𝑖)
𝑖 ) × 100
𝑖𝑓 𝑅𝑖> 𝐶𝑖
as above where the average consecutive excess runoff over the planning horizon is calculated.
[6]
All indicators in Table 1 can be calculated by using the time series of water flows in IUWS over its design life. For water supply, required flows include water demand and supply with some periods of water shortage to properly evaluate resilience as the system should be subject to exceptional conditions [5]. The water shortage can be due to either limiting water resources or population growth. For sewer system, the flows required for calculation of resilience indicators are 1) runoff generated in urban areas as a result of rainfall-runoff modelling; 2) conveyance capacity of sewer system. Time series of these basic flows are obtained here from simulation of urban water metabolism performance in IUWS. This is undertaken through WaterMet2 model which is outlines below.
2.2 Urban water metabolism model
WaterMet2 used here as the urban water metabolism model is a conceptual and mass-balanced-based model for simulation of the performance of IUWS over a long-term planning horizon [14]. The WaterMet2 model with daily time step tracks down different flows and fluxes (e.g. water, energy, greenhouse gas emissions and materials) within IUWS. WaterMet2 tracks down water flows both in water supply system from water resources up to water demand profiles and in sewer system from collecting stormwater/wastewater to discharging to receiving water bodies. WaterMet2 adopts a simplified but distributed approach for conceptual modelling of the main physical UWS components in the main infrastructures of water supply and wastewater including separate/combined sewer networks. WaterMet2 inherited the mass-balanced and distributed modelling approach from some tools such as UVQ [15] and combined it with industrial ecology based modelling approach. All this enables WaterMet2 to simulate water recycling interventions such as RWH and GWR in which collected rainwater (in RWH) and greywater (in GWR) can be used in water supply system for water demand profiles. WaterMet2 tracks down daily time series of water demands delivered to customers and runoff generated and excess stormwater overflowed in sewer system over a long-term (e.g. 20-40 years) horizon. These time-series can be used as the basis for calculating different resilience indicators described above. Note that failure durations (e.g. periods that demand is less than supply) lower than the smallest time step of the WaterMet2 simulation model (i.e. daily) cannot be captured in this study.
3 Case study
3.1 Description
Table 2 Input data related to water demands and runoff modelling
Parameter description Value Parameter description Value
Proportion of roof surface areas 9% Number of households 160,000 Proportion pavement and road surface
areas 7% Total area of surfaces 8450 ha
Proportion of permeable surface areas 84% Average occupancy per
household 2.35
Runoff coefficient of impermeable
surface areas 95% Indoor water demand
180
L/day/capita Infiltration coefficient for permeable
surface areas 30% Industrial water demand 27.4 ML/day
Annual average rainfall depth 803 mm
Household garden
watering demand 31.75 ML/day
Based on the recommendations for conventional design, the tank capacities of the household RWH schemes are set equal to 3m3 [16]. The RWH scheme is assumed to collect runoff from roofs, roads and pavements and to supply water for toilet flushing, garden watering and industrial usages. Assuming adoption rate of the RWH scheme of 50% by the households, the IUWS is analysed for four design capacities of RWH. Each design capacity is considered as a percentage of conventional design capacity of RWH outlined above. They include: 1) 10% of full capacity, i.e. 0.048 million cubic metres (MCM) (i.e. 0.1×160,000×3×10-6); 2) 25% of full capacity, i.e. 0.12 MCM; 3) 50% of full capacity i.e. 0.24 MCM and 4) full (100%) capacity i.e. 0.48 MCM. The GWR scheme is assumed to collect greywater (i.e. from the hand basin, dishwasher, shower, washing machine and frost tapping) and treated greywater is used for the provision of toilet flushing, household garden watering and industrial uses. Similarly, a single representative GWR scheme assuming 50% of household adopting this scheme is analysed for the following capacities (similar to RWH as percentage to conventional design capacity): 1) 9,750 m3; 2) 19,500 m3; 3) 39,000 m3 and 4) 78,000 m3.
3.2. Results and Discussion
The IUWS is first modelled by WaterMet2 and calibrated by historic measurement data in water supply and sewer systems [14]. Then, it is simulated for the BAU state for a period of 30 years with daily time step and highest rate of population growth. Due to increasing water demand over the planning horizon and limited water resources, water supply system in the BAU encounters unmet water demand which is rather small in the first years but increases up to 27% water deficit towards the end of the planning horizon. Sewer system under historic rainfall data also encounters excess runoff over the planning horizon. Following this, the two water recycling intervention strategies (RWH and GWR) with different capacities outlined above are simulated and all resilience indicators introduced here are calculated and compared in Figs. 1 and 2.
(0.078MCM) for water supply and sewer systems. The best minimum recovery rate for water supply system is GWR strategy with capacity of 0.078MCM which is able to reduce the largest failure duration from 4421 days in BAU to 336 days. It should be noted that this reduced failure duration (i.e. 336 days) cannot be acceptable in practice and hence other measures need to be added to this strategy. The next most resilient strategy with respect to this indicator is RWH strategies (0.24MCM and 0.48MCM) with 539 days of demand failure. However, when comparing the average recovery rate, RWH strategies (0.24MCM and 0.48MCM) with average 20 days of demand failure are the most resilient ones (compared with 71 days of the BAU) followed by strategies of GWR (0.078MCM) and RWH (0.12MCM) with 21 days of failure duration. This indicates most of RWH strategies with enough capacities generally outperform GWR strategies in water supply system. On the other hand, improvement of resilience performance of recovery rate in sewer system is modest in all analysed strategies relative to the BAU. This is observed in the reduction of maximum failure duration of excess runoff by 1 or 2 days only compared to 10 days of failure duration in the BAU (i.e. 0.1 recovery rate) and only less than 0.1 days in reduction of average failure duration. Such a trivial improvement can be linked to the fact that this maximum failure duration only happens in the late periods of the analysing period when the highest population reaches in UWS. This shows temporally appropriate and additional interventions should be taken for that period to substantially reduce such large resilience failures.
Fig. 1. Recovery rate resilience indicators of different strategies: (1) BAU; (2) RWH(0.048MCM); (3) RWH(0.12MCM); (4) RWH(0.24MCM); (5) RWH(0.48MCM); (6) GWR(0.00975MCM); (7) GWR(0.0195MCM); (8) GWR(0.039MCM); (9) GWR(0.078MCM).
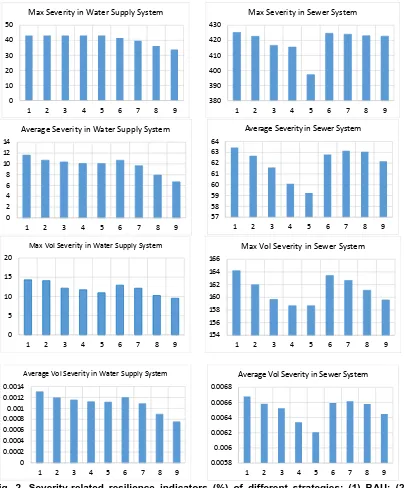
Fig. 2 shows the performance of strategies for resilience indicators that minimise IUWS failure magnitude (severity). All water recycling strategies have a relatively small impact on improvement of max severity in water supply system (up to 21% reduction for GWR strategy with 0.078MCM) compared to more considerable impact on average severity (up to 43% for the same strategy, i.e. GWR with 0.078MCM). Whilst GWR strategy with 0.078 MCM (#9) is the most resilient one with respect to maximum and average severity in water supply system, the best resilience in sewer system based on the same indicators is RWH strategy with 0.48MCM (#5). The same trends are in place between strategies for resilience based on maximum and average volume severity. In other words, performance of RWH strategies in this study seems
0 0.0005 0.001 0.0015 0.002 0.0025 0.003 0.0035
1 2 3 4 5 6 7 8 9
Min Recovery Rate in Water Supply System
0 0.02 0.04 0.06 0.08 0.1 0.12 0.14
1 2 3 4 5 6 7 8 9
Min Recovery Rate in Sewer System
0 0.01 0.02 0.03 0.04 0.05 0.06
1 2 3 4 5 6 7 8 9
Average Recovery Rate in Water Supply System
0.51 0.515 0.52 0.525 0.53 0.535 0.54 0.545 0.55
1 2 3 4 5 6 7 8 9
to outperform GWR ones for reduction in all aspects of failure magnitude (severity) in sewer system while GWR strategies have relatively better performance in water supply system. It should also be noted that these strategies per se are unable to achieve sustainable IWUS with respect to resilience indicators without having new interventions in appropriate times.
Fig. 2. Severity-related resilience indicators (%) of different strategies: (1) BAU; (2) RWH(0.048MCM); (3) RWH(0.12MCM); (4) RWH(0.24MCM); (5) RWH(0.48MCM); (6) GWR(0.00975MCM); (7) GWR(0.0195MCM); (8) GWR(0.039MCM); (9) GWR(0.078MCM).
Figs. 3 and 4 show the daily variations between runoff generated and capacity of sewer system over the first five years (Fig. 3) and between water demand and supply over the simulation period (Fig. 4) in three strategies including BAU, RWH with 0.48MCM and GWR with 0.078MCM. By comparing the runoff generated in water recycling strategies, it is evident that the RWH strategy can absorb more runoff due to its larger capacity relative to the GWR strategy that reduces sanitary sewage discharge into combined sewer system. This enables the RWH strategy to withstand some small excess runoff events that normally occur in the BAU. It should
0 10 20 30 40 50
1 2 3 4 5 6 7 8 9
Max Severity in Water Supply System
380 390 400 410 420 430
1 2 3 4 5 6 7 8 9
Max Severity in Sewer System
0 2 4 6 8 10 12 14
1 2 3 4 5 6 7 8 9
Average Severity in Water Supply System
57 58 59 60 61 62 63 64
1 2 3 4 5 6 7 8 9
Average Severity in Sewer System
0 5 10 15 20
1 2 3 4 5 6 7 8 9
Max Vol Severity in Water Supply System
154 156 158 160 162 164 166
1 2 3 4 5 6 7 8 9
Max Vol Severity in Sewer System
0 0.0002 0.0004 0.0006 0.0008 0.001 0.0012 0.0014
1 2 3 4 5 6 7 8 9
Average Vol Severity in Water Supply System
0.0058 0.006 0.0062 0.0064 0.0066 0.0068
1 2 3 4 5 6 7 8 9
be noted that the conveyance capacity of sewer system is defined here as a function of available volume (V) i.e. Q=a×Vb [14] and hence conveyance capacity at each time step is variable depending on the water volume in sewer system at that time step. Generally, the daily conveyance capacity is reduced after a rainy day as it is part full. Other potential interventions to increase the resilience of sewer system can be suggested as adding on-line and off-line storage capacity to the sewer system. In addition, comparing water recycling strategies with the BAU for water demand/supply variations show that the GWR strategy is able to better resist small shocks of unmet demand in early years and reduce the failure magnitude during large shocks towards the end of the planning horizon. This can be due to the fact that periods of collected rainwater (i.e. rainy season) do not exactly match the periods of unmet demand (i.e. dry season) although the capacity of the RWH strategy is much larger than that in the GWR strategy.
Fig. 3. Variations of runoff generated and conveyance capacity of sewer system over the first five years in three strategies of BAU (upper graph), RWH with 0.48 MCM capacity (middle graph) and GWR with 0.078 MCM (lower graph)
Fig. 4. Variations of water demand and supply over the analysing period in three strategies of BAU (upper graph), RWH with 0.48 MCM capacity (middle graph) and GWR with 0.078 MCM (lower graph)
0 200 400 600 800 1000 1200 1400 1600 1800 2000
0 1 2 3 4 5 6x 10
6 Time (day) R u n o ff /C ap ac it y ( m 3/d ay )
0 200 400 600 800 1000 1200 1400 1600 1800 2000
0 1 2 3 4 5 6x 10
6 Time (day) R u n o ff /C ap ac it y ( m 3/d ay )
0 200 400 600 800 1000 1200 1400 1600 1800 2000
0 1 2 3 4 5 6x 10
6 Time (day) R u n o ff /C ap ac it y ( m 3/d ay )
Runoff generated in the BAU Strategy Conveyance Capacity of Sewer System
Runoff generated in the RWH(0.48MCM) Strategy Conveyance Capacity of Sewer System
Runoff generated in the GWR(0.078MCM) Strategy Conveyance Capacity of Sewer System
0 1000 2000 3000 4000 5000 6000 7000 8000 9000 10000
1 2 3 4 5x 10
5 Time (day) D em an d /S u p p ly ( m 3/d ay )
0 1000 2000 3000 4000 5000 6000 7000 8000 9000 10000
1 2 3 4 5x 10
5 Time (day) D em an d /S u p p ly ( m 3/d ay )
0 1000 2000 3000 4000 5000 6000 7000 8000 9000 10000
1 2 3 4 5x 10
5 Time (day) D em an d /S u p p ly ( m 3/d ay )
Demand in Water Supply System Supply in the BAU Strategy
Demand in Water Supply System Supply in the RWH (0.48MCM) Strategy
When comparing these results and discussion in Figs. 1 and 2, it can be concluded that no unique water recycling strategy can be found as the best resilience performance for reduction in both duration and magnitude of failure in this case study. This has also been highlighted by Butler (2016) who noted that there is no single best approach for all situations of resilience [17]. As a result, for selection of a new strategy based on resilience-based performance criteria, all resilience definitions need to be addressed and estimated for concerning systems and improvement of resilience indicators of interest should be analysed based on the preferences of stakeholders and decision makers.
In addition to resilience performance, other aspects of the sustainability framework in water systems (e.g. economic and environmental) should be considered for decision making when analysing intervention strategies. For example, the above analyses show that GWR strategies outperform RWH strategies in water supply system with respect to failure magnitude, while GWR schemes per se use over three time more energy than RWH schemes [14] which can be less environmentally favourable solution due to increased greenhouse gas (GHG) emissions. This conclusion although needs a more comprehensive assessment (e.g. by using urban water metabolism framework) due to less energy used in other components (e.g. water supply or wastewater systems). Furthermore, one key aspect of decision making for a new strategy is the cost-effectiveness of the most resilient strategy. For example, in some of results discussed above, RWH strategy with 0.48MCM was the most resilient strategy with no or trivial difference for improvement of flood resilience when compared with RWH strategy with 0.24MCM. This little difference may play a prominent role when halving total capital investment for developing RWH schemes is important for stakeholders. The capacity of RWH schemes can also be reduced while maintaining the same performance of flood resilience by making RWH schemes smarter in which they can empty the storage tank well in-advance before following rainfalls [18].
4. CONCLUSION
Different aspects of IUWS resilience (i.e. system failure magnitude and duration [5]) were analysed here. Twelve resilience indicators were proposed for concurrent analysis of water supply and sewer systems to address both water excess (floods) and water shortage failure conditions. Urban water metabolism model was used to evaluate a number of water recycling intervention strategies (RWH and GWR) for resilience analysis. The results obtained on a case study of a Northern European city show that, there is no single best intervention solution that can reduce both failure duration and magnitude in water supply and sewer systems. For example, failure magnitude of excess runoff can be minimised using the RWH based strategies but failure duration of excess runoff is minimised using the other, GWR based strategies. Also, performance of intervention strategies for different severity-based resilience indicators seems to be relatively similar. Finally, other assessment criteria (e.g. economic and environmental) should also be included when selecting the new intervention strategies. The findings presented here are limited to the case study analysed in this paper and their generalisation requires further application to other case studies.
REFERENCES
1. Hamill, L. Understanding hydraulics. Palgrave Macmillan, 2011.
2. Hashimoto T, Stedinger JR, Loucks DP. Reliability, resiliency, and vulnerability criteria for water resource system performance evaluation. Water resources research 1982; 18(1): 14-20. 3. Hammond MJ, Chen AS, Djordjević S, Butler D, Mark O. Urban flood impact assessment: A state-of-the-art review. Urban Water Journal, 2015; 12(1): 14-29.
4. Loucks, D.P., Van Beek E., Stedinger J.R., Dijkman J.P., Villars M.T., Water resources
systems planning and management: an introduction to methods, models and applications,
UNESCO, 2005.
6. Huizar, L. H., Lansey, K. E., & Arnold, R. G. Sustainability, robustness, and resilience metrics
for water and other infrastructure systems. Sustainable and Resilient Infrastructure, 2018; 3(1):
16-35.
7. Miller, F., Osbahr, H., Boyd, E., Thomalla, F., Bharwani, S., Ziervogel, G.,Walker, B., Birkmann, J., van der Leeuw, S., Rockstroem, J., Hinkel, J., Downing, T., Folke, C., Nelson, D.
Resilience and vulnerability: complementary or conflicting concepts? Ecol. Soc. 2010; 15(3).
8. Diao, K., Sweetapple, C., Farmani, R., Fu, G., Ward, S., & Butler, D. Global resilience analysis of water distribution systems. Water research, 2016; 106: 383-393.
9. Behzadian, K., Kapelan, Z., & Morley, M. S. Resilience-based performance assessment of water-recycling schemes in urban water systems. Procedia Engineering, 2014, 89: 719-726. 10. Roach, T., Kapelan, Z., and LedBEtter R. Resilience-Based Performance Metrics for Water Resources Management under Uncertainty. Advances in Water Resources 2018; 116:18–28. 11. Behzadian, K., and Kapelan, Z. Advantages of integrated and sustainability based assessment for metabolism based strategic planning of urban water systems. Science of the total environment 2015; 527: 220-231.
12. Mugume, S.N., Gomez, D.E., Fu, G. Farmani, R. and Butler, D. A global analysis approach for investigating structural resilience in urban drainage systems. Water research, 2015; 81: 15-26.
13. Juan-García, P., Butler, D., Comas, J., Darch, G., Sweetapple, C., Thornton, A. and Corominas, L. Resilience theory incorporated into urban wastewater systems management. State of the art. Water research, 2017; 115: 149-161.
14. Behzadian K., Kapelan Z. Modelling metabolism based performance of an urban water system using WaterMet2. Resources, Conservation and Recycling, 2015; 99: 84-99.
15. Mitchell VG, Diaper C. UVQ user manual: urban water balance and contaminant balance
analysis tool, Version 1.2, CMIT Report No. 2005-282 CSIRO, 2010.
16. BSI BS 8515:2009+A1:2013 Rainwater Harvesting Systems - Code of Practice. BSI, London, 2013.
17. Butler D., Keynote: Resilience: Hype or Hope, Strategies for 2020 and beyond, Water
Frontiers, 4th Annual Water Efficiency Conference, 7-9 September, 2016, Coventry, UK
18. Behzadian, K., Kapelan, Z., Mousavi, S.J. and Alani, A. Can smart rainwater harvesting
schemes result in the improved performance of integrated urban water