http://www.sciencepublishinggroup.com/j/mcs doi: 10.11648/j.mcs.20190406.11
ISSN: 2575-6036 (Print); ISSN: 2575-6028 (Online)
EMG Signal Processing and Application Based on
Empirical Mode Decomposition
Xu Mengying, Yang Xiaoli, Xu Chenli, Yang Bin
School of Medical Technology and Engineering, Henan University of Science and Technology, Luoyang, China
Email address:
To cite this article:
Xu Mengying, Yang Xiaoli, Xu Chenli, Yang Bin. EMG Signal Processing and Application Based on Empirical Mode Decomposition. Mathematics and Computer Science. Vol. 4, No. 6, 2019, pp. 99-103. doi: 10.11648/j.mcs.20190406.11
Received: October 10, 2019; Accepted: November 22, 2019; Published: December 6, 2019
Abstract:
With the development of rehabilitation medicine and kinematics, the study of Electromyographic (EMG) signal come into people’s sight. The information obtained from the surface EMG signals can not only reflect the motion state of muscles and joints, but also judge people's motion type, which is one of the important indexes in the study of human body. Based on the EMG as the research object with the detailed analysis to understand the EMG of time domain, frequency domain and SNR, etc. The study of EMG signal denoising and feature extraction is of great value and significance in the field of medical diagnosis. Such as using sEMG signals to assess muscle status and determine postoperative recovery status. Empirical Mode Decomposition (EMD) based on hilbert-huang is a time frequency analysis method for non-linear and non-stationary signals like EMG signals, which has unique advantages and broad prospects in signal analysis and processing. In this paper, we used EMD to decompose signal which contain multiple frequency component into a series of inherent modal parameters, and then combine the method of EMD decomposition and wavelet transform to carry out denoising processing and feature extraction for EMG signals, which can effectively weaken the noise of surface EMG signals and reflect the essential characteristics of the original signal, and classify the damage of EMG signals by analyzing the characteristic values.Keywords:
EMG, Wavelet Transform, EMD1. Empirical Mode Decomposition
Empirical Mode Decomposition (EMD) [1] based on hilbert-huang is a time-frequency analysis and processing method for non-linear and non-stationary signals like EMG signals. The complex signal can be decomposed into a finite number of Intrinsic Mode Function (IMF) and a residual term. Each IMF component undergoes a Hilbert transform, and the instantaneous frequency and amplitude of the signal can be obtained, thereby obtaining time and frequency. The amplitude of the three-dimensional Hilbert time spectrum provides clearer local detail time-frequency features. The HHT method is more suitable for processing nonlinear and non-stationary signals because of its advantages of simplicity, high efficiency, strong adaptability, and high time-frequency resolution [2].
Once proposed, EMD method has been rapidly and effectively applied in different engineering fields, especially in the aspect of signal analysis and processing with unique advantages and broad prospects. Denoising and feature
extraction of IMF components obtained from the original EMD signal can effectively weaken the noise components in SEMG and reflect the essential characteristics of the original signal [3, 4].
Paper [5] studies the relationship between electromyography and carpal tunnel syndrome of median nerve. It can diagnose the degree of median nerve injury at the carpal tunnel. In the paper [6], the sEMG amplitude of the tested muscles means that agonist muscle activity changed relative to antagonistic muscle activity. In the paper [7], sEMG signals can estimated the intended movement information of the robot’s.
waveforms and the mutual influence is difficult to distinguish.
In view of the phenomenon of mode aliasing in empirical mode decomposition [8], this paper proposes de-noising and feature extraction of EMG signals by combining empirical mode decomposition and wavelet transform.
2. De-noising of EMG Signal
2.1. EMG Signal Denoising Based on Empirical Mode Decomposition
Surface Electromyographic signal (SEMG), is a comprehensive effect of superficial muscle signal and nerve trunk electrical activity on the skin surface. SEMG can reflect neuromuscular activity, muscle system function and state. SEMG has the advantages of invasive, non-invasive, and simple operation. Therefore, the method of detecting surface defects using surface electromyography signals is important in the fields of clinical medicine, rehabilitation medicine, sports medicine, sports biology and prosthetic control. But EMG signals is weak, the acquired EMG signals usually contain a lot of noise.
Traditional noise reduction methods such as low-pass filtering and wavelet threshold denoising are limited by the signal statistical characteristics, it is difficult to achieve the best combination of noise reduction and signal detail loss. For example, the multi-resolution analysis of wavelet transform is realized by mother wavelet expansion and translation, and then, the inner product with the signal to obtain the wavelet components of the signal at different scales. Therefore, the localization ability of the wavelet transform is based on the wavelet basis function. It is difficult to determine the wavelet function based on the local characteristics of the signal.
Empirical Mode Decomposition can adaptively reduce noise and is effective for stationary and non-stationary signals denoising [9].
2.2. Load EMG Signal
Since the analog signals used in the simulation are pure signals from the database, noise needs to be added to the EMG signals before. In this design, 50HZ power frequency interference and 500Hz ECG signal are added to the EMG signal as interference sources. Noise model as
Noise=0.2×sin (2×pi×50×) (1)
In the process of programming, the Downsample function was used to the EMG sampling frequency at the same frequence as the ECG, meanwhile, seting the same sample frequency for the sine signal. The combination of ECG and sinusoidal signal with EMG is simulated signal when EMG is interfered by ECG and power frequency interference.
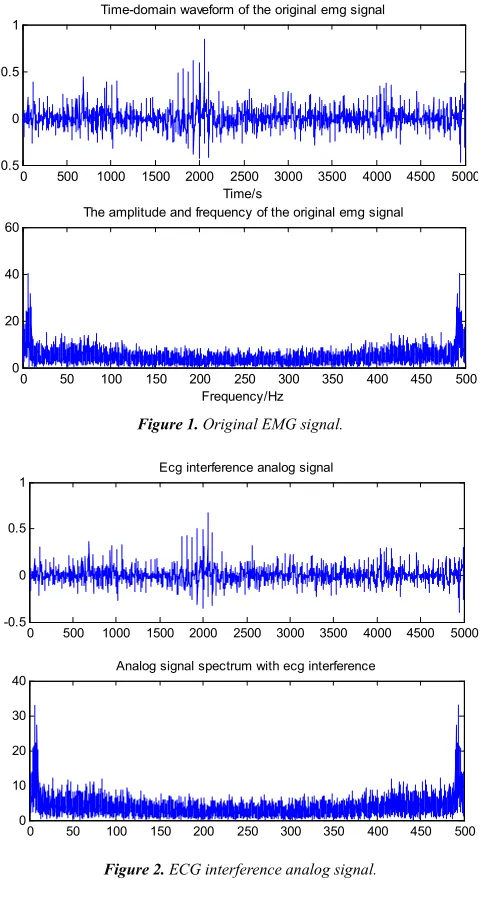
Figure 1. Original EMG signal.
Figure 2. ECG interference analog signal.
Figure 3. Power frequency interference analog signal.
Figure 1 is original EMG singal in Time domain and
0 500 1000 1500 2000 2500 3000 3500 4000 4500 5000
-0.5 0 0.5 1
Time-domain waveform of the original emg signal
Time/s
0 50 100 150 200 250 300 350 400 450 500
0 20 40 60
The amplitude and frequency of the original emg signal
Frequency/Hz
0 500 1000 1500 2000 2500 3000 3500 4000 4500 5000
-0.5 0 0.5 1
Ecg interference analog signal
0 50 100 150 200 250 300 350 400 450 500
0 10 20 30 40
Analog signal spectrum with ecg interference
0 500 1000 1500 2000 2500 3000 3500 4000 4500 5000
-1 -0.5 0 0.5 1
Time domain waveform diagram of analog signal with power frequency interference
0 50 100 150 200 250 300 350 400 450 500
0 200 400 600
Frequency/Hz
A
m
p
lit
u
d
e
/d
B
Frequency domain. The ECG interference analog signal and Power frequency interference analog signal are shown in Figure 2 and Figure 3.
2.3. EMG Signal Denosing
Design defines a "EMD" function, this function is called after the original EMG signal and noise is obtained the EMG signal component of the IMF, and draw the corresponding waveform and spectrum graph.
Figure 4, figure 5 is component of original EMG siginal FFT transform. it can be see that the main energe of EMG is concentrated in the IMF1, IMF2, IMF3 and IMF4 components, and the less the energy back, which is indicates that our subsequent de-noising problem mainly analyzes the first four components [12].
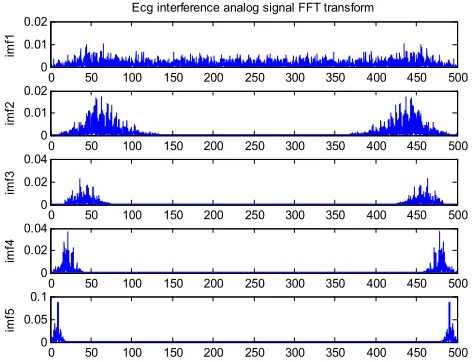
Figure 6, figure 7 is component of ECG interference analog signal FFT transform, it can be see that the main energy of power frequency interference mainly exists in the components of IMF3, IMF4 and IMF5. These three components are removed, and other components are added together to obtain the EMG after de-noising.
Figure 4. Original EMG signal FFT transform (imf1-imf5).
Figure 5. Original EMG signal FFT transform (imf6-imf9).
Figure 6. ECG interference analog signal FFT transform (imf1-imf5).
Figure 7. ECG interference analog signal FFT transform (imf6-imf9).
Figure 8. Power frequency interference analog signal FFT transform (imf1-imf5).
Figure 8, figure 9 is component of Power frequency interference analog signal FFT transform which illustrates the main energy of the power frequency interference mainly exists in IMF1 and IMF2 component.
0 50 100 150 200 250 300 350 400 450 500
0 0.02 0.04
Primary emg signal FFT transform
im
f1
0 50 100 150 200 250 300 350 400 450 500
0 0.05 0.1
im
f2
0 50 100 150 200 250 300 350 400 450 500
0 0.05 0.1
im
f3
0 50 100 150 200 250 300 350 400 450 500
0 0.02 0.04
im
f4
0 50 100 150 200 250 300 350 400 450 500
0 0.2 0.4
im
f5
0 50 100 150 200 250 300 350 400 450 500
0 0.05 0.1
im
f6
0 50 100 150 200 250 300 350 400 450 500
0 0.05 0.1
im
f7
0 50 100 150 200 250 300 350 400 450 500
0 0.05 0.1
im
f8
0 50 100 150 200 250 300 350 400 450 500
0 0.01 0.02
im
f9
0 50 100 150 200 250 300 350 400 450 500
0 0.01 0.02
Ecg interference analog signal FFT transform
im
f1
0 50 100 150 200 250 300 350 400 450 500
0 0.01 0.02
im
f2
0 50 100 150 200 250 300 350 400 450 500
0 0.02 0.04
im
f3
0 50 100 150 200 250 300 350 400 450 500
0 0.02 0.04
im
f4
0 50 100 150 200 250 300 350 400 450 500
0 0.05 0.1
im
f5
0 50 100 150 200 250 300 350 400 450 500
0 0.05 0.1
im
f6
0 50 100 150 200 250 300 350 400 450 500
0 0.02 0.04
im
f7
0 50 100 150 200 250 300 350 400 450 500
0 0.02 0.04
im
f8
0 50 100 150 200 250 300 350 400 450 500
0 0.02 0.04
im
f9
0 50 100 150 200 250 300 350 400 450 500
0 10 20
analog signal with power frequency interference FFT transform
im
f1
0 50 100 150 200 250 300 350 400 450 500
0 10 20
im
f2
0 50 100 150 200 250 300 350 400 450 500
0 0.1 0.2
im
f3
0 50 100 150 200 250 300 350 400 450 500
0 0.2 0.4
im
f4
0 50 100 150 200 250 300 350 400 450 500
0 0.1 0.2
im
Figure 9. Power frequency interference analog signal FFT transform (imf6-imf9).
Table 1. Denoising results based on EMD.
Analog signal Signal-to-noise ratio
(SNR)/dB
Analog signals with ecg interference 0.9941
EMG signal without ECG interference 1.5528
Analog signal of Power frequency interference 0.2410 Analog signal of Power frequency interference 0.7316
This paper compares and analyzes that power frequency interference mainly exists in the IMF1 and IMF2 component, part of the two component using FIR to deal with the noise rejector, after processing of components with other accumulation after denoising the EMG signal; ECG interference mainly exists in IMF1, IMF2, IMF3 and IMF4. These components are removed, and other components are added together to obtain the denoised EMG signal. Moreover, since the main energy of EMG signal exists in
IMF1, IMF2, IMF3 and IMF4 components, signal distortion is caused by direct processing of these components.
2.4. EMG Signal Denoising Based on Empirical Mode Decomposition and Wavelet Transform
Because the ECG signal and EMG signal main energy superposition, remove the first and second component containing noise more directly lead to filter out the main effective energy, just remove the third and the fourth component, the denoising effect is not obvious, we bold attempt, based on the EMD decomposition, more energy to contain noise of the first and second IMF component wavelet threshold denoising, respectively.
Table 2. Wavelet threshold denoising results based on EMD.
Analog signal Signal-to-noise ratio
(SNR)/dB
Analog signals with ECG interference 0.6279
EMG signal without ECG interference 1.5052
Analog signal of Power frequency interference 0.2410 Analog signal of Power frequency interference 1.9275
3. Feature Extraction
There are many methods of EMG signal feature extraction, which can be summarized into four categories: time-domain analysis method, frequency-domain analysis method, time-frequency analysis method and nonlinear dynamics method. This paper mainly analyzes the time domain features [8], frequency domain features and emd-based wavelet entropy [9].
Healthy EMG signals, Myopathy EMG signals and neuropathy EMG signals were extracted based on the time domain and frequency domain. Three types of signals were distinguished by analyzing the characteristic values:
Table 3. Analysis of feature extraction results in time domain and frequency domain (imf1-imf5).
Imf1 Imf2 Imf3 Imf4 Imf5
Healthy EMG 2.7536 2.0904 1.533 0.9757 0.2521
Myopathy EMG 2.7286 2.2531 1.6488 1.0784 0.4363
Neuropathy EMG 2.5397 2.1579 1.7586 1.1411 0.8697
Table 4. Analysis of feature extraction results in time domain and frequency domain (imf6-imf9).
Imf6 Imf7 Imf8 Imf9
Healthy EMG 0.042 0.0013 0.000024092 0.000011433
Myopathy EMG 0.0339 0.0012 0.000027052 0.000027052
Neuropathy EMG 0.2132 0.0161 0.00077206 0.00011924
As can be seen from the data in the table, the time domain method and frequency domain method can only judge the neuropathy EMG signals, but it is difficult to distinguish the healthy EMG signals and myopathy EMG signals.
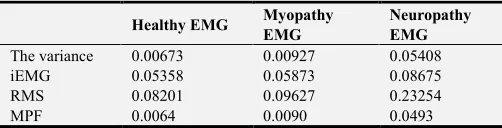
Secondly, empirical mode decomposition was performed on healthy EMG signals, EMG signals with myogenic injury and EMG signals with neurogenic injury, and wavelet entropy was calculated for IMF components, as shown in the following table.
Table 5. Analysis of wavelet entropy feature extraction results based on EMD.
Healthy EMG Myopathy
EMG
Neuropathy EMG
The variance 0.00673 0.00927 0.05408
iEMG 0.05358 0.05873 0.08675
RMS 0.08201 0.09627 0.23254
MPF 0.0064 0.0090 0.0493
0 50 100 150 200 250 300 350 400 450 500
0 0.2 0.4
im
f6
0 50 100 150 200 250 300 350 400 450 500
0 0.02 0.04
im
f7
0 50 100 150 200 250 300 350 400 450 500
0 0.2 0.4
im
f8
0 50 100 150 200 250 300 350 400 450 500
0 1 2
im
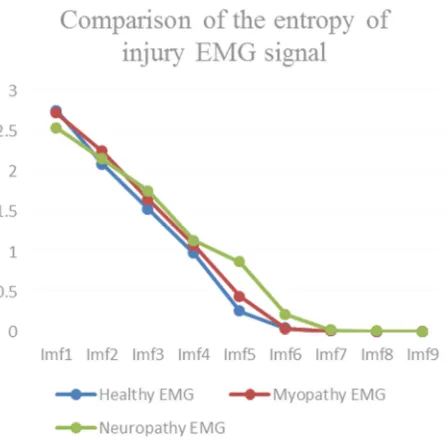
Figure 10. Comparison of the entropy of injury EMG signal.
According to the broken line diagram, it is easy to distinguish healthy EMG signals, myopathy EMG signals and neuropathy EMG signals by comparing the entropy values of imf4, imf5 and imf6.
4. Conclusion
Based on the empirical mode decomposition method is studied in this paper the EMG signal denoising processing and feature extraction, based on the modal in the empirical mode decomposition aliasing problems, put forward based on empirical mode decomposition and wavelet transform method, the IMF componenats with the main noise energy is treated with a four-layer hard threshold using the wavelet analysis threshold method, not only optimize the denoising effect, greatly has kept the authenticity and completeness of the EMG signal, in the feature extraction, based on empirical mode decomposition of the wavelet entropy can reflect well the normal EMG and muscle EMG signal source sex injury and the features of neurogenic damage EMG signal by comparing imf4, imf5, imf6 component such as entropy, to distinguish three types of EMG signal [14].
In summary, the HHT method overcomes some shortcomings of the traditional time-frequency analysis method, and has good results for the denoising and feature extraction of non-stationary signals. The results obtained by the algorithm in this paper can be applied to sports medicine and rehabilitation medicine.
Acknowledgements
This work is supported by Research Technology of Indoor Mobile Intelligent Robot which from China-rok Cooperation Project of HeNan Provincial Department of Science and Dechnology and the 2010 HeNan province SRTP project
"Fatigue dection of EMG signal based on Wavelet Transform".
References
[1] Huang N E, Shen Z, Long S, et al. The empirical mode decomposition and the Hilbert spectrum for nonlinear and non -stationary time series analysis. Proceedings of the Royal Society of London, 454: 903-995 (1998).
[2] Feng Hongwu, Wang Jianchang. Application Research of Hilbert-Huang Transform in Time-Frequency Analysis of Seismic Signals. Plateau Earthquake Research, 30 (2018). [3] Ma xin, Hao yanan. Research on the denoising method of
empirical mode decomposition. Science and technology vision, 23 (2018).
[4] Xi xugang, Zhu haigang, Luo zhizeng. Surface emg signal denoising method based on EEMD and second-generation wavelet transform. Journal of sensing technology, 25 (2016). [5] Cao Yakun, Guo Weidong, Shi Chaoling. Clinical study of
high frequency ultrasound and electromyography in diagnosis of carpal tunnel syndrome of median nerve, 39 (2018). [6] Monika Błaszczyszyn, Agnieszka Szczesna, Katarzyna
Piechota. sEMG Activation of the Flexor Muscles in the Foot during Balance Tasks by Young and Older Women: A Pilot Study, 16 (2019).
[7] Hao Liu, Jun Tao, Pan Lyu. Human-robot cooperative control based on sEMG for the upper limb exoskeleton robot, (2019). [8] Hu aijun, Ssun jingjing, Xiang ling. Modal aliasing in
empirical modal decomposition. Vibration, testing and diagnosis, 31 (2011).
[9] Xiao Ying, DONG Yu hua. Adaptive Noise Cancellation Method Based on Empirical Mode Decomposition. Journal of Dalian Minzu University, 21 (2019).
[10] Liu jian, Zou renling, Zhang dongheng et al. Research and development trend of surface emg signal feature extraction methods. Advances in biomedical engineering, 36 (2015). [11] Jia yutao, Luo zhizeng. Review on the methods of
electromyographic signal feature extraction. Electronic devices, 30 (2007).
[12] Norden E, Huang Zheng Shen, Steven R. Long. A new view of nonlinear water waves: The Hilbert Spectrum, 1999, 31, 417-457.
[13] Noeden E. Huang, Man-Li C. Wu, Steven R. Long, etc. A confidence limit for the empirical mode decomposition and Hilbert spectral analysis, 2003, 459, 2317-2345.
[14] Zhang Tao, Ding Biyun, Zhao Xin. A Feature Extraction Method of Defect Detection Using Improved Hilbert—Huang Transform, Journal of xi’an Jaotong university, (52) 2018. [15] Wang sixian, Zhang lei, Duan Xiaoyi, Cui qi, Gao xianweil.