R E V I E W
Open Access
Foundations and applications of artificial
Intelligence for zero-day and multi-step attack
detection
Pierre Parrend
1,2,3*†, Julio Navarro
2,3†, Fabio Guigou
2,3,4†, Aline Deruyver
2,3and Pierre Collet
2,3Abstract
Behind firewalls, more and more cybersecurity attacks are specifically targeted to the very network where they are taking place. This review proposes a comprehensive framework for addressing the challenge of characterising novel complex threats and relevant counter-measures. Two kinds of attacks are particularly representative of this issue: zero-day attacks that are not publicly disclosed and multi-step attacks that are built of several individual steps, some malicious and some benign. Two main approaches are developed in the artificial intelligence field to track these attacks: statistics and machine learning. Statistical approaches include rule-based and outlier-detection-based solutions. Machine learning includes the detection of behavioural anomalies and event sequence tracking. Applications of artificial intelligence cover the field of intrusion detection, which is typically performed online, and security investigation, performed offline.
Keywords: Zero-day attack, Multi-step attack, Anomaly detection, Intrusion detection, Security investigation
1 Introduction
An ever growing percentage of cyberattacks is explic-itly targeted at a specific organisation in order to steal data, to perform industrial espionage or to execute
sabo-tage or denial of service [1]. The most dangerous
cyber-attacks include zero-day cyber-attacks and complex cyber-attacks
[2]. Although they are beginning to be better
under-stood by the community, they remain difficult to track and to identify in the massive haystack of system logs and alerts. Artificial intelligence tools are thus required to find both unknown and complex attacks. Unknown
attacks are known aszero-day attacks. They exploit
pre-viously unknown system flows. Around 4000 of them were exploited in 2015 and 2016, 160 of which
con-cerned industrial control [1]. Complex attacks are known
asmulti-step attacks. The danger they pose often emerges from the consecutive execution of steps which taken
*Correspondence:[email protected] †Equal contributors
1ECAM Strasbourg-Europe, 2, Rue de Madrid, Schiltigtheim, France 2Laboratoire ICube, Université de Strasbourg, 11, Rue Humann, Strasbourg, France
Full list of author information is available at the end of the article
individually are either innocuous or insufficient to be characterised as an aggression.
This paper provides a review of the two main approaches for tracking hard-to-find cyberattacks:
statis-tical analysis and machine learning [3], which are the two
domains of data analysis. Statistical analysis covers the extraction of statistical rules and outlier detection. Out-lier detection in particular necessitates the availability of suitable distance metrics, which can be computed either between individual points or between full distributions as for Kullback-Leibler Divergence. Machine learning sup-ports the extraction of behaviour anomalies and abnormal event sequences. Statistical analysis and machine learning are applied in two complementary steps of the security analysis process: intrusion detection for the online super-vision of computer systems and infrastructures, and post event investigation for the characterization of a given event of interest. We identify four consecutive generations of Intrusion Detection System (IDS) solutions, which are now often integrated in commercial products: expert sys-tems, alert correlation, data mining, and behavioural IDS.
Post event investigation involves providing experts with suitable security information to guide the search for sig-nificant malicious events and when relevant to charac-terise the actual properties of the cyberattack that these events are an indication of.
In this work, we therefore propose a comprehensive framework for the study of complex attacks and related analysis strategies through statistical tools, on the one side, and machine learning tools, on the other side. It puts these complex attacks in perspective with their core applications in the security domain: detection and inves-tigation. Although numerous works and review papers
deal with individual issues of this framework [4–6],
no comprehensive survey, which is a strong requirement for characterising novel threats and matching counter-measures, exist so far.
We first define the core security concepts used in this work and describe the hard-to-track anomalies and attacks we focus on, such as zero-day attacks and
multi-step attacks in Section2. Section3presents the statistical
foundations of anomaly detection relevant to
cybersecu-rity. Section 4describes specific cybersecurity solutions
that are based on these foundations and take advan-tage of machine learning techniques and Bayesian statis-tics to highlight one-off security issues and to model event sequences in order to identify multi-step intrusions.
Section 5 introduces the architectures and processes of
security detection and investigation that rely on these models.
2 Definitions
The terms used in this paper are defined in this section.
2.1 The vocabulary around attacks
We use here the definition of the IETF RFC 4949 on
Internet Security Glossary [7].
Anomaly: an activity that is different from the normal behaviour of system entities and system resources.
Attack: can be
1. An intentional act by which an entity attempts to evade security services and violate the security policy of a system. That is, an actual assault on system security that derives from an intelligent threat.
2. A method or technique used in an assault (e.g., masquerade).
Intrusion: can be
1. A security event, or a combination of multiple security events, which constitutes a security incident in which an intruder gains, or
attempts to gain, access to a system or system resource without having authorization to do so. 2. A type of threat action whereby an
unauthorised entity gains access to sensitive data by circumventing a system’s security protections.
Threat: can be
1. A potential for violation of security, which exists when there is an entity, circumstance, capability, action, or event that could cause harm.
2. Any circumstance or event with the potential to adversely affect a system through
unauthorised access, destruction, disclosure, or modification of data, or denial of service.
Traces: A mark, object, or other indication of the
exis-tence or passing of something1, in the IT context
an indicator of the occurrence of an action in the network (event in the form of log, alert or network packet).
Vulnerability: A flaw or weakness in a system’s design, implementation, or operation and management that could be exploited to violate the system’s security policy.
2.2 The scope of security issues
The field of cybersecurity covers all activities which tend
to weaken [8]:
Confidentiality: the ability of a system to keep its data and operations unknown to unauthorised entities,
Integrity: the ability of a system to avoid alteration of its data or operations by unauthorised entities,
Availability: the ability of a system to continuously pro-vide access to its data and operations to authorised users.
These are known as theCIA principles. These
defini-tions emphasise the fact that the users of a system need to be authorised and therefore, as a prerequisite, identi-fied. Thus, to allow a user or an entity to access some data or operation typically means that this access is forbidden to somebody else. Of course, some resources can be freely accessible, such as a web site, but this is a specific case only.
Confidentiality and integrity rely on mechanisms which enable authorised users to gain access to data and oper-ations while protecting these resources against
unautho-rised ones [9]. They are based on cryptographic or system
definition of availability, on the other hand, poses a major challenge. For instance, any unauthorised user can chal-lenge the system’s ability to withstand numerous requests. However, technical contingencies can drastically reduce system access, with or without human intervention, and with or without malevolent intention.
2.3 Security analysis
We use this generic term to describe the processing of traces in order to find abnormal and potentially malicious events. Analysis covers detection and investigation:
Detection: the process of identifying events suspected to be of malicious origin, as the related traces arrive through the system probes. It occurs at runtime.
Investigation: the process of exploiting post-incident traces to reconstitute the actual course of an event which is suspected to be of malicious origin. Investi-gation is usually performed using technical forensics tools, after the incident.
Signature detection: uses a set of known malicious data patterns (signatures) or attack rules (heuristics) that are compared with current behaviour to decide if it is that of an intruder. It is also known as misuse
detection [10].
Anomaly detection: enables to determine with a high level of confidence whether this behaviour is that of a legitimate user or that of an intruder based on the collection of data relating to the behaviour of
legitimate users over a period of time [10].
2.4 Zero-day attacks
Since the 1980s, most security solutions have been based on the detection of malevolent communications
or code through a signature-based approach [11].
How-ever, the exploitation of unknown attacks, known as
zero-day attacks, is a key success factor for highly
focused as well as large-scale intrusions [12]. Attacks
are considered zero-day when they occur before the exploit they rely on is disclosed publicly, as shown in
Fig.1.
Such a public disclosure typically concludes a process of introduction and discovery of the vulnerability. The vulnerability is first introduced in a new product or in a new feature of an existing product as a software or hardware flaw. Often, hacker groups discover the
vulner-ability and release exploit code in the wild,i.e. in more
or less ethical-minded communities. At some point, the vulnerability becomes known by the vendor, for instance through access to the exploit code, through a warning
of so-calledwhite-hathackers or even through an attack
specifically targeted at their system. At this point, the vul-nerability is still unknown to the user base of the product, including the system administrators of the editor’s clients. No protection therefore exists and the exposure is maxi-mal, but only a very restricted community is aware of the exploit and thus able to take advantage of it. When the vulnerability is disclosed publicly, a series of actions can be undertaken: disabling the weak system, updating anti-virus software signatures and publishing patches to close the vulnerability. Up to the moment when the patch is deployed on the complete software base using the vulner-able product, follow-up attacks can be performed. Usually, in this phase, scripts are released to ease the action of wannabe hackers, which make unprotected systems more vulnerable than in the pre-disclosure phase. The system update and security maintenance are therefore crucial in this regard.
In any case, zero-day attacks can only be identified by the deviation they imply in the existing behaviour of the system. Their discovery is a significant use case for anomaly detection.
2.5 Multi-step attacks
Since the exploitation of zero-day attacks requires a high skill level and significant time, they are usually used for high-end, high value-added attacks. Usually, the objec-tives are very specific, such as stealing valuable data in espionage efforts or disabling specific systems like the Stuxnet worm that hit the Iranian nuclear plants in 2010. Therefore, they are not exploited on their own, but in a sequence of operations that are specific to the system to be abused. These are known as multi-step attacks, or Advanced Persistent Threats (APTs). Their most relevant
characteristics are [13,14]:
1. They attack specific targets;
2. They use sophisticated tactics, techniques and procedures;
3. They constantly evolve their attack steps; 4. They largely infiltrate a network;
5. They perform repeated attack attempts; 6. They maintain long-term access to the target
environment.
Their detection is all the more difficult since certain steps in the attack are performed manually to remain
stealthy and to bypass detection approaches [15]. The
detection of such attacks therefore requires a deep under-standing of their construction and progress.
The main attack stages of multi-step attacks are:
• Pre-infection: reconnaissance, exploitation, re-direction.
• Infection: payload delivery.
• Post-infection: command and control, update, dropping, staging, exfiltration of stolen data.
A more detailed life-cycle, or ‘kill-chain’, can be
identi-fied [13,16], as shown in Fig.2and including the following
steps : (1) perform initial reconnaissance, (2) perform initial compromise, (3) establish foothold, (4) escalate privileges, (5) perform internal reconnaissance, (6) move laterally, (7) maintain presence and (8) complete mission. The phases 4 to 7 are repeated by the attackers to gain and maintain long-term access to the target environment.
The diverse technologies that are abused through multi-step attacks is a complementary factor which makes their
identification difficult. Table1[15] shows the techniques
and methods used in the operational phases of the main APT campaigns as of 2016, in the phases of initial compro-mise, lateral movement inside the system and command and control (C2). Exploitation of spear phishing is a com-mon vector for initial compromise. Lateral movement, which involves taking control of focused resources inside the systems to support the final phase of the attack, is based on Operating System tools, password abuse and vulnerability exploitation. The final phase of the attacks, which gives the attackers access to their target resource, largely uses the HTTP and HTTPS protocols for commu-nication and data exfiltration.
Their variety, as well as the generally semi-manual exe-cution, make multi-step attacks very difficult to identify. When considering zero-day, multi-step or more com-mon attacks, the threats are identified through symptoms,
called Indicators of Compromise [17–19] (IoC). IoC are
‘artifacts observed on a network or in an operating system that with high confidence indicates a computer intrusion’. They are best identified as anomalies with regard to the normal behaviour of a system.
3 Statistical foundations of anomaly detection Since AI technologies are now used by malevolent agents
to perform cyberattacks [20], it is of crucial
impor-tance for the protection of IT infrastructures that defen-sive solutions support suitable protections. Numerous
Table 1 Techniques and methods used in the operational phases of main APT campaigns [ 15 ] APT campaign/group Initial compromise Lateral movement C2 Report Spear- phishing Watering- hole attacks Server attacks Storage media Standard O S tools Hash and password dumping Exploit vul-nerabilities HTTP/HTTPS Others
Custom proto- cols
research studies present overviews of the domain, for
example, from the point of view of anomaly detection [21]
or data mining and machine learning [22].
A classification of the problems of anomaly tion is now presented, as well as the two main detec-tion strategies: rule-based and outlier-detecdetec-tion-based anomaly detection.
3.1 The problems of anomaly detection
The problems of statistical anomaly detection are described for discrete sequences by Chandola et al.
[23, 24]. They define three classes of problems, which
match three usage scenarios.
Scenario 1: The operator of a Security Operating Centre (SOC) performs an investigation to detect illegit-imate user sessions on an enterprise information system in the current week. He or she will typi-cally exploit the data of user sessions in previous weeks, such as sequences of system calls and com-mands, as training data. Using the first formulation, the suspicious traces are tested against this training data.
Scenario 2: The operator of a Security Operating Centre (SOC) performs an investigation to detect whether the account of a user was abused in the past few weeks. To achieve this, the operator can use the sec-ond formulation: the activity of the user is treated as a long sequence and is tested for anomalous sub-sequences.
Scenario 3: The operator of a Security Operating Cen-tre (SOC) performs an investigation to deter-mine whether the frequency of a given command is higher or lower than usual. A query pattern is defined as a sequence of commands. He or she can use the third formulation to compare the frequency of this query pattern in the activ-ity of the user in a given time period with the frequency of past sequences to detect malicious behaviours.
For the specific case of semi-supervised learning, the
three scenarios can be formulated as follows [24]:
Formulation 1: Given a set of n sequences, S =
S1,S2, ...,Sn, and a sequence Sq belonging to a test
data set S, compute an anomaly score for Sq with
respect to the training data set S. The length of
sequences inSand the length ofSqare not
necessar-ily equal. After evaluating the anomaly score of the
test sequenceSq, a complementary test is required to
check whether it significantly deviates from the score of other sequences to characterise an actual anomaly. The problem itself can be defined as follows: Given
a training set ofnsequencesS = S1,S2, ...,Snand a
test setS, find all sequences inSthat are anomalous
wrt.S.
Formulation 2: Detect short sub-sequences s in a long
sequenceS, which are anomalous with respect to the
rest ofS.
Formulation 3: Given a short query patterns, a long test
sequence S and a training set of long sequencesS,
determine whether the frequency of occurrence ofs
inS is anomalous with respect to the frequency of
occurrence ofsinS.
The three main approaches for addressing these problems are kernel-based techniques, window-based techniques and Markovian techniques. Kernel-based techniques consist in building a global model of the
system behaviour and looking for anomalies wrt. this
model. Window-based techniques consist in tracking local behaviours and comparing each trace to be ana-lyzed with each of the local behaviours. Markovian tech-niques predict the probability of the occurrence of each
behaviour (each symbol), given n previous values. For
each of these approaches, rule-based or outlier-detection-based strategies can be applied.
3.2 Rule-based anomaly detection
A representative example of how rules for anomaly detec-tion are defined and applied is given by the LEarning Rules
for Anomaly Detection (LERAD) model [25,26]. LERAD
defines a solution Sas the representation of the normal
behaviour of system calls. It triggers alarms when these rules are broken. LERAD is a supervised approach that requires a training set free of anomalies.
A solutionS is a set of rules which expresses the
val-ues of system call attributes observed in the training set.
S is defined as a 5-tuple, as given in Eq.1. A is the set
of N attributes,is the set of all possible values for the
attributes in A and I is the set of input tuples, which is
a subset of the N-ary Cartesian product over A. The rule
set itself is noted , andς is the maximum number of
conditions in a rule. LERAD rules are defined in Eq.2.
Each rule is defined by an antecedent, the left term of the rule and, a consequent, the right term of the rule. The
antecedent expresses for each attributeαi,j,...the observed
valuesφp,q,... for a given system call, with the maximum
number of attributes less than or equal toς. The
conse-quent gives the set of values observed in the training set
for the attribute αk (αk not in the antecedent) as a set
{φa,φb,. . .}.
S:(A,,I,,ς) (1)
R:(αi=φp)∧(αj=φq) . . . ςterms⇒αk∈{φa,φb,. . .}(2)
For each ruleR, a probabilitypof interpreting a call as an
antecedent tuples (on the left term of the rule) that satisfy
the rule during training, andr, the cardinality of the set
of observed values for the consequent (right term of the
rule). It is given in Eq.3.ris necessarily smaller than or
equal ton.r=n, and thusp=1 if each occurrence of the
antecedent matches a different valueφaofαk.r<<n, and
thusp<<1, if the same valueφaofαkoccurs frequently
for a given antecedent. The anomaly score of a novel event
with regard to a given rule is defined asAS, as given in
Eq.4.ASis the inverse ofp.AS= 1 if each occurrence of
the antecedent matches a different valueφaofαk; in this
case, a new value forαkwill not be a significant anomaly.
AS >> 1 means that the antecedent usually matches a
limited set ofαk, that new observations of the antecedent
are likely to match a known value ofαk, and therefore that
a call breaking the rule is likely to be a significant anomaly.
The total anomaly scoreTASis computed by considering
all broken rules as well as the delay since last anomaly for
a given rule. It is given in Eq.5. iis the index of a rule
which the tuple has violated.t is the time since the rule
was last broken, which is an indicator of the rule stabil-ity and thus of its qualstabil-ity. Since anomalies often occur in
bursts during an attack, theTASwill be high at the
begin-ning of the attack, clearly labelling the moment when the potential aggression starts.
p= r
n (3)
AS= 1 p =
n
r (4)
TAS=
i
ti
pi
=
i
tini
ri
(5)
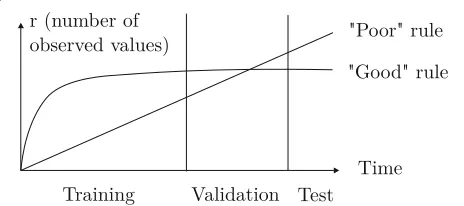
LERAD is designed to minimise the total number of rules and to avoid an excessive analysis overhead. One cri-teria for selecting rules is to favour the ones that describe the behaviour of the system well and that exhibit a
sta-ble behaviour over time, as shown in Fig. 3. The AS
value quickly reaches its nominal value during the train-ing phase, is not significantly modified durtrain-ing the val-idation phase and is stable during the test phase. This
Fig. 3Evaluating the quality of anomaly detection rules [25]
behaviour increases the probability that rule breaking indicates actual anomalies.
3.3 Measurement of distance between observations Anomaly detection implies that ‘normal’ behaviours can be discriminated from ‘abnormal’ ones. A strong prereq-uisite is therefore that the degree of ‘normality’ can be quantified, i.e. that a distance measure between observed system traces and a reference trace set can be computed. According to the type of information available, such as single points, series or distributions of observations, vari-ous approaches should be used.
3.3.1 Euclidian distance
A simple metric for distance measurement between two
points is the Euclidian distance, recalled in Eq. 6 for
two dimensions. When more parameters are considered, the equation is extended accordingly. This is of course the most widely used measure of distance between two observations.
d=
(x2−x1)2+(y2−y1)2 (6) 3.3.2 Manhattan distance
In case of compact distributions, the Manhattan distance
or city-block distance, defined in Eq.7for two dimensions,
can be used to discriminate dense observations. When more parameters are considered, the equation is extended accordingly.
d= |x2−x1|+|y2−y1| (7)
3.3.3 Reachability distance
When the objective is to extract observations that are fur-ther away from the ofur-thers, it is often convenient to smooth the distance for densely located observations, where dis-crimination would be computationally costly but would contribute little additional information. This
smooth-ing is supported by the reachability distancereach_dist
[27]. The reachability distance is computed according to
d(p,o), the Euclidian distance between the objects p and
o, and the k-distance of objectp wrt. objecto, denoted as
k−distance(p). Its definition is given in Eq.8.
reach_distk(p,o)=max(d(p,o),k−distance(o)) (8)
For any positive integer k, thek−distanceof object p
is defined as the distanced(p,o)between p and an object
o∈Dsuch that:
1. For at least k objectso∈D\p,d(p,o)≤d(p,o) holds, and
2. For at most k-1 objectso∈D\p,d(p,o) <d(p,o) holds.
Figure4shows an example of the reachability distance
Fig. 4Example ofreach_distfor several points [27]
away fromo,reach_distk(p,o)= d(p,o). When an
obser-vationpis close too, the distance considered in thek−
distanceofo.
3.3.4 Distance between sets of observations
It is often useful to reduce the dimension of sets of obser-vations, for instance, as input to algorithm processing or
to facilitate visualisation. Tandon et al. [26] proposes to
use a distance metric between two sets of scalar obser-vations inspired by the symmetric Mahalanobis distance
[28,29], as shown in Eq.9. As output, observation sets are
represented as points in a two-dimensional space.s1is an
arbitrary reference observation set, ands2is the
observa-tion set whose distancewrt.s1is to be computed.x1iis the
value of theithobservation ins1;x2iis the value of theith
observation ins2.s1includesn1observations;s2includes
n2observations. (x,¯ y) are the means along the¯ xandyaxes,
and (σx,σy) the standard deviations along these axes.
dx=
n1 i=1
x1i−¯x2
σx2 +
n2 j=1
x2j−¯x1
σx1 n1+n2
,dy=
n1 i=1
y1i−¯y2
σy2 +
n2 j=1
y2j−¯y1
σy1 n1+n2
(9) This approach can be used to reduce the dimensions of complex observations in order to plot the sequence space
of call sequences, as shown in Fig.5.
3.3.5 Distance between distributions: the Kullback-Leibler divergence
When the distribution of the observations is known, rather than the observations themselves, computing the distance between real sets is not relevant. Instead, the distance between the distribution of observations is com-puted. This approach allows in particular the evaluation
of the quality of data models wrt. the original datasets.
The Kullback-Leibler divergence [30,31] is a tool which
supports the computation of such a distance, as shown
in Eq.10. The Kullback-Leibler divergence between
dis-tributions P andQis denotedDKL(PQ). It is based on
the probabilitiesP(i)andQ(i)of distributionsPandQfor
each possible valuei.
DKL(PQ)=
i
P(i)logP(i)
Q(i) (10)
The Kullback-Leibler divergence is linked to the notion of observed information, also known as the Fisher infor-mation metric, which is its infinitesimal form. Fisher Information and Kullback-Leiber divergence are signifi-cant concepts from the emerging mathematical field of
Geometric Science of Information2.
3.4 Outlier detection
The identification of novel and hard-to-track attacks such as zero-day attacks or multi-step attacks requires to bypass classical signature-based, ruled-based approaches
for cyber-security such as defined in Section 3.2.
More-over, the rapid pace of evolution of IT ecosystems and the increasing variety of interconnections strongly limit the perspectives for the construction of a satisfactory explicit model for these attacks. Hence, the field of outlier detec-tion, which is used to identify abnormal data based on previous observations, is currently experiencing a rapid
growth, in particular in the domain of cybersecurity [32].
Outlier detection can be both univariate or multivariate
[33]. According to the context and available data, it is
based on unsupervised, supervised or semi-supervised
algorithms [34].
Outliers can be either global, i.e. they deviate from a comprehensive model or kernel of the data space, or local, i.e. they exhibit properties deviating from neighbour
observations. Figure6illustrates a global outlier, for one
outlying observation in a two dimensional space. 3.4.1 Hawkins outlier
A generic definition of the concept of outlier is proposed by Hawkins, as ‘an observation that deviates so much from other observations as to arouse suspicion that it was
gen-erated by a different mechanism’ [35]. Although useful,
this definition lacks the necessary formalism for further implementation. A more specific definition for a global outlier is thus needed.
3.4.2 DB(pct,dmin)outlier
An objectpin a datasetDis a (global)DB(pct,dmin)
out-lier if at least a percentagepctof the objects inDlies at a
distance greater than distancedminfromp, i.e. the
cardi-nality of the setq∈D|d(p,q)≤dminis less than or equal
to (100−pct%) of the size ofD[36].
Since theDB(pct,dmin)outlier is a global outlier, only
a
b
Fig. 5Sequence space for two applicationsaftpd (File Transfer Protocol Daemon) andblpr (Line PRinter) [26]
3.4.3 Local outlier factor
In several scenarios, anomalies are indeed characterised
as being abnormalwrt. similar elements, without
neces-sarily being significantly different from normal observa-tions. It is therefore necessary to consider local outliers,
where abnormality is consideredwrt.k-nearest neighbour
elements [37]. The Local Outlier Factor (LOF) provides an
example of local outlier detection.
The LOF is based on the reachability distancereach_dist
metric, introduced in Section3.3. A local reachability
den-sity is calculated for each object, which is the inverse of the average reachability distance of the object from its
near-est neighbours [27]. lrdMinPts(p)is the local reachability
Fig. 6Example of a two dimensional space with one outlying observation [33]
density of object p. It is defined in Eq. 11. The LOF is
defined for each object by comparing its reachability den-sity with each of its neighbours. The local outlier factor LOFMinPts(p)for objectpis computed based on the
reach-ability distance as defined in Eq.12.MinPtsis the number
of neighbours which are considered to belong to the local
neighbourhood of the object,NMinPts(p)is the set of these
neigbours.
lrdMinPts(p)=1/
o∈NMinPts(p)reach_distMinPts(p,o)
|NMinPts(p)|
(11)
LOFMinPts(p)=
o∈NMinPts(p)
lrdMinPts(o)
lrdMinPts(p)
|MinPts(p)| (12) It is noteworthy that the proposed solution is inappro-priate for online detection, since the approach requires knowledge of all process sequences. The Local Outlier
Factor (LOF) [27] is an unsupervised approach, which
is used in the LEarning Rules for Anomaly Detection
(LERAD) model [25]. When applied to sequences of
sys-tem calls, it defines the supervised Sequence-LERAD
(S-LERAD) model [26]. The LOF is an example of
distance-based outlier detection. When the number of observations is excessive, such approaches are highly resource consuming. Other approaches, such as density-based outlier detection, are needed.
3.4.4 Importance w(x)
This density-based outlier detection metric is defined in
x, the distribution of the training dataptr(x)and the
dis-tribution of the test data pte(x) is taken into account.
w(x)= ptr(x) pte(x)
(13) If the training and test data densities are equivalent, the
value ofw(x)is 1. The importance value tends to be small
in the regions where the training data density is low and the test data density is high. Thus, samples with small importance values are plausible outliers. This implies that
the importancew(x) needs to be computed region-wise,
rather than on the whole distribution space [38].
3.4.5 Kullback-Leibler importance estimation procedure Based on the definition of the importance metric, out-lier detection can be performed through the estimation of distribution similarities by using the Kullback-Leibler Importance Estimation Procedure (KLIEP) as defined in
Eq. 15 [38]. The importance can be modelled with a
linear estimation of the importance distribution wˆ as
given in Eq.14. To obtainw, Kullback-Leibler divergenceˆ
KL[ptr(x)ˆptr(x)] is minimised.
ˆ
w=
b
l=1
αlφl(x) (14)
KL[ptr(x)ˆptr(x)]= ptr(x)log
ptr(x)
ˆ
w(x)pte(x)
dx (15)
Other outlier strategies include the kernel density
esti-mator (KDE) and density ratio estimations [39] such as
one-class support vector machine (OSVM) [40], Least
Square Importance Setting (LSIF) and unconstrained
LSIF [26]. The efficiency challenge is another key
prop-erty of outlier detection algorithms, especially for
high-dimensional datasets [41].
4 Machine learning
The identification of unknown attacks faces two major challenges: first, the ability to detect behaviour anomalies, especially for identifying zero-day attacks and, secondly, the ability to track abnormal event sequences, so as to address APTs. Machine learning, as well as advanced statistics, represents methods of critical importance for the online detection of intrusions, on the one hand, and the offline, ‘post-mortem’ investigation of security issues, on the other.
4.1 Detection of behaviour anomalies
The detection of behaviour anomalies is a rich field of investigation for machine learning approaches. More specifically, recursive Bayesian estimation, which is used to model the behaviour of individual entities of IT sys-tems, provides an alternative method for quickly identify-ing deviations of this model.
4.1.1 Benchmark of machine learning techniques
The systematic presentation of machine learning tech-niques is beyond the scope of this work. Several significant publications will help the reader find his/her way in this
vast domain [42, 43], although none of them provides a
comprehensive view of the subject.
For the evaluation of machine learning techniques, the
KDD99 dataset [44], as well as its improved version
NSL-KDD [45], are still widely used today, in spite of their age.
Some recent surveys using them give a good overview
of the methods and the results obtained [4–6]. Table 2
summarizes the performance of the algorithms contained in the Weka workbench on the KDD99 dataset,
accord-ing to the evaluation made by Modi and Jain [4]. The
authors calculated the Percentage of Successful Predic-tions (PSP) and the Training Time (TT) for each stud-ied algorithm. The best results in terms of successful predictions are achieved by MARS (Multivariate Adap-tive Regression Splines). Of course, the results are fully contextual for this specific benchmark, but nonetheless provide an estimation of the relative performance of the considered algorithms.
Since machine learning algorithms are typically diffi-cult to parameterise, as well as very dependent on the quantity of the training data, it is likely that solutions
Table 2Performance comparison of algorithms in Weka workbench on the KDD99 dataset [4]
Algorithm Percentage of successful
prediction (%)
Training time (seconds)
K-Means 78.7 70.7
NEA 92.22 10.63
FCC 89.2 56.2
ID3 72.22 120
J48 92.06 15.85
PART 45.67 169
NBTree 92.28 25.88
SVM 81.38 222.28
Fuzzy logic 91.8 873.9
Naive Bayes 78.32 5.57
BayesNet 90.62 6.28
Decision Table 91.66 66.24
Random Forest Classifier 92.81 491
Jrip 92.30 207.47
OneR 89.31 3.75
MLP 92.03 350.15
SOM 91.65 192.16
GAU 69.9 177.4
MARS 96.5 67.9
focusing on a single technology will achieve better results. This may be the case for instance for neural networks, which have been the subject of significant progress in the last few years.
4.1.2 Recursive Bayesian networks
Bayesian classification models have proved to be
effi-cient tools for intrusion detection [46,47]. Figure7shows
an example of an anomaly detection approach based on
Bayesian alert correlation [48] for IDS alerts. The
pro-cess of alert correlation begins by the extraction of recent intrusion alerts. The comparison with historical intrusion alerts allows to extract the pseudo-Bayesian probabilities between a given event and its precursors. Based on these probabilities, the likelihood of alert correlation is com-puted for all relevant events. A threshold is applied to extract alert correlation graphs, which highlight alerts that are worth investigating.
The application of this process for systems with evolving
states is called recursive estimation [49]. When
perform-ing such a recursive estimation at the level of each network device, machine and system user, efficient solutions for the identification of access rights abuses or of intrusions can be devised.
4.2 Tracking abnormal event sequences
Machine learning is typically able to identify anoma-lous behaviours and it is therefore a serious candidate to improve the tracking of zero-day attacks. Multi-step attacks, however, are only visible through traces that are scattered in vast amounts of data over large time periods and on heterogeneous devices. Their identification there-fore requires the ability to track abnormal event sequences and first of all to reconstruct these sequences. To achieve this, two significant contributions have been proposed by the community: Galois lattice to rank actions and taint
analysis to trace the correlation between events. Both are based on oriented-graph models.
4.2.1 Galois lattice
A lattice is a mathematical object consisting of partially ordered sets, where each pair of elements has a unique
least upper bound or supremum [50]. An example of a
lattice is the set of natural numbers, which are partially ordered according to the divisibility operation: the least upper bound of an element pair is their least common multiple and their unique infimum is the greatest com-mon divisor. A category theoretic approach to lattice leads to the use of Galois connections to build the lattice: in this
case, the lattice is named a Galois lattice [51] and supports
ordered relationships between compound elements from two different sets, provided these sets are monotonous. When the information is semantic rather than algebraic, the lattice becomes a concept lattice, according to Wille’s
theory of concepts [52]. It then supports formal concept
analysis [53]. A comprehensive definition of concepts and
Galois lattices can be found in [54].
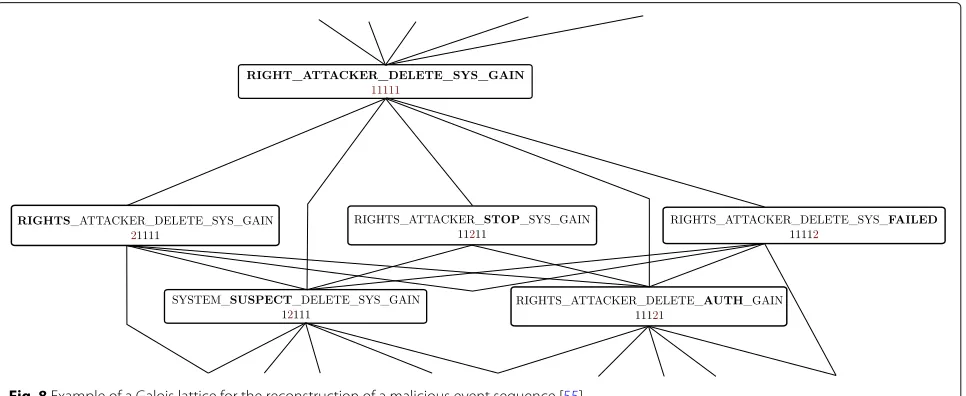
Figure 8 shows an example of a Galois lattice for the
reconstruction of a malicious event escalation [55]. The
Galois lattice is built interactively: an event is codified through a Galois connection in the context of a pre-existing lattice. The event then inherits the properties of the matching lattice node, including meta-data such as the class of the performed action or the dangerousness level. To support the evolution of the reference Galois lat-ticewrt. the evolution of the system, this classification is validated by an expert. If modifications are required, the reference lattice is updated to integrate this new knowl-edge. In any case, either the incident is confirmed and suitable action is undertaken by the security operators
or the risk level evaluation for the infrastructure being monitored is updated.
The classification of malicious actions can be used to rank the suspicious actions that take place inside an IT infrastructure, thereby announcing the escalation of dan-gerous actions and thus potentially an actual intrusion. Galois lattices support such ranking while taking into account multiple orthogonal security-related attributes. 4.2.2 Taint analysis
Taint analysis has the objective of systematically labelling paths available for data propagation. It originally comes from the world of static analysis and is increasingly used in the security domain both for the generation of virus
signatures and for security investigation [56,57].
The first application of taint analysis to security was designed for the automated detection and analysis of
malicious exploits [58]. Beyond security-specific issues, a
framework for the application of taint analysis to safety
issues was proposed by [59].
An original application of taint analysis has recently been proposed for investigation by attack tracing and
event correlation [60]. Figure 9 shows the signature
derivation steps for tainted analysis of multi-step attacks
[61]. The events, which are represented by the system
logs, are first parsed, normalised and made available in a dedicated database. Then, the tainting operation itself is performed on this data according to taint policies and meta information, in order to generate the taint graphs of significant event sequences for the considered time period. Taint policies define the event attributes to be added to the set of taint sources or nodes, such as the IP address of the source or the communication proto-col. Meta-information includes complementary data that
Fig. 9Signature derivation steps for tainted analysis of multi-step attacks [61]
enable the identification of indirect relations between attributes. Finally, signatures are derived from the taint graphs and stored for further analysis or exploitation in later investigations.
The signature format used by the authors is theEvent
Description Language(EDL) language. Figure10shows an
example of a graph signature in the EDL language [61].
It is worth noting that attack signatures can entail several paths for a single attack or even several different attacks that can occur in a given context.
5 Applications
The applications of anomaly detection and event sequence tracking to security analysis, i.e. detection and investiga-tion, are now presented.
5.1 Intrusion detection
The first and probably most popular facet of security anal-ysis is intrusion detection. It is defined as “the process of monitoring for and identifying specific malicious
traf-fic” [62]. The devices that can monitor host processes or
network packets in the search of malicious actions are called Intrusion Detection Systems (IDS). They are clas-sified into two types, according to the method used for detection: anomaly detection or signature-based
detec-tion [63]. There are also alternatives that combine the
two approaches [64]. Many surveys of work in
Intru-sion Detection Systems exist, each focusing on a certain
aspect of the problem [6, 11, 63, 65]. Based on this
lit-erature survey, we identify four consecutive generations of IDSs: expert systems, alert correlation-based systems, data mining approaches, and behavioural IDSs.
5.1.1 First IDS generation: expert systems
The historical reference for IDS is the seminal work
of Dorothy Denning in 1985 [66] concerning the
requirements and the reference model from 1987 [67].
This model is still applicable regarding the overall requirements:
Detected intrusions should cover:
Attempted break-in by outsiders;
Masquerading, i.e. seemingly legitimate access fol-lowing credential theft;
Penetration, in particular resulting in confidential-ity or integrconfidential-ity loss;
Second-order access violation, i.e. gaining access to unauthorised information through the aggregation of individual information pieces to which access is piecewise allowed;
Information leak through covert channels; Denial of services;
Side-effects such as the disruption of services or damages to data and software following mal-ware attacks.
Applicability to different hardware, operating systems and application environments;
Discriminating power ensuring a high detection rate as well as a low rate of false alarms;
Ease of use
Modifiability to adapt to evolving threats;
Self-learning of the normal behaviour of the system;
Real-time detection as well as after-the-fact sleuthing (or investigation);
Security of IDS and its database against confidentiality, integrity and availability threats.
Denning’s work was focused on explicit expert rules, which were pervasive throughout the first generation of IDSs. Since then, richer solutions have been developed, including machine learning, which provide implicit but powerful models.
5.1.2 Second IDS generation: alert correlation
Fig. 10Example of graph signature in the EDL language [61]
and correlation, known as the NAC process [68]. This
pro-cess may be complemented by a clustering step [69,70] to
enrich detection capacity.
The requirements for alert correlation are [68]:
The semantic of the information to be correlated, which needs to be explicitly defined
The scalability of the analysis process for important data volumes and for the Intrusion Detection System itself
The reactivity, i.e. the automation of either collection of more information, modification of IDS probes, esca-lation to human experts or application of suitable countermeasures
The proactivity to anticipate expected alerts according to the data-flow type or time of day.
The CRIM model [71,72] represents a potential
archi-tecture to support the NAC process as shown in Fig.11.
The alerts are first collected and then clustered to identify the main alert classes. Within these clusters, similar alerts are merged, which provides a reduced set of global alerts. Next, the correlation step itself is performed in order to infer candidate attack plans and possibly attack objec-tives, the ‘intentions’. Ideally, a suitable reaction is then
triggered [73].
The classic NAC model has been reviewed by Salah et al.
[74]. They propose a new model taking into consideration
Fig. 11The CRIM architecture for alert clustering, merging and correlation [71]
5.1.3 Third IDS generation: data mining
The third generation of Intrusion Detection Systems relied heavily on data mining approaches. It introduced a three-level architecture corresponding to the levels of data, information and knowledge, which are clearly
different from one another. The data level collects the raw data, possibly enforcing normalisation to prepare for later analysis. The information level processes this data through transformation and selection. It is also known as the data fusion or data mining layer. The knowledge level
is responsible for discovering new behaviours and for the interaction with human operators through visualisation and external verification.
Figure12shows a representative model of the
informa-tion flow for intrusion detecinforma-tion using multi-sensor data
fusion [75]. Figure13shows a representative model of the
information flow for intrusion detection data mining [75].
Among the classes of data mining techniques, anomaly-based intrusion detection plays a central role in the discovery of new attacks such as zero-day attacks and multi-step attacks: it encompasses both information and
knowledge layers. Figure 14 shows a classification of
anomaly-based detection techniques [76] used in IDSs,
which cover statistical, knowledge-based and machine-learning-based techniques. Statistical approaches include
univariate, multivariate and time-series models [77].
Knowledge-based approaches include Frequent Subgraph Mining (FSM), description languages and expert systems. Machine-learning-based approaches in this classification include Bayesian networks and outlier detection, which are advanced statistical techniques, as well as Markov
models [78], neural networks [79], fuzzy logic, genetic
algorithms [80], ant-colony-based solutions [81] and
clustering [69].
Much work has been done to improve intrusion detec-tion based on data mining. This approach is especially relevant when dealing with data from a set of heteroge-neous sources. The high volume of data generated by the devices connected to a network poses big data challenges when trying to detect intrusions. The reader can find
more information in [82] about the intrusion detection
techniques developed in this context.
5.1.4 Fourth IDS generation: behavioural IDS
Advanced machine learning techniques can generate models that are fine-grained enough to be able to track the behaviour of individual entities of the IT infrastructure, including network devices, systems and individual users
[4–6]. Any deviation of the usual behaviour of one of these
entities is therefore perceived, which greatly improves the performance of the Intrusion Detection System, in
particular using deep learning [83,84] and distance-based
[85,86] approaches. These approaches have already been
presented in Section4.1.
a
b
c
Fig. 14Classification of anomaly-based detection techniques [76]
5.2 Security investigation
The second facet of security analysis is the so-called sleuthing or investigation. In case of ascertained network or system abuse, the reconstruction of the full-attack process and a detailed understanding of individual steps is necessary to be able to contain the attack, to patch damaged services and systems and to avoid repeti-tion of similar attacks. Data mining is again a useful solution.
The process of security investigation relies more on the actions of the human user than intrusion detection. However, the amount of log data is steadily increasing, so that an automated support of the investigation process
is of vital importance for its success. Figure 15
illus-trates the process of data mining to support security
investigation [87]. As in intrusion detection, the process
starts with IDS alerts, which are stored in the IDS data-warehouse. Through data mining, activity patterns are extracted. The human investigators, for instance people from a Security Operating Center (SOC), start their work here. Through the interpretation of the activity patterns, insights are gained and highly focused manual verifica-tions can be performed. When the root causes leading to the attack are determined, they can be fixed. Moreover, suitable filtering and correlation rules can be setup in the IDS to integrate the new aggressions as part as the IDS’s knowledge. Clearly, systematic investigation is mandatory for the maintenance of operational and efficient IDSs.
Figure16provides an example for a simple login to a
Win-dows system using the anomaly signature language EDL
[88], which is an attempt to provide a candidate language
for solving this issue.
Security investigation is emerging as a research domain per se and poses several core challenges:
1. Cyber-threat intelligence [89] is becoming ever more powerful, which poses two complementary challenges to organisations: how to organise this intelligence internally and how to face attackers having access to a similarly growing amount of information.
2. No standardized language exists so far to support the description of abnormal behaviours, which
dramatically reduces the perspectives for information exchange between various actors.
Fig. 15A process for data-mining-supported security investigation [87]
6 Conclusions
In this work, we therefore propose a comprehensive framework for the study of complex attacks and related analysis strategies through statistical tools, on the one side, and machine learning tools, on the other side. It puts these complex attacks in perspective with their core applications in the security domain: detection and investi-gation. Although numerous works and review papers deal
Fig. 16Example of an EDL signature calledUserLoginfor a simple login to a Windows system [88]
with individual issues of this framework [4–6], no
com-prehensive survey, which is a strong requirement for char-acterising novel threats and matching counter-measures, exist so far.
In this paper, we define a comprehensive framework for the study of complex attacks, related analysis strate-gies, and their core applications in the security domain: detection and investigation. This framework eases in par-ticular the characterisation of novel complex threats and matching Artificial Intelligence-based counter-measures. We first define the core terms necessary to understand
the domain: anomaly, intrusion, attack, traces, threats,
andvulnerabilitiesand the security properties confiden-tiality, integrity, and availability, as well as the phases
of the security analysis process:detection and
investiga-tion. Zero-day attacks andmulti-step attacks are intro-duced and defined. The two main approaches of artificial intelligence for security analysis are reviewed: statistical analysis and machine learning techniques. Their applica-tions in intrusion detection and security investigation are presented.
The advent of artificial intelligence (AI) thus opens up a promising field of investigation for cybersecurity
[91], which already includes significant operational
break-throughs like the Darktrace behaviour analysis system3or
COSE cognitive security solution4. Darktrace is a
com-mercial solution based on recursive Bayesian networks to model the actual behaviours of systems, users and devices and to track abnormal deviations. COSE, now part of CISCO, exploits machine learning and game
the-ory [92] with the objective of tracking advanced
significant examples of technology transfer from universi-ties, in Cambridge (UK) and in Prague (Czech Republic), respectively, to successful industrial applications.
The diverse technologies contributing to the artificial intelligence field provide numerous approaches to support both online detection and offline investigation of security anomalies. Their rapid development is providing suitable solutions for tracking targeted zero-day and multi-step intrusions in an ever growing amount of traces generated by network devices, servers and application services. Endnotes 1https://en.oxforddictionaries.com/definition/trace 2http://www.gsi2017.org/ 3https://www.darktrace.com/ 4https://www.cisco.com/c/dam/global/cs_cz/assets/ ciscoconnect/2013/pdf/7_keynote_cose_michal_ pechoucek.pdf Acknowledgements
We thank the colleagues who provided significant input to the research presented in this paper, in particular Véronique Legrand, Professor at Conservatoire National des Arts et Métiers, as well as Julie Thompson who helped with the corrections in the English language.
Funding
The research presented in this paper is founded by French Fonds Unique Interministériel (FUI) AAP-19 project HuMa (L’Humain dans la boucle pour l’analyse de données massives), as well as the French Agence Nationale pour la Recherche Technologique (ANRT) through the CIFRE grant for PhD student Fabio Guigou and enterprise IPLine.
Availability of data and materials
No specific data or material is made available for this review research paper.
Authors’ contributions
PP coordinated the writing of the paper, wrote the major parts (Introduction, parts 2 and 5, Conclusions), and provided significant modifications to parts 3 and 4. JN is working on his Ph.D. in artificial intelligence for cybersecurity and contributed to part 4 and the bibliography. He contributed significant improvements to every other section. FG is working on his Ph.D. in statistical anomaly detection and contributed to part 3. He contributed significant improvements to every other section. AD is the Ph.D. director of Julio Navarro. She proof-read and added significant improvements to the paper. PC is the Ph.D. director of Fabio Guigou. He proof-read and added significant improvements to the paper. All authors read and approved the final manuscript.
Competing interests
The authors declare that they have no competing interests.
Publisher’s Note
Springer Nature remains neutral with regard to jurisdictional claims in published maps and institutional affiliations.
Author details
1ECAM Strasbourg-Europe, 2, Rue de Madrid, Schiltigtheim, France. 2Laboratoire ICube, Université de Strasbourg, 11, Rue Humann, Strasbourg, France.3Unitwin UNESCO Complex System-Digital Campus, Paris, France, http://www.cs-dc.org/.4IPLine, 189 Chemin du Bac À Traille, Caluire-et-Cuire, France.
Received: 21 November 2017 Accepted: 20 March 2018
References
1. Internet Security Threat Report. Symantec.22(2017). Available from:
https://www.symantec.com/content/dam/symantec/docs/reports/istr-22-2017-en.pdf
2. DE Denning, Stuxnet: what has changed? Future Internet.4(3), 672–687 (2012)
3. M Ahmed, AN Mahmood, J Hu, A survey of network anomaly detection techniques. J. Netw. Comput. Appl.60, 19–31 (2016)
4. MU Modi, A Jain, A survey of IDS classification using KDD CUP 99 dataset in WEKA. Int. J. Sci. Eng. Res.6(11), 947–954 (2015)
5. MS Kumar, A survey on improving classification performance using data pre processing and machine learning methods on NSL-KDD data. Int. J. Eng. Comput. Sci.5, 16156–16161 (2016)
6. J Ernst, T Hamed, S Kremer, inComputer and Network Security Essentials. A survey and comparison of performance evaluation in intrusion detection systems (Springer, 2018), pp. 555–568
7. NW Group, et al.,RFC4949: Internet Security Glossary, Version 2. (Internet Engineering Task Force, 2007)
8. Y Qian, D Tipper, P Krishnamurthy, J Joshi,Information assurance: dependability and security in networked systems. (Morgan Kaufmann, 2010) 9. VM Igure, RD Williams, Taxonomies of attacks and vulnerabilities in
computer systems. IEEE Commun. Surv. Tutorials.10(1) (2008) 10. W Stallings, L Brown, MD Bauer, AK Bhattacharjee,Computer security:
principles and practice. (Pearson Education, 2012)
11. N Hubballi, V Suryanarayanan, False alarm minimization techniques in signature-based intrusion detection systems: a survey. Comput. Commun.49, 1–17 (2014)
12. L Bilge, T Dumitras, inProceedings of the 2012 ACM conference on Computer and communications security. Before we knew it: an empirical study of zero-day attacks in the real world (ACM, 2012), pp. 833–844 13. EM Hutchins, MJ Cloppert, RM Amin, Intelligence-driven computer
network defense informed by analysis of adversary campaigns and intrusion kill chains. Lead. Issues Inf. Warf. Secur. Res.1, 80 (2011) 14. P Chen, L Desmet, C Huygens, inIFIP International Conference on Communications and Multimedia Security. A study on advanced persistent threats (Springer, 2014), pp. 63–72
15. M Ussath, D Jaeger, F Cheng, C Meinel, inInformation Science and Systems (CISS) 2016 Annual Conference on. Advanced persistent threats: behind the scenes (IEEE, 2016), pp. 181–186
16. Mandiant, APT1: exposing one of China’s cyber espionage units (2013).
https://www.fireeye.com/content/dam/fireeye-www/services/pdfs/ mandiant-apt1-report.pdf
17. P Kampanakis, Security automation and threat information-sharing options. IEEE Secur. Priv.12(5), 42–51 (2014)
18. C Goodwin, JP Nicholas, J Bryant, K Ciglic, A Kleiner, C Kutterer, A Massagli, A Mckay, P Mckitrick, J Neutze, et al., A framework for cybersecurity information sharing and risk reduction. Microsoft (2015) 19. F Fransen, A Smulders, R Kerkdijk, Cyber security information exchange
to gain insight into the effects of cyber threats and incidents. e & i Elektrotechnik und Informationstechnik.132(2), 106–112 (2015) 20. F Pistono, RV Yampolskiy, Unethical research: how to create a
malevolent artificial intelligence. arXiv preprint arXiv:160, 502817 (2016) 21. B Morel, inIntrusion Detection Systems. Anomaly based intrusion
detection and artificial intelligence (InTech, 2011), pp. 19–38 22. AL Buczak, E Guven, A survey of data mining and machine learning
methods for cyber security intrusion detection. IEEE Commun. Surv. Tutorials.18(2), 1153–1176 (2016)
23. V Chandola, A Banerjee, V Kumar, Anomaly detection: a survey. ACM computing surveys (CSUR).41(3), 15 (2009)
24. V Chandola, A Banerjee, V Kumar, Anomaly detection for discrete sequences: a survey. IEEE Trans. Knowl. Data Eng.24(5), 823–839 (2012) 25. MV Mahoney, PK Chan, inData Mining, 2003. ICDM 2003. Third IEEE
International Conference on. Learning rules for anomaly detection of hostile network traffic (IEEE, 2003), pp. 601–604
26. G Tandon, P Chan, D Mitra,Data cleaning and enriched representations for anomaly detection in system calls.Machine Learning and Data Mining for Computer Security, (2006), pp. 137–156
27. MM Breunig, H-P Kriegel, RT Ng, J Sander, inACM sigmod record, vol. 29. LOF: identifying density-based local outliers (ACM, 2000), pp. 93–104
29. GJ McLachlan, Mahalanobis distance. Resonance.4(6), 20–26 (1999) 30. S Kullback, RA Leibler, On information and sufficiency. Ann. Math. Stat.
22(1), 79–86 (1951)
31. S Kullback,Information theory and statistics. (Courier Corporation, 1997) 32. Y Chakhchoukh, S Liu, M Sugiyama, H Ishii, inPower and Energy Society
General Meeting (PESGM) 2016. Statistical outlier detection for diagnosis of cyber attacks in power state estimation (IEEE, 2016), pp. 1–5 33. I Ben-Gal,Data mining and knowledge discovery handbook. Outlier
detection. (Springer, New York, 2005), pp. 131–146
34. V Hodge, J Austin, A survey of outlier detection methodologies. Artif. Intell. Rev.22(2), 85–126 (2004)
35. DM Hawkins,Identification of outliers, vol. 11. (Springer, 1980) 36. EM Knorr, RT Ng, inProceedings of the International Conference on Very
Large Data Bases. Algorithms for mining distance-based outliers in large datasets (Citeseer, 1998), pp. 392–403
37. S Ramaswamy, R Rastogi, K Shim, inACM Sigmod Record, vol. 29. Efficient algorithms for mining outliers from large data sets (ACM, 2000), pp. 427–438
38. M Sugiyama, S Nakajima, H Kashima, PV Buenau, M Kawanabe, in
Advances in neural information processing systems. Direct importance estimation with model selection and its application to covariate shift adaptation (Neural Information Processing Systems Foundation, Inc., 2008), pp. 1433–1440
39. S Hido, Y Tsuboi, H Kashima, M Sugiyama, T Kanamori, Statistical outlier detection using direct density ratio estimation. Knowl. Inf. Syst.26(2), 309–336 (2011)
40. B Schölkopf, JC Platt, S-J Taylor, AJ Smola, RC Williamson, Estimating the support of a high-dimensional distribution. Neural Comput.13(7), 1443–1471 (2001)
41. CC Aggarwal, PS Yu, inACM Sigmod Record, vol. 30. Outlier detection for high dimensional data (ACM, 2001), pp. 37–46
42. MA Maloof,Machine learning and data mining for computer security: methods and applications. (Springer, 2006)
43. S Dua, X Du,Data mining and machine learning in cybersecurity. (CRC press, 2016)
44. KDD Cup 1999 Dataset, 1 (1999). Available from:http://kdd.ics.uci.edu/ databases/kddcup99/kddcup99.html
45. NSL-KDD Dataset. Available from:http://www.unb.ca/cic/datasets/nsl. html
46. MR Kabir, AR Onik, T Samad, A network intrusion detection framework based on Bayesian network using Wrapper Approach. Int. J. Comput. Appl.166(4) (2017)
47. L Xiao, Y Chen, CK Chang, inComputer Software and Applications Conference Workshops (COMPSACW), 2014 IEEE 38th International. Bayesian model averaging of Bayesian network classifiers for intrusion detection (IEEE, 2014), pp. 128–133
48. M Marchetti, M Colajanni, F Manganiello,Identification of correlated network intrusion alerts. (IEEE, Milan, Italy, 2011), pp. 15–20 49. N Bergman,Recursive bayesian estimation, vol. 579. (Department of
Electrical Engineering, Linköping University, Linköping Studies in Science and Technology Doctoral dissertation, 1999)
50. G Birkhoff, Lattice theory. Am. Math. Soc.25(1940) 51. M Barbut,Ordre et classification. (Hachette, 1970)
52. R Wille, inOrdered sets. Restructuring lattice theory: an approach based on hierarchies of concepts (Springer, 1982), pp. 445–470
53. B Ganter, R Wille, Formal concept analysis. Wiss. Z.-Tech. Univ. Dresd.45, 8–13 (1996)
54. K Bertet,Structure de treillis: contributions structurelles et algorithmiques: quelques usages pour des données images, Thesis for habilitation. (Université de La Rochelle, 2010)
55. V Legrand,Confiance et risque pour engager un échange en milieu hostile. (INSA, Lyon, 2013)
56. A Sabelfeld, AC Myers, Language-based information-flow security. IEEE J. Sel. Areas Commun.21(1), 5–19 (2003)
57. F Goichon, G Salagnac, P Parrend, S Frénot, Static vulnerability detection in Java service-oriented components. J. Comput. Virol. Hacking Tech. 9(1), 15–26 (2013)
58. J Newsome, D Song,Dynamic taint analysis for automatic detection, analysis, and signature generation of exploits on commodity software. (Internet Society, 2005), pp. 1–17
59. T Terauchi, A Aiken, inInternational Static Analysis Symposium. Secure information flow as a safety problem (Springer, 2005), pp. 352–367
60. M Ussath, F Cheng, C Meinel, inNetwork Operations and Management Symposium (NOMS) 2016 IEEE/IFIP. Event attribute tainting: a new approach for attack tracing and event correlation (IEEE, 2016), pp. 509–515
61. M Ussath, F Cheng, C Meinel, inComputational Intelligence (SSCI) 2016 IEEE Symposium Series on. Automatic multi-step signature derivation from taint graphs (IEEE, 2016), pp. 1–8
62. M Rhodes-Ousley,Information Security: the complete reference. (McGraw-Hill Education, 2013)
63. T Hamed, JB Ernst, SC Kremer, inComputer and Network Security Essentials. A survey and taxonomy of classifiers of intrusion detection systems (Springer, 2018), pp. 21–39
64. G Kim, S Lee, S Kim, A novel hybrid intrusion detection method integrating anomaly detection with misuse detection. Expert Syst. Appl. 41(4), 1690–1700 (2014)
65. L Mehrotra, PS Saxena, inInformation and Communication Technology. An assessment report on: statistics-based and signature-based intrusion detection techniques (Springer, 2018), pp. 321–327
66. DE Denning, PG Neumann,Requirements and model for IDES-a real-time intrusion detection expert system. (Document A005, SRI International, 1985), p. 333
67. DE Denning, An intrusion-detection model. IEEE Trans. Softw. Eng.2, 222–232 (1987)
68. H Debar, A Wespi, inInternational Workshop on Recent Advances in Intrusion Detection. Aggregation and correlation of intrusion-detection alerts (Springer, 2001), pp. 85–103
69. CT Kawakani, S Barbon, RS Miani, M Cukier, BB Zarpelão, Discovering attackers past behavior to generate online hyper-alerts. iSys-Revista Brasileira de Sistemas de Informação.10, 122–147 (2017)
70. Y Zhang, T Liu, J Shi, P Zhang, H Zhang, J Ya, An automatic multi-step attack pattern mining approach for massive WAF alert data. Scanning. 4514, 5.97 (2015)
71. F Cuppens, A Miege, inSecurity and privacy, 2002. proceedings 2002 ieee symposium on. Alert correlation in a cooperative intrusion detection framework (IEEE, 2002), pp. 202–215
72. W Kanoun, N Cuppens-Boulahia, F Cuppens, J Araujo, inRisks and Security of Internet and Systems, 2008. CRiSIS’08. Third International Conference on. Automated reaction based on risk analysis and attackers skills in intrusion detection systems (IEEE, 2008), pp. 117–124 73. Z Inayat, A Gani, NB Anuar, MK Khan, S Anwar, Intrusion response
systems: foundations, design, and challenges. J. Netw. Comput. Appl.62, 53–74 (2016)
74. S Salah, G Maciá-Fernández, JE Díaz-Verdejo, A model-based survey of alert correlation techniques. Comput. Netw.57(5), 1289–1317 (2013) 75. T Bass, Intrusion detection systems and multisensor data fusion.
Commun. ACM.43(4), 99–105 (2000)
76. P Garcia-Teodoro, J Diaz-Verdejo, G Maciá-Fernández, E Vázquez, Anomaly-based network intrusion detection: techniques, systems and challenges. Comput. Secur.28(1), 18–28 (2009)
77. J Viinikka, H Debar, L Mé, R Séguier, inProceedings of the 2006 ACM Symposium on Information, computer and communications security. Time series modeling for IDS alert management (ACM, 2006), pp. 102–113 78. S Shin, S Lee, H Kim, S Kim, Advanced probabilistic approach for network
intrusion forecasting and detection. Expert Syst. Appl.40(1), 315–322 (2013)
79. F Manganiello, M Marchetti, M Colajanni, inInternational Conference on Information Security and Assurance. Multistep attack detection and alert correlation in intrusion detection systems (Springer, 2011), pp. 101–110 80. S Mabu, C Chen, N Lu, K Shimada, K Hirasawa, An intrusion-detection
model based on fuzzy class-association-rule mining using genetic network programming. IEEE Trans. Syst. Man Cybern. B Appl. Rev.41(1), 130–139 (2011)
81. J Navarro Lara, A Deruyver, P Parrend, inIEEE Symposium Series on Computational Intelligence (IEEE SSCI 2016). Morwilog: an ACO-based system for outlining multi-step attacks (IEE, 2016), pp. 1–8 82. R Zuech, TM Khoshgoftaar, R Wald, Intrusion detection and big
heterogeneous data: a survey. Journal of Big Data.2(1), 3 (2015). Springer 83. NN Diep, Intrusion detection using deep neural network. Southeast
Asian J. Sci.5(2), 111–125 (2017)
![Fig. 1 The attack timeline for zero-day attacks [12]](https://thumb-us.123doks.com/thumbv2/123dok_us/874922.1584995/3.595.58.542.554.721/fig-attack-timeline-zero-day-attacks.webp)
![Fig. 2 The APT life-cycle by Mandiant [16]](https://thumb-us.123doks.com/thumbv2/123dok_us/874922.1584995/4.595.58.541.542.723/fig-the-apt-life-cycle-by-mandiant.webp)
![Fig. 4 Example of reach_dist for several points [27]](https://thumb-us.123doks.com/thumbv2/123dok_us/874922.1584995/8.595.57.290.85.244/fig-example-reach-dist-points.webp)
![Fig. 5 Sequence space for two applications a ftpd (File Transfer Protocol Daemon) and b lpr (Line PRinter) [26]](https://thumb-us.123doks.com/thumbv2/123dok_us/874922.1584995/9.595.57.541.86.339/sequence-space-applications-file-transfer-protocol-daemon-printer.webp)
![Table 2 Performance comparison of algorithms in Wekaworkbench on the KDD99 dataset [4]](https://thumb-us.123doks.com/thumbv2/123dok_us/874922.1584995/10.595.304.538.430.734/table-performance-comparison-algorithms-wekaworkbench-kdd-dataset.webp)
![Fig. 7 High -level architecture for pseudo-Bayesian alert correlation [48]](https://thumb-us.123doks.com/thumbv2/123dok_us/874922.1584995/11.595.67.540.339.725/fig-high-level-architecture-pseudo-bayesian-alert-correlation.webp)
![Fig. 9 Signature derivation steps for tainted analysis of multi-step attacks [61]](https://thumb-us.123doks.com/thumbv2/123dok_us/874922.1584995/13.595.59.542.87.231/fig-signature-derivation-steps-tainted-analysis-multi-attacks.webp)
![Fig. 10 Example of graph signature in the EDL language [61]](https://thumb-us.123doks.com/thumbv2/123dok_us/874922.1584995/14.595.58.542.85.535/fig-example-graph-signature-edl-language.webp)