1Department of Mechanical Engineering, University of Idaho, 1776 Science Center Dr, Idaho Falls, ID, USA 2Department of Mechanical Engineering, University of Idaho, 440902 Moscow, ID, 83844-0902, USA
Received: 24 June 2011 – Revised: 23 August 2011 – Accepted: 24 August 2011 – Published: 30 September 2011
Abstract. This paper describes the computational simulation of contact zones between pebbles in a pebble bed reactor. In this type of reactor, the potential for graphite dust generation from frictional contact of graphite pebbles and the subsequent transport of dust and fission products can cause significant safety issues at very high temperatures around 900◦C in HTRs. The present simulation is an initial attempt to quantify the amount
of nuclear grade graphite dust produced within a very high temperature reactor.
1 Introduction
The gas-cooled graphite-moderated pebble bed reactor is a leading concept for the Next Generation Nuclear Plant, a Very High Temperature Reactor (VHTR) under considera-tion in the US. In the proposed reactor, spherical graphite pebbles (Fig. 1) are used as fuel elements. These graphite pebbles contain thousands of tristructural-isotropic (TRISO) fuel particles which are mainly made of enriched uranium. The graphite pebbles are inserted into the reactor from the top and they move downward due to gravity to reach the out-let chute where they go through burnup assay or fuel utiliza-tion. Here, the burnup limit of graphite pebbles is assessed to determine if they are to be recirculated or stored in the storage tank.
In VHTRs, the potential graphite dust generation is caused by several sources. These sources are pebble-pebble contact, pebble-wall contact, fuel handling which proceeds burnup assay and oxidation from impurities present in the helium coolant (Cogliati and Ougouag, 2008).
There are many disadvantages to dust production at very high temperatures in pebble bed reactors (PBR). In the presence of graphite dust, helium can become radioac-tive, reducing the efficiency of heat exchangers (Cogliati and Ougouag, 2010). In direct cycle HTGRs, the gener-ated graphite particulates collide with turbine blades and can considerably decrease their service life (Cogliati and Ougouag, 2010). The amount of graphite dust generated
Correspondence to: M. Rostamian
is a key input for design safety review (US Nuclear Reg-ulatory Commission, 2008; IAEA, 2003). The only pre-vious prediction of dust production was made for the Ger-man Arbeitsgemeinschaft Versuchsreaktor (AVR), which was around 3 kg yr−1(Xiaowei et al., 2005).
2 Computational model
In the present work, the simulations of pebble contact were conducted using the finite element software ABAQUS (ABAQUS FEA, 2010) to predict an initial estimate for PBR graphite dust production.
Two different configurations are considered: (1) two Quar-ter Spheres in contact (QS) model illustrated in Fig. 2a, and (2) a Body Centered Cubic (BCC) model l, in one pebble is in contact with eight other ones, as shown in Fig. 2b. The QS model is a simple model to start performing simulations but the BCC model is a more realistic configuration which better represents the conditions of pebbles in a PBR (du Toit et al., 2009).
Two types of simulations are also considered: (1) static simulations where pebble-pebble forces and friction at con-tact points are considered without pebble movements with respect to each other, and (2) dynamic simulations, where pebble-pebble forces, friction at contact points and rotation of the center pebble with respect to the neighboring ones is considered.
Figure 1. Graphite fuel elements in PBRs (Schaffer, 2007).
Figure 1.Graphite Fuel Elements in PBRs (Schaffer, 2007).
(a)
(b)
Figure 2. (a) QS and (b) BCC configurations. Symmetry conditions are imposed.
Figure 2.QS (a) and BCC (b) configurations. Symmery conditions are imposed.
The material properties were modeled by considering an elastoplastic stress-strain behavior coupled with ductile dam-age effects. A mesh refinement was considered to deter-mine the number of elements with damage values exceed-ing a minimum predetermined value. The extent of damage was used to determine the amount of mass removed. Finally, the results are discussed and compared with previous works (Cogliati and Ougouag, 2010; Xiaowei et al., 2005).
Figure 3. Stress‐strain curve for IG‐11.
Figure 3.Stress-strain curve for IG-11.
Table 1.Isotrpic plastic model data.
Yield Stress (MPa) Plastic Strain
45 005 500 0
48 779 700 0.0015747 53 811 900 0.0040155 58 765 500 0.0066925 63 247 300 0.0099206 67 414 600 0.0136999 71 739 100 0.0185028 74 962 900 0.0230694 77 557 600 0.0271636 79 287 400 0.0309429
2.1 Material properties
The nuclear grade graphite IG–11 with elastoplastic behav-ior at the strain rate of 0.0011s−1 is considered to determine
the extent of pebble damage due to contact and wear forces (Fig. 3 and Table 1).
2.2 Isotropic elastic model
From the stress-strain diagram shown in Fig. 3, the elastic properties are derived. The Young’s modulus and yield stress are found to be E=9.8 GPa. The Poisson ratio is also known to be 0.126 for this nuclear grade graphite (Yokoyama et al., 2008).
2.2.1 Isotropic plastic model
From the plastic portion of this stress-strain curve, the yield stress and the corresponding plastic strain are derived. The plastic stress-strain data input for ABAQUS to replica is shown in Table 1.
in this numerical simulation. The fracture strain (at specific strain rate) and stress triaxiality are needed to set this crite-rion. Once this limit is exceeded, elements are capable of being removed from the surface of the contact point. In this study, the damage is investigated macroscopically and IG-11 is considered as a continuous homogenous material.
In Table 2 stress triaxiality is simply found to be 0.333 because of material homogeneity in three directions.
2.3 Model setup
The simulation setup consists of two sections with two mod-els for pebble-pebble contact the QS model and the BCC model unit cell configuration. The latter represents a more realistic configuration of a pebble condition in contact with eight other ones.
2.3.1 QS Model
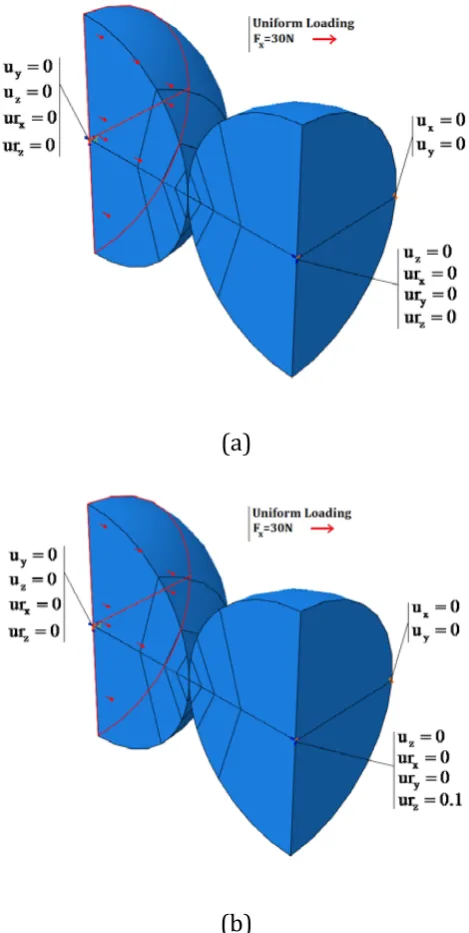
In this model, two quarter spheres are in contact and the boundary conditions and loads are set as illustrated in Fig. 4. In this figure, u represents translational velocity in m s−1and
ur represents rotational velocity in radians.
2.3.2 BCC Model
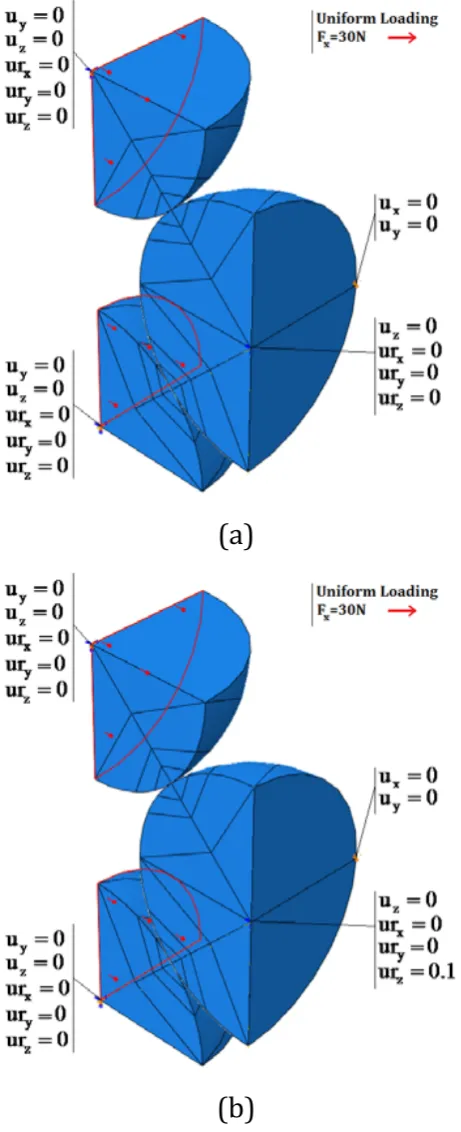
In this model, one quarter sphere is in contact with two eight-spheres representing a portion of a unit cell model, which is cut at its symmetrical planes. The boundary conditions and loads are set as in Fig. 5. In this figure, the model is reduced by considering the existing symmetry in the BCC configuration.
2.4 Simulation setup
The simulations are also carried out in two phases. A static simulation is performed where stationary pebble-pebble forces and friction at contact points are considered. In the static simulations, due to the linearity of the simula-tions, ABAQUS/Standard module has been implemented.
The boundary conditions, loads and constrains are illus-trated in Figs. 4a and 5a.
(a)
(b)
Figure 4. QS model boundary conditions and loads in static (a) and dynamic (b) phases (rotation in
radians).
Figure 4.QS model boundary conditions and loads in static (a) and dynamic (b) phases (rotation in radians).
The dynamic simulation considers pebble-pebble forces, friction at contact points and rotation of the center pebble. In the dynamic simulations, ABAQUS/Explicit module has been implemented to handle the nonlinearities caused by ro-tational velocity and contact mechanics. The boundary con-ditions, loads and constrains are illustrated in Figs. 4b and 5b.
(a)
(b)
Figure 5. BCC model boundary conditions and loads in static (a) and dynamic (b) phases (rotation
in radians).
Figure 5. BCC model boundary conditions and loads in static (a) and dynamic (b) phases (rotation in radians).
Figure 6. Mesh refinement study results: the optimum element size and stress.
Figure 6. Mesh refinement study results: the optimum element size and stress.
2.5 Mesh refinement study
Considering the elastic model, simulations were run for dif-ferent element sizes to perform a mesh refinement study (MRS); the MRS led to the optimal element size of 0.022 cm for the contact zone (Fig. 6).
This optimal element size helps reduce computational costs and time. The optimum mesh as identified from the MRS results in the optimal refinement of mesh in the contact zone, where results are sensitive to element size. Figure 6 presents the optimal mesh near the contact zone.
3 Results and discussions
In this section, first the von Mises stress contours and dam-age contours are illustrated and discussed briefly. Finally, an estimate of the mass removal from the surface of graphite pebbles is discussed.
3.1 Static simulation results
As seen in Fig. 7, in both configurations higher stresses are experiences at the tip of the contact area than those at the center-point. This is due to the deflection at the tip of the contact area which is itself a flat circle-shaped region per-pendicular to the figure plain.
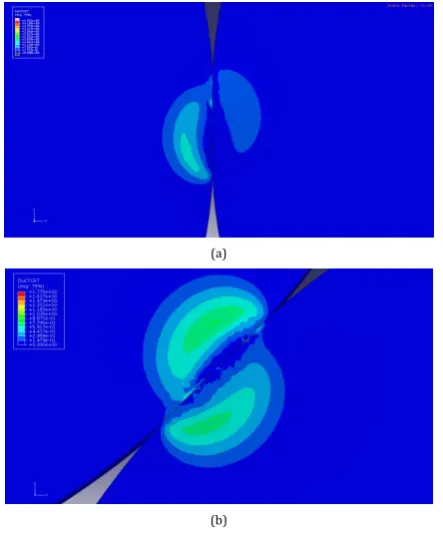
As seen in Fig. 8, higher damage is at the edges of the contact area due to higher local deformations.
3.2 Dynamic simulation results
As seen in Fig. 9, in both models higher stresses are expe-riences at the tip of the contact area than that at the center-point. This is due to the deformation at the tip of the contact area.
(a)
(b)
Figure 7. Contact zone refined mesh for (a) the QS and (b) BCC models.
Figure 7. Contact zone refined mesh for (a) the QS and (b) BCC models.
Note that, in the dynamic simulation, the damaged zones are not completely facing each other due to the axial rotation of one pebble against the other.
As seen in Figs. 10 and 11, higher stress and damage are experienced at the edges of the contact area due to higher local deformations.
The contact zone is a circular area which is perpendicular to the figure plains whose upper and lower edges experience high stresses and therefore high damages.
4 Dust mass prediction
Based on the damage results, by probing the elements in the damaged region and tallying the damage criterion at each damaged element, the number of elements that were capable of removal due to excessive damage was counted and there-fore an estimate of the mass removal was predicted.
In the Static simulation, no elements passed the damage criterion in the QS model and as a result the mass removal estimate was predicted to be zero; while in the static BCC model given the density of 1.77 g cm−3(Yoda and Eto, 1983),
an estimate of 5.9 g yr−1was predicted.
(b)
Figure 8. Von Mises stress contours at the contact points for (a) QS and (b) BCC models.
Figure 8. Von Mises stress contours at the contact points for (a) QS and (b) BCC models.
(a)
(b)
Figure 9. Damage contours at the contact points for (a) QS and (b) BCC models.
Figure 9. Damage contours at the contact points for (a) QS and (b) BCC models.
(a)
(b)
Figure 10. Von Mises stress contours at the contact points for (a) QS and (b) BCC models.
Figure 10. Von Mises stress contours at the contact points for (a) QS and (b) BCC models.
(a)
(b)
Figure 11. Damage contours at the contact points for (a) QS and (b) BCC models. Figure 11. Damage contours at the contact points for (a) QS and (b) BCC models.
Table 3.Mass removal prediction.
Sinulation Model Mass
(g yr−1)
Static QS Static BCC Dynamic QS Dynamic BCC Cogliati’s Results
(Cogliati and Ougouag, 2010) 0.0 5.9 6.5 6.7 4.0
In the dynamic simulation which was a more realistic one, the QS model mass removal estimate was 6.5 g yr−1, while it was 6.7 g yr−1for the BCC model. Table 3 shows a compar-ison between the results of the current model and those by Cogliati (2010).
The dust production estimate of 6.5 to 6.7 grams per year is very low compared to an estimated of 3 kg per year in the German AVR (Moormann, 2009).
There are a number of reasons which make the present ini-tial estimate more reliable as compared to AVR observations. The main reason there is a difference of three orders of mag-nitude between our results and that of AVR is that in this dust production prediction model, only pebble-pebble con-tacts are considered while, as mentioned earlier, there are a number of sources to graphite dust generation (Cogliati and Ougouag, 2010).
Another influential factor is the material properties; while temperatures of about 900◦C are experienced in a PBR, the
only material parameters available at this point are at room temperature from (Yokoyama et al., 2008). Also, it is un-certain how much of the dust produced in AVR, was a result of mechanical wear, as opposed to other sources. The dust production in AVR was observed by annually removing the filter and measuring the amount of dust, which is generated from different sources such as oil ingress, air ingress, metal-lic components and pebble handling.
5 Conclusions
The advantage of performing numerical analyses is to achieve an estimate of the mass of graphite removed per working year of an NGNP during its service period. This order of magnitude of estimate can be an approximate input for safety design of PBRs. This estimate is a good agreement with those in the literature. However, more investigations are in progress to enhance the accuracy of the prediction of dust generation in PBRs. Considering a wear model to calculate the wear mass based on the contact normal forces leads to re-sults of higher accuracy and dependability. Performing simu-lations for various pebble-pebble configurations can also lead to better evaluation the wear mass.
ABAQUS FEA: SIMULIA web site, Dassault Syst`emes, www. simulia.com, last access: May 2010.
Cogliati, J. and Ougouag, A. M.: Pebble Bed Reactor Dust Pro-duction Model, Proceedings of ASME 4th International Topical Meeting on High Temperature Reactor Technology, HTR2008-58289, available at: http://www.inl.gov/technicalpublications/ Documents/4074915.pdf, 2008.
Cogliati, J. J. and Ougouag, A. M.: Dust Production Model for HTR-10, INL Report, 2010.
IAEA: Evaluation of High Temperature Gas Cooled Reactor Per-formance: Benchmark Analysis Related to Initial Testing of the HTTR and HTR-10, IAEA-TECDOC-1382, 2003.
Plant Phenomena Identification and Ranking Tables (PIRTs), NUREG/CR-6944, Main Report, 2008.
Xiaowei, L., Suyaun, Y., Zhen-sheng, Z., and Shu-yan, H.: Estima-tion of Graphite Dust Quantity and Size DistribuEstima-tion of Graphite Particle in HTR-10, Nuclear Power Engineering, 26, 0258-0926, 2005.
Yoda, S. and Eto, M.: The tensile deformation behavior of nuclear-grade isotropic graphite posterior to hydrostatic loading, J. Nucl. Mater., 118, 214–219, 1983.
Yokoyama, T., Nakai, K., and Futakawa, M.: Compressive Stress-Strain Characteristics of Nuclear-Grade Graphite IG-11: Effect of specimen size and strain rate, Journal of Japan Society of Nu-clear, 7, 66–73, 2008.