Fibre optic sensing system for monitoring of current
collectors and overhead contact lines of railways
Kerstin Schröder1, Manfred Rothhardt1, Wolfgang Ecke1, Uwe Richter2, André Sonntag2, and Hartmut Bartelt1
1Leibniz Institute of Photonic Technology, Albert-Einstein-Str. 9, 07745 Jena, Germany 2Eurailscout Inspection & Analysis b.v., Torellstr. 1, 10243 Berlin, Germany
Correspondence to:Kerstin Schröder (kerstin.schroeder@leibniz-ipht.de)
Received: 19 September 2016 – Revised: 16 December 2016 – Accepted: 26 December 2016 – Published: 6 February 2017
Abstract. Fibre optic sensors are excellent tools to use for monitoring high-voltage current collectors. Because of their small cross section and electrical neutrality, they are easily integrated into the current collector strip and are well specialized for detection of high-speed load events. The conventional contact force measurement with four force sensors below the collector strips can also be simplified by using fibre optic force and acceleration sensors.
1 Introduction
The deregulation of the European Union (EU) railway mar-ket and the necessary interoperability of railways and tracks has increased the need for easy-to-use online monitoring of railway tracks and catenaries (in the best case available daily). Great efforts have been put into the development of overhead contact line (OCL) monitoring systems. Permanent monitoring of the load conditions allows the prediction of the resulting wear, and helps to optimize service and repair cycles on the OCL.
Some measurement techniques for OCL monitoring, such as contact force measurements between pantographs and the OCL, are already well established. Boundary conditions are defined in a European standard (EN 50317). Other tech-niques, for instance the detection of disturbances (misalign-ments or intruders), are still under development or under op-timization.
For heavy load trains or steep tracks, some trains are driven with two locomotives and two pantographs. Because of strong dynamics of the catenary, this can often lead to con-tact loss of the second pantograph. In such cases, measure-ment and control of the contact force is of high interest.
Measurements at the interface between OCLs and current collectors with electrical sensors are complex and prone to interference from the high electrical voltages and the strong changes in electric and magnetic fields. In contrast, fibre
op-tic sensors have the potential of easy access to such measure-ments due to their small size, immunity to electromagnetic fields, and their intrinsic electrical insulation. For this rea-son, research is currently underway to utilize fibre optic sen-sors for monitoring purposes in current collectors and OCLs (Schröder et al., 2012; Theune et al., 2004; Boffi et al., 2009). Maladjusted catenary elements or intruders into the cate-nary region cause hits on the current collectors. They can damage the carbon of the collector strip and cause serious traffic incidents. In Fig. 1, two used collector strips are shown with their typical stress marks. At the edges, smaller or big-ger parts of the carbon have been chipped away. The lower photograph shows a seriously damaged collector strip. Such a strip can seriously damage the OCL.
The aim of this sensing system is the detection of low-level hits already below the damage threshold, in order to identify sources of damages in a very early state and to provide timely maintenance on demand.
sen-78 K. Schröder et al.: Fibre optic sensing system
Figure 1.Top: used collector strip with clear abrasion marks on the edges. Bottom: used collector strip with serious damage.
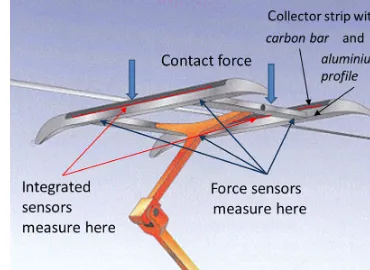
sors and their instrumentation. In this paper, results are re-ported from the investigation of two different measuring techniques: quantitative logging of (i) fast hit events and (ii) the stationary acceleration-compensated contact force measurement (Fig. 2).
2 FBG sensor interrogating system
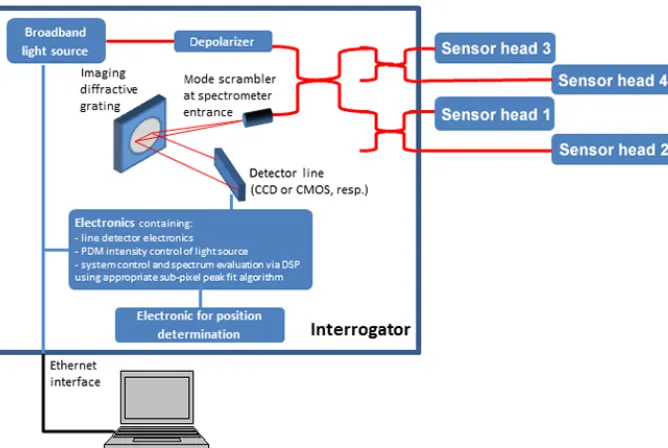
There are different ways known to interrogate load results from FBG sensors. The sensor system used in these studies is based on a broadband light source and a line-based com-pact spectrometer with a photo-detector line, comprising de-polarization components, fibre optic connectors to four sen-sor lines, fast- and low-noise digital signal processen-sor (DSP) electronics, Ethernet data communication, and a break-free power supply (Fig. 3).
All these components are placed in a box with dimensions of 18 cm×28 cm×10 cm, allowing easy integration into a locomotive. The interrogation unit can simultaneously read 32 FBG sensors at 5000 measurements per second, with a strain resolution of about 1 µm m−1per sensor. In order to ob-tain the position of measured events along the rail track, the position data of the locomotives are fed directly into the in-terrogator’s DSP and recorded simultaneously with the load data. For stabilization of long-term contact force measure-ments, two fibre optic depolarizers (Lyot type at the light source and a spatial mode mixer in front of the spectrometer, respectively) minimize the influences of FBG birefringence and polarization dependencies of the spectrometer. The tem-perature dependence of the spectrometer was measured in a calibration procedure. So, no measurement drifts occur and the strain measurement errors are within±1 µm m−1. Each sensor head, which is mounted below the collector strip, comprises an FBG force sensor and an FBG acceleration sen-sor, which are integrated along a single optical fibre.
3 Integrated collector strip sensors
Because of their convenient small dimensions, the integration of fibre optic sensors, and especially of fibre Bragg gratings, is easily achieved inside the current collector. In this case, the sensors are very close to the interacting interface between the
Figure 2.Overhead contact line in contact with a pantograph head containing two collector strips with integrated sensors. Additional force sensors are included below the collector strips.
collector strip and the overhead contact line. The closer the sensors are to the interface, the more accurately the moni-toring of fast hits can be performed, because signal delays and mechanical damping are minimized. An integration of the sensor fibre into the interface between the carbon bar and the aluminium carrier before their assembly showed the best sensing performance and safety for the sensors.
The collector strip with integrated FBG sensors (shown schematically in Fig. 4) has provided outstanding application results for the detection and measurement of hard hits on the carbon bar in the driving (horizontal) direction.
3.1 Hit characteristics
Experiments showed two principal types of hit events: “soft hits” and “hard hits”.
“Soft hits” can be caused by short-term locomotive accel-erations, e.g. from rail steps or vibration of the pantograph on the catenary. Typical frequencies are 220 to 250 Hz with corresponding slow peak rise times of∼1 ms and low damp-ing. These “soft hits” can also be measured with acceleration sensors below the collector strips.
“Hard hits” are characterized by short rise times (50 to 200 µs) and strong attenuation (examples are given in Figs. 5 and 6). They can cause fast and strong reactions on the car-bon bar and on the embedded strain sensors, which can only be detected with a correspondingly fast measurement system and only in close vicinity to the hit point. “Hard hits” usually occur when the carbon bar is hit by OCL steps and kinks, or by intruders. They are dangerous for the carbon material and should be avoided.
Figure 3.The FBG sensor interrogating system contains a broadband light source (superluminescent diode), which is depolarized with an appropriate fibre optic depolarizer. The reflected signals from the FBGs in the four sensor heads are spectrally analysed in a compact spectrometer containing a mode scrambler for optimal entrance slit illumination, an imagine diffractive grating, and a line detector (charge-coupled device – CCD – for the “slow” version, CMOS for the interrogation speed of up to 5 kHz). The heart of the interrogator electronics is a digital signal processor (DSP), which controls the intensity of the light source via pulse duration modulation (PDM), corrects the temperature dependence, evaluates the peak spectra using appropriate sub-pixel approximation, integrates the position data, and sends the sensor data via an Ethernet interface to a displaying and saving device.
Figure 4. Collector strip with schematic representation of inte-grated fibre optical sensors (red). They are positioned on the bound-ary between the aluminium profile and the carbon bar, close to the edge, and were used successfully to detect hits in a horizontal (driv-ing) direction.
These “hard hits” can usually not be detected by sensors far from the interface, below the collector strips, but only with integrated sensors, because of the strong signal attenu-ation. The sensor system must interrogate at data rates of at least 5000 measurements s−1to be able to identify such hits. More detailed laboratory investigations of hit responses have been performed with 20 000 measurements s−1.
From such laboratory tests, the dependencies between sig-nal amplitude and hit energy have been found to be lin-ear for these collector strips, with a slope of 74 µm m−1J−1 (Schröder et al., 2013). This sensitivity depends slightly on the hit position along the collector strip. Since position detec-tion was not yet integrated into this specific system, a slight systematic error occurs for the energy estimation, such as in the example of the test run shown in Fig. 6.
Figure 5.Sensor response from a hit with a metal pendulum on the carbon bar (“hard hit”).
80 K. Schröder et al.: Fibre optic sensing system
Figure 6.Signal detected during a test run. Passing a section insu-lator at 37 km h−1caused this hit. The short rise time is typical for a “hard hit”. The energy of the hit was estimated to be 5.1 J.
low intensities. To classify these hits, an injury level had to be defined. It should be set below but close to the destruc-tion level. A general definidestruc-tion of a destrucdestruc-tion level only by a measured hit energy is not possible, because other fac-tors, such as hit area (close to the edge, hit with thin tip) and the history and quality of the carbon material, as well as the construction of the fixation of the collector strip within the pantograph, play important roles. In laboratory experi-ments with new collector strips hit with 50 J at the same point with a large-area mass, most strips crack after the third hit. But when a mass with a spherical tip is used, hit energies of 20 J can chip away parts of the carbon. Therefore the high-est alarm level was set at a hit energy of 20 J. For the col-lector strips under investigation, this would correspond to a strain maximum of about 1500 µm m−1. All events with a level below 200 µm m−1 are qualified as harmless. The de-tection limits of the measurement system are at a maximum of 4000 µm m−1and a minimum of 2 µm m−1, far above and below these injury levels, which allows us to fulfil this mea-surement task easily.
4 Contact force measurement
A first concept sought to use the collector strip as a bend-ing beam in order to transform stationary contact forces into strain, which can then be measured. However, an issue arose due to the low thermal conductivity of the upper strip mate-rial (carbon) and the different thermal elongation compared to the aluminium carrier sheet. This led to local heating by sunlight or a high electrical current, causing deformation of the strip, which was detected much earlier by the strain sen-sors compared to the true temperature change. The resulting errors are discussed in detail in Schröder et al. (2012).
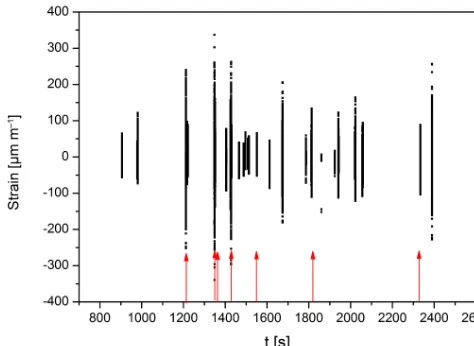
Figure 7.Part of a track measurement with an extraordinarily high density of events in a track region with many switches. The mea-sured strain data of identified events are given as point plots in black. Red arrows mark the events from “hard” hits. “Hard” hits can occur with high and low intensities. Hits under the level of 200 µm m−1 were identified as harmless, hits below the level of 1500 µm m−1as very serious.
As a consequence, the contact force measurement is now done with additional fibre optic force sensors fixed below the collector strips.
The contact forceFCbetween the contact line and the
col-lector strip is the sumFSof the forcesFimeasured below the
collector strips corrected by the inertial forcesFinon the
po-sitions of the force measurement and the aerodynamic force
Faer(Eq. 1) (Kießling et al., 2011).
FC=FS+Fin+Faer (1)
The aerodynamic forceFaeris dependent mainly on the pan-tograph, the collector strip geometry and the driving speed. The speed dependence needs to be measured in a calibration test run for each new set. With these calibration data, only the speed of the locomotive needs to be known for the cor-rection of aerodynamic forces. Therefore the contact force can be described as
FC=
4 X
i=1
Fi+
4 X
i=1
Fini+Faer(v). (2)
The inertial forces are calculated by
Fin=mabove· 4 X
i=1
ai, (3)
wheremaboveis the whole mass above the sensors andai are
the accelerations at the measurement pointsi.
To minimize the measurement uncertainty forFC by
Figure 8.(a)Homogeneous bending beam with definitions of pa-rameters.(b)Bending beam with varying thicknessh.(c)Bending beam with varying widthb.
4.1 Contact force sensors
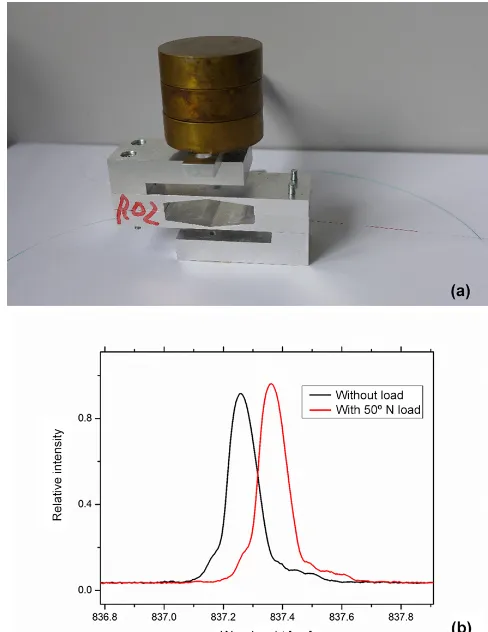
The contact force sensors are made as S-type force sensors (scheme in Fig. 10a, photograph in Fig. 9a).
It is important to understand that FBG sensors, compared to electrical strain gauges, show different properties when ap-plied across an inhomogeneous strain distribution. Electrical strain gauges usually integrate the strain distribution over the measuring area and show a “medium strain” when they see inhomogeneous strain distribution. In contrast, FBG sensors show a deformation of the Bragg spectrum, which can lead, depending on the kind of inhomogeneity and the interroga-tion algorithm, to significant measurement errors. In order to avoid a Bragg peak deformation under load, the transducer has been designed to have homogeneous surface strain in the region of the FBG under all load conditions. For a ver-tical point force at distancelon a bending beam of constant Young’s modulusE, of widthb, and heighth(definitions in Fig. 8a), the strainε(x)on the red line on the surface, where the sensor will be placed, depends onxaccording to
ε(x)= 6·F·(l−x)
E·b(x)·(h(x) )2. (4)
In order to obtain a strainεindependent ofx, i.e.ε(x)=ε0,
the width b and the height h of the bending beam can be varied independently.
Keeping the width constant, b(x)=b0, the heighth has to
follow the condition
h(x)=h0· r
1−x
l (5)
withh0the height at the beam rootx=0 (Fig. 8b).
Figure 9.(a)S-type difference sensor R02 with bending beams of varying thickness for force detection (with test masses as load). (b)The shape of the Bragg peak of sensors applied to sample R02 is not significantly changed if the sensor is loaded with 50 N.
Keeping the height constanth(x)=h0, the widthbhas to
follow the condition
b(x)=b0·
1−x l
(6)
withb0the width at the beam rootx=0 (Fig. 8c).
A robust construction with constant beam width was pre-pared by water jet cutting from an aluminium block (Fig. 9a). Fig. 9b shows that there is no deformation of the sensor spec-tra under load.
With this solution, the variety of materials is very limited because many high-strength materials are available mainly as panel sheets and get their strength from special surface con-ditioning. Using bending beams from panel sheets, one needs to work with a constant beam height and linear decrease in the width (similar to Fig. 8c). All the following examples work with such constructions.
Ni-82 K. Schröder et al.: Fibre optic sensing system
vaFlex 45/18 with an Rp0.2 of 500 and 1800 MPa, respec-tively.
A sensitivity of 14.9 µm m−1N−1 was achieved for the spring brass. With the steel NivaFlex 45/18, the sheet can be chosen to be much thinner while maintaining the same strength. With the thinner sheet, a higher sensitivity can be achieved. For all the following examples we worked with sensor samples from NivaFlex 45/18, which had a sensitivity of 22 µm m−1N−1. With a safety factor of 1.8 for the elas-tic deformation region, this allows a measurement range of up to 200 N. Using an interrogator with an accuracy within
±0.5 µm m−1, a measurement accuracy of ±23 mN can be achieved.
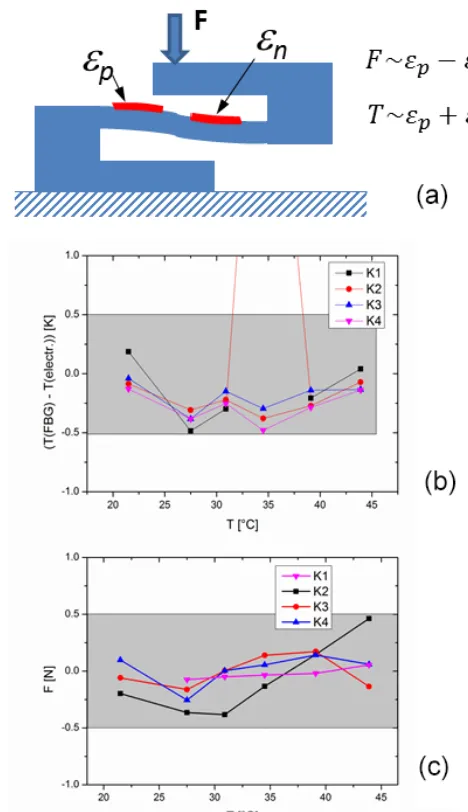
In general, the readout of strain sensors is cross-sensitive to temperature, and thus a specific concept is necessary for its compensation. As mentioned above, an anti-symmetric sen-sor with equal strain responses but opposite sign of the two single strain sensorsεpandεn(Fig. 10a) is used in this
con-cept. The force is calculated from the difference in the read-outs of both sensors, while temperature is calculated from their sum.
Temperature tests of four sensor heads, consisting of two double FBGs per sensor head, in an oven with temperatures between 20 and 45◦C, were performed in order to check this concept. The temperature reading from the sensors has an ac-curacy within±0.5◦C (Fig. 10b). The measured force read-ing change caused by temperature changes is within±0.5 N (Fig. 10c).
4.2 Acceleration sensors
In order to compensate for the measured force values for in-ertial forces, acceleration sensors are added to the contact force sensor heads.
Different types of FBG-based acceleration sensors can be found in the literature. In Antunes et al. (2011) and Jiang and Yang (2013) an FBG is stretched by a moving inertial mass. In Mita et al. (2001) and Au et al. (2008) a bending beam – or rather a cantilever-based FBG accelerometer – is investigated.
In our work, we developed two different types of cantilever-based FBG accelerometers. Both of them are based on bending beams, which are bent by the reaction of an inertial mass to acceleration. The bending beam has trian-gular width in order to generate a constant strain distribution (Eq. 6, Fig. 8c). Prototype no. 1 used a spring steel-bending beam with an FBG mounted 2 mm above the surface and a mass of 60 g fixed on the tip of the triangular bending beam. For the second prototype (no. 2), the mass was fixed by steel springs, and it drives an additional steel triangle with an attached FBG (see Fig. 11c). In this configuration, the mass holder springs and the sensor-bending beam can be op-timized separately.
Both types were tested for their sensitivities and resonance frequencies with the help of a shaker (TIRA S 51128). For
Figure 10.(a)Concept for temperature compensation: the sensor was designed in a way that a vertical force will induce a positive strain on sensorεpand a negative strain with the same magnitude
on sensorεn. Temperature changes induce forεpandεnreadings
with the same magnitude and the same sign. So, the differenceεn–
εpis independent of temperature but dependent on the applied force. (b)Accuracy of temperature measurements with four sensor heads in an oven at temperatures between 20 and 45◦C, in comparison to electrical temperature sensors.(c)The force readings of all sensor heads are temperature-independent.
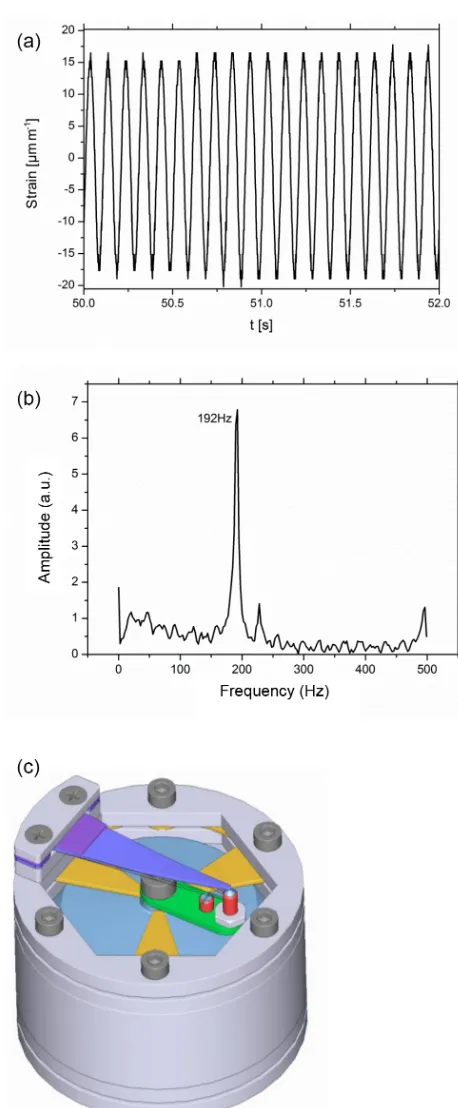
prototype no. 1, a sensitivity of 36 µm m−1G−1 (Fig. 11a) and a resonance frequency of 192 Hz (Fig. 11b) were mea-sured. For prototype no. 2, the sensitivity was strongly de-pendent on the fine adjustment. Sensitivities were measured in the range of 24 to 72 µm m−1G−1. The lowest resonance was weak, but at a very low frequency of approximately 86 Hz.
Figure 11.(a)Reaction of sensor prototype no. 1 to a sinusoidal excitation of frequency 10 Hz and amplitude 2.5 mm.(b)The reso-nance frequency of sensor prototype no. 1 is 192 Hz.(c)Design of sensor prototype no. 2. The mass (blue) of about 50 g was fixed with steel springs (yellow) and it moved the triangular bending beam (vi-olet) on top with the attached FBG sensor (not shown here).
Figure 12.Contact force sensor with an acceleration sensor in a test on a shaker. Detailed descriptions of the experiments are given in the text. Black: contact force results without acceleration compen-sation (very low noise during standstill). Red: contact force results with acceleration compensation (∼35 µm m−1G−1 and 192 Hz). An offset was added in the graphic. Green: contact force results in red, with a 20 Hz low-pass filter (corresponding to EN50317).
both types of sensors were vibrated together in the shaker. The force sensor was loaded with a mass exciting a gravity force of 15 N. Results of a sample measurement are given in Fig. 12. In segment 1, the system is undisturbed initially, but fixing the additional mass excites a strong high-frequency disturbance. This cannot be compensated for by the accelera-tion sensor (red curve). However, it is eliminated after appli-cation of a 20 Hz low-pass filter (green curve), as it is manda-tory in European standard EN50317. In segment 2, the mass is applied and the sensor is not moved. In segment 3, the shaker moved the sensor by a sinusoidal waveform pattern at a frequency of 10 Hz. The red curve (contact force with com-pensation of inertial force) is expected to be smooth in this section, and these expectations are fulfilled very well. After the mandatory filtering, a residual deviation from the 15 N force set value was kept within±0.5 N.
4.3 Sensor integration
The interface between the force sensor and the collector strip was developed by a third party. It fulfils the task of negligible low cross-sensitivities to further forces on the collector strip. The task of reproducible transition of the contact force from the collector strip to the sensor has not yet been solved by this technique; thus, a revision is under investigation.
4.4 First test drive
84 K. Schröder et al.: Fibre optic sensing system
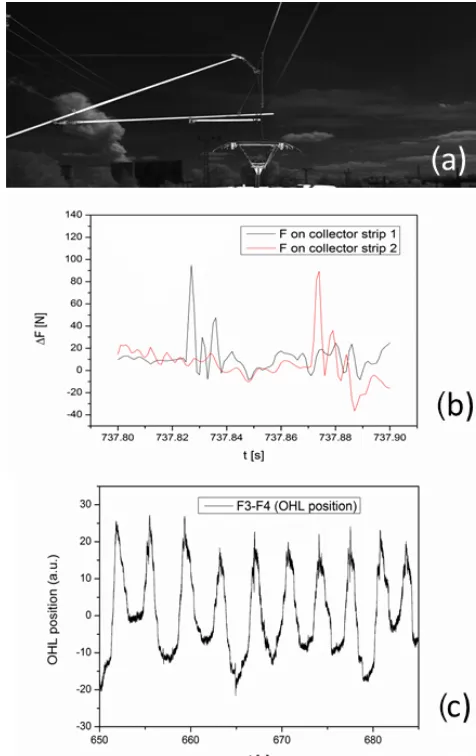
Three sensor heads were mounted below the collector strips (the fourth one was damaged shortly before the tests). The optical signal transmission was achieved by running fi-bre optic cables directly from the pantograph at 15 kV high voltage to the interrogator in the driver’s cabin. To avoid creepage currents on a dirty and wet cable surface, a 20 cm long section of the cable was embedded in a commercially available “creepage path elongation”. A video system moni-tored the pantograph and the catenary (Fig. 13a) during part of the test drive. From the video, a number of sudden changes in contact force were easily correlated with certain catenary elements (droppers, section insulators, switches, etc.).
This study focused on significant force changes only. However, force changes have been measured relative to a specified reference force value, which was set to the sensor system while the pantograph head was pressed to the cate-nary and the locomotive halted.
In Fig. 13b, an example is given where the locomotive passed a section insulator. The event occurred first on the leading collector strip. After a time delay of 50 ms, the same event was measured by the sensors mounted below the trail-ing collector strip. The strips were 60 cm apart and the loco-motive was travelling at a speed of 43 km h−1.
The OCLs run across the track in a zigzag pattern to ensure even wear on the current collector. The zigzag generates a continuous change in the position of the applied contact force on the collector strip. From the difference in the force sensor readings below one collector strip, this OCL position can be calculated. A typical example of a position plot of a right-hand curve is given in Fig. 13c.
5 Conclusions
Two FBG sensing systems have been developed for moni-toring the operational forces at the interface between current collectors and overhead contact lines of electrical railways: (i) fast force changes and impacts in the driving direction were detected by FBG sensors embedded in the collector strip; and (ii) vertical contact forces were detected by FBG-based force measuring heads below the collector strips, also comprising compensation of temperature changes as well as vertical acceleration.
The sensitivity and measurement speed of the sensor sys-tem have been proven to be sufficient for this monitoring task. However, the transducer mechanics of the force sensors and the reproducibility of the force results in dependence of dynamic force frequencies require further optimization.
6 Data availability
All data are stored at a database at the Leibniz-IPHT Jena (Germany), following the data policies of the institute.
Figure 13.(a)Measurement run on tracks of the railway of the lignite-fired power plant at Schwarze Pumpe – measurement panto-graph and overhead contact line with a cantilever.(b)The sum of the force sensor readings below one collector strip gives the whole force on this strip. Examining changes in these two forces can pro-vide information on catenary anomalies, like in this example. An “event” (mass point) was measured first by the leading collector strip 1 (adapted), and after 50 ms it is detected by the trailing, sec-ond collector strip of the pantograph head. Both show the same sig-nature pattern.(c)The difference in the force sensor readings be-low one collector strip gives the position of the overhead contact line (OHL) on the strip. Here the typical pattern of a right curve is shown.
ZIM (project no. KF2206912DB3), and by Eurailscout Inspection & Analysis b.v. The authors thank their supporters very much.
Edited by: J. Czarske
Reviewed by: two anonymous referees
References
Antunes, P., Varum, H., and André, P.: Uniaxial fiber Bragg grating accelerometer system with temperature and cross axis insensitivity, Measurement, 44, 55–59; doi:10.1016/j.measurement.2010.09.013, 2011.
Au, H. Y., Khijwania, S. K., and Tam, H. Y.: Fiber Bragg Grating Based Accelerometer, Proc. SPIE, 7004, 70042S-1–4, doi:10.1117/12.785992, 2008.
Boffi, P., Cattaneo, G., Amoriello, L., Barberis, A., Bucca, G., Boc-ciolone, M., and Collina, A.: Optical fiber sensors to measure col-lector performance in the pantograph-catenary interaction, IEEE Sens. J., 9, 635–640, doi:10.1109/JSEN.2009.2020244, 2009. Chojetzki, C., Rothhardt, M., Ommer, J., Unger, S., Schuster, K.,
and Mueller, H.-R.: High-reflectivity draw-tower fiber Bragg gratings – arrays and single gratings of type II, Opt. Eng., 44, 060101, doi:10.1117/1.1927517, 2005.
Kießling, F., Puschmann, R., and Schmieder, A.: Contact Lines for Electric Railways, Publicis, Munich, 91–94, 2011.
Mita, A. and Yokoi, I.: Fiber Bragg grating accelerometer for buildings and civil infrastructures, Proc. SPIE, 4330, 479–486, doi:10.1117/12.434148, 2001.
Schröder, K., Ecke, W., Kautz, M., Willett, S., and Jenzer, M.: An approach to continuous on-site monitoring of contact forces in current collectors by a fiber optic sensing system, Opt. Laser Eng., 51, 172–179, doi:10.1016/j.optlaseng.2012.08.007, 2012. Schröder, K., Ecke, W., Kautz, M., Willett, S., Unterwaditzer, H.,
Bosselmann, T., and Rothhardt, M.: Smart current collector – fibre optic hit detection system for improved security on rail-way tracks, Meas. Sci. Technol., 24, 1–9, doi:10.1088/0957-0233/24/11/115104, 2013.