Stress Response Versus Stress Tolerance: A Transcriptome
Analysis of Two Rice Lines Contrasting in Tolerance
to Phosphorus Deficiency
Juan Pariasca-Tanaka&Kouji Satoh&Terry Rose& Ramil Mauleon&Matthias Wissuwa
Received: 7 July 2009 / Accepted: 29 September 2009 / Published online: 15 October 2009 #Springer Science + Business Media, LLC 2009
Abstract Transcriptional profiling has identified genes associated with adaptive responses to phosphorus (P) deficiency; however, distinguishing stress response from tolerance has been difficult. We report gene expression patterns in two rice genotypes (Nipponbare and NIL6-4 which carries a major QTL for P deficiency tolerance (Pup1)) grown in soil with/without P fertilizer. We tested the hypotheses that tolerance of NIL6-4 is associated with (1) internal P remobilization/redistribution; (2) enhanced P solubilization and/or acquisition; and (3) root growth modifications that maximize P interception. Genes respond-ing to P supply far exceeded those differrespond-ing between
genotypes. Genes associated with internal P remobilization/ redistribution and soil P solubilization/uptake were stress responsive but often more so in intolerant Nipponbare. However, genes putatively associated with root cell wall loosening and root hair extension (xyloglucan endotrans-glycosylases/hydrolases and NAD(P)H-dependent oxidore-ductase) showed higher expression in roots of tolerant NIL6-4. This was supported by phenotypic data showing higher root biomass and hair length in NIL6-4.
Keywords Phosphorus uptake . Phosphorus efficiency . Pup1 . Root growth . Root hairs . Cell wall
Introduction
About 5.7 billion hectares worldwide lack sufficient plant-available phosphorus (P) to support high crop productivity (Batjes 1997), and almost 50% of rice (Oryza sativa L.) soils are currently considered P deficient. Though this deficiency could be corrected through fertilizer application, many farmers in low-input farming ecosystems are too resource poor or simply do not have access to P fertilizers (Kirk et al. 1998). Furthermore, suitable high-grade rock phosphates represent a finite resource near depletion (Runge-Metzger 1995). Efforts are therefore being made to develop cultivars with improved tolerance to P deficiency (Ismail et al.2007).
Phosphorus is one of the least mobile nutrients in the soil because it is readily bound by soil particles. Plants typically react to such low P availability with a series of adaptive responses that maximize Pi interception through modifica-tions in root growth, enhance P acquisition efficiency through efficient Pi uptake mechanisms combined with exudation of P solubilizing compounds, and improve internal Raw data files have been submitted to GEO (http://www.ncbi.nlm.nih.
gov/geo/) and will be publicly available as entry GSE6187— Comparative gene expression analysis between Nipponbare and NIL6-4 under two conditions.
Electronic supplementary material The online version of this article (doi:10.1007/s12284-009-9032-0) contains supplementary material, which is available to authorized users.
J. Pariasca-Tanaka
:
T. Rose:
M. Wissuwa (*)Crop Production and Environment Division, Japan International Research Center for Agricultural Sciences (JIRCAS),
1-1 Ohwashi,
Tsukuba, Ibaraki 305-8686, Japan e-mail: wissuwa@affrc.go.jp
K. Satoh
Unit of Plant Genome Research,
National Institute of Agrobiological Sciences (NIAS), 2-1-2 Kannondai,
Tsukuba, Ibaraki 305-8602, Japan
R. Mauleon
P use efficiency as a result of rapid P remobilization and retranslocation. For more detailed reviews, the reader may be referred to recent reviews by Karandashov and Bucher (2005), Raghothama and Karthikeyan (2005), and Lambers et al. (2006).
Microarray studies in Arabidopsis thaliana (Hammond et al.2003; Misson et al.2005; Morcuende et al.2007) and rice (Wasaki et al. 2003; Wang et al.2006; Wasaki et al. 2006) have confirmed the Pi responsiveness of many gene families involved in Pi acquisition and P remobilization and redistribution. Despite the valuable insights gained from these studies, it has so far been difficult to draw practically relevant conclusions because distinguishing stress response mechanisms/genes from those leading to elevated tolerance remains difficult. Furthermore, attempts to improve toler-ance to P deficiency through transgenic approaches have so far not yielded great success. Overexpression of the root-specific high-affinity transporter gene HORvuPht1;1 from barley did not enhance P uptake of transgenic plants grown in soil or in hydroponics although the authors had shown in an initial experiment that HORvuPht1;1 overexpression increased P uptake in cultured rice cells (Rae et al.2003, 2004). A phytase gene fromAspergillus nigerin transgenic Trifolium subterraneum improved P uptake of plants supplied with phytate and grown in agar under sterile conditions (Richardson et al.2001), but this positive effect was not always seen in soil-grown plants (George et al. 2005), possibly because phytate was bound to soil particles and therefore not available as a substrate for phytase.
This very limited success highlights the need to bridge the gap between studies focusing on P response (mostly in nutrient solutions) and more soil or field-based studies with genotypes that do exhibit some degree of tolerance to P deficiency. Considerable genotypic variation in the ability to acquire P under P-deficient field conditions was observed in rice (Fageria and Baligar 1997; Wissuwa and Ae 2001a), and a major QTL for P deficiency tolerance, Pup1forP-uptake1, was fine-mapped to a region between 15.1 and 15.6 Mb on chromosome 12 (Wissuwa et al. 2002). Near-isogenic lines (NILs) carrying the Pup1 allele from tolerant donor parent “Kasalath”consistently showed up to fourfold higher P uptake, dry weight, and grain yield compared to the intolerant recurrent parent “Nipponbare” (Wissuwa and Ae 2001b; Wissuwa 2005). Because P deficiency is a major problem in upland or drought-prone rain-fed lowland (nonirrigated) systems, previous studies (Wissuwa and Ae 2001b; Wissuwa 2005) and the study presented here were conducted under “upland” conditions. While the intolerant donor parent “Nipponbare” is a lowland cultivar, NIL6-4 is near identical; hence, studies under upland conditions charac-terize the response of thePup1 locus in typical drought-prone environments.
To characterize the response to P deficiency of Nipponbare and one of its P deficiency-tolerant NILs (NIL6-4) at the molecular level, we conducted a micro-array (Agilent 22 k) study using root and shoot samples from plants grown in soil at two P levels. Annotations of candidate genes at the fine-mapped Pup1 locus have not revealed any gene related to mechanisms known to directly affect P uptake or P metabolism (Heuer et al. 2009), and only two of the genes present at thePup1locus are present on the Agilent 22 k array. It was therefore not the objective of this study to identify Pup1 candidate genes but rather to identify tolerance mechanisms and regulatory patterns affected by the Pup1 locus. In particular, we tested the hypotheses that NIL6-4 is more tolerant to P deficiency due to the differential regulation of genes associated with (1) internal P use efficiency due to more efficient Pi remobilization; (2) enhanced P acquisi-tion through efficient Pi uptake or soil P solubilizaacquisi-tion; and (3) modifications in root growth that maximize Pi interception. An additional objective was to differentiate stress response from stress tolerance genes.
Results
Phenotype
Expression profiling of Nipponbare and NIL6-4 with the 22 k Agilent array
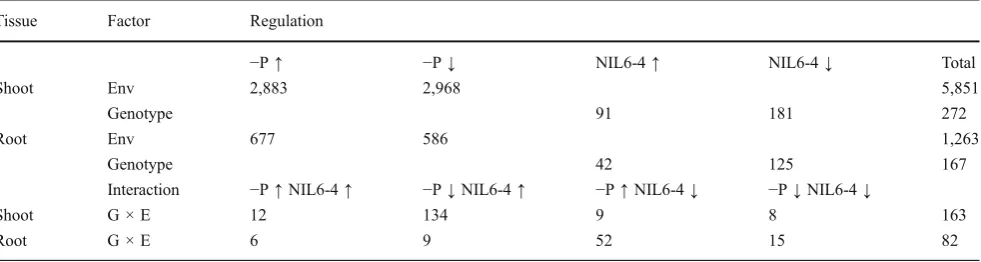
A total of 5,851 probes in shoots and 1,263 in roots were significantly regulated by the environmental (E) factor P supply (p≤0.001, Table 2; the complete list of genes is provided in supplementary Table S1). Of these, the proportion of genes upregulated under P deficiency was roughly equal to the number of downregulated genes in both tissues. A considerable overlap between significantly regulated genes in shoots and roots was detected with 498 of 1,263 (39%) of root genes also detected in shoots (Fig.1a).
Whereas 27% or 6% of all probe sets present in the array were significantly affected in shoots or roots by the factor environment, less than 2% (272) or 1% (167) were affected in respective tissues by the factor genotype (G) (Table2). The large majority of significantly regulated genes therefore
showed very similar expression patterns in both genotypes. Where genotypic differences existed, the typical pattern was a downregulation in NIL6-4 relative to Nipponbare. The overlap between both tissues was almost identical for the factor G (38% or 63 of 167 root genes also being detected in shoots) as previously detected for factor E (39%) (Fig.1b). Among the 63 genes detected in both root and shoot, almost 80% were expressed at a lower level in NIL6-4, suggesting that Nipponbare was more affected by P deficiency in both tissues.
For a small group of genes, significant G × E interactions were detected (Table 2). Interestingly, the interaction pattern differed considerably between shoots and roots. In shoots, 134 genes (82%) were in the category “−P ↓ NIL6-4 ↑,” indicating that they were generally downregulated under P deficiency but less so in NIL6-4. In roots, the predominant category with 52 genes (63%) was characterized by an upregulation under P deficiency that
Table 1 Dry Weight, P Concentration, and Derived Parameters in Shoot and Root Samples Taken from an Experiment Conducted Parallel to the Microarray Experiment
Days P level Genotype Shoot dry weight Shoot P concentration Root dry weight Root P concentration Plant P content g plant−1 mg g−1 g plant−1 mg g−1 mg plant−1
40 −P Nipponbare 0.61 0.77 0.42 0.95 0.86
NIL6-4 0.76 ns 0.82 ns 0.49 ns 0.90 ns 1.07 ns
+P Nipponbare 2.94 1.51 1.18 1.82 6.63
NIL6-4 2.19 ns 1.70 ns 1.06 ns 1.89 ns 5.72 ns
85 −P Nipponbare 1.93 0.63 0.74 0.93 1.91
NIL6-4 3.68** 0.73* 1.33** 0.96 ns 3.96**
+P Nipponbare 9.60 1.32 3.43 1.75 18.69
NIL6-4 12.44 ns 1.28 ns 4.19 ns 1.72 ns 23.25*
Values are means of four replications; plants were grown in soil with (+P) or without (−P) P fertilizer. Microarray samples were taken from similar plants at 40 days after sowing
nsnot significant
*p≤0.05 (significant); **p≤0.01 (significant) based onttests between means of genotypes within sampling dates and P levels
Table 2 Number of Genes Significantly (p≤0.001) Upregulated or Downregulated by Factors Environment (P Supply) and Genotype Tissue Factor Regulation
−P↑ −P↓ NIL6-4↑ NIL6-4↓ Total
Shoot Env 2,883 2,968 5,851
Genotype 91 181 272
Root Env 677 586 1,263
Genotype 42 125 167
Interaction −P↑NIL6-4↑ −P↓NIL6-4↑ −P↑NIL6-4↓ −P↓NIL6-4↓
Shoot G × E 12 134 9 8 163
Root G × E 6 9 52 15 82
Envenvironment,−P↑upregulated by P deficiency,−P↓downregulated by P deficiency,NIL6-4↑upregulated in NIL6-4,−P↓downregulated in NIL6-4,−P↑NIL6-4↑upregulated by P deficiency and more so in NIL 6-4,−P↓NIL6-4↑downregulated by P deficiency but less so in NIL
occurred to a lesser extent in NIL6-4 (-P↑NIL6-4↓). Here, too, the more tolerant NIL6-4 appeared less affected by P deficiency compared to Nipponbare, which could reflect a somewhat lower level of stress experienced by the tolerant genotype even before phenotypic differences became significant.
However, this could have been due to (probe) sequence mismatches in NIL6-4 since the Agilent probe set is based on the Nipponbare sequence. An analysis of the chromo-somal regions introgressed from Kasalath indicated that 78 of 181 downregulated genes detected in shoots of NIL6-4 were located in introgression regions, while in root, 63 out of 125 genes (50%) were in those regions (supplementary Table S1). We therefore conclude that some artifacts due to
possible probe sequence mismatches affected our results to some degree.
Validation of the microarray
A set of significant genes which are related to P deficiency was selected to validate the microarray data through quantitative polymerase chain reaction (qPCR). They include lipid metabolism (Os02g31030, Os01g04920), phosphatases (Os01g56880, Os01g52230), organic acid (Os02g56310), P transporters (Os04g10750, Os10g30790, AK108907), and cell-wall-related genes (Os11g33270, Os04g51460, Os06g48160). Furthermore, the NAD(P)H-dependent oxidoreductase (Os10g02390) which had the largest fold difference in expression between genotypes was also included in this group. Microarray and qPCR data were in good agreement in terms of separating upregulation and downregulation, even if this opposite pattern was observed in different tissues but of the same probe (Table 3). Some quantitative differences were detected with qPCR data showing considerably higher fold changes for the P transporter OsPT8 (Os10g30790) and the glycerophospho-diesterase (Os02g31030) but slightly lower values for the NAD(P)H-dependent oxidoreductase (Os10g02390).
Table 3 Comparison of Microarray and qPCR Results in Selected Groups of Significant Genes
TIGR5 locus Shoot Root
MAsG MAsE qPCR-sG qPCR-sE MArG MA-rE qPCR-rG qPCR-rE
Os02g31030 3.6 15.4 3.2 1.9
Os01g04920 4.4 3.0 4.1 3.4
Os01g56880 3.3 3.1 3.7 2.4
Os10g30790 2.2 18.4 2.6 1.9
Os01g52230 −1.2 2.8 −1.6 2.3 7.1 1.6
Os04g10750 −1.9 −1.7 2.5 3.4
Os02g56310 2.8 5.1
Os05g41480 1.7 2.9
Os04g41680 6.5 2.6
AK108907 6.1 3.4 −1.7 −1.1
Os11g33270 2.4 4.5
Os04g51460 2.3 0.6
Os06g48160 2.2 3.0
Os10g02390 0.4 0.5 6.4 4.9
Data are presented as relative comparison (−P/+P) or (NIL6-4/Nipponbare). Data are the means of three independent replications. Effects highlighted in italic print are significant based on two-factorial ANOVAs conducted separately for array and qPCR data at confidence levelsp≤
0.001 (array) orp≤0.05 (qPCR)
MAsGmicroarray genotype effect,MAsEmicroarray environment effect,Os02g31030glycerophosphodiester phosphodiesterase,Os01g04920: glycosyl transferase, Os01g56880 purple acid phosphatase, Os10g30790 inorganic phosphate transporter 1–4, Os01g52230 phosphatase phospho1, Os04g10750 inorganic phosphate transporter 1–5, Os02g56310: protein kinase, Os05g41480 plastidic phosphate, Os04g41680
endochitinase A,AK108907Os high-affinity phosphate transporter 2, Os11g33270, Os04g51460, andOs06g48160xyloglucan endotransglu-cosylase/hydrolase,Os10g02390NAD(P)H-dependent oxidoreductase
209 63 104
Shoot Root
5353 498 765
Shoot Root
b) a)
Hypothesis 1NIL6-4 is tolerant to P deficiency due to the differential regulation of genes associated with internal P use efficiency.
Phosphatases
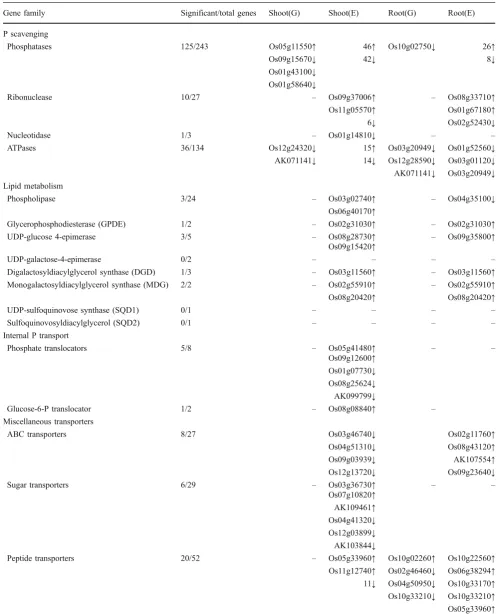
A group of 243 genes annotated as various types of phosphatases (based on TIGR5) was present in the array. P deficiency significantly affected the expression pattern of 88 genes in shoots and 34 genes in roots (Table 4; p≤ 0.001). In shoots, just over 50% of phosphatase genes were upregulated under P deficiency whereas about 80% were upregulated in roots, confirming that members of the phosphatase gene family are typically affected by P deficiency (Misson et al. 2005; Morcuende et al. 2007). However, our comparison between genotypes did not reveal a pattern that would suggest that phosphatases were associated with tolerance. In shoots, only four out of 243 phosphatases differed between genotypes with three having higher expression levels in Nipponbare. The one exception was a putative serine/threonine protein phosphatase (Os05g11550) with a 26% higher expression in NIL6-4. In roots, only one gene differed significantly between genotypes. This putative tartrate-resistant acid phosphatase (Os10g02750) was the most P-deficiency-inducible phos-phatase in roots with a sevenfold upregulation in both genotypes, albeit at a twofold higher overall level in Nipponbare. P deficiency also affected the expression of several putative ribonucleases, nucleotidases, and adenosine triphosphatases (ATPases) in both tissues, and the more common pattern was a downregulation (Table4). Genotypic differences were only detected for three root ATPases with Nipponbare having higher expression in all cases (Loc Os03g20949, Os12g28590, and AK071141).
Lipid metabolism
Of the 24 probes putatively annotated as phospholipases, only three showed altered gene expression in response to P deficiency, two being upregulated in shoots and one downregulated in roots (Table 4). Genotype effects were not significant. Alternatively, phospholipid degradation can occur via glycerophosphodiesterases, and one member of this gene family (Os02g31030) was strongly induced by P deficiency in shoots and roots, particularly in NIL6-4 (G × E,p≤0.001). However, overall, the genotype effect was not significant. In general, it appeared that phospholipid degradation was enhanced, possibly providing sufficient intermediates for subsequent steps in galactolipid and/or sulfolipid synthesis. Two genes coding for enzymes synthe-sizing the precursor in galactolipid synthesis, UDP-galactose, UDP-glucose-4-epimerase, and UDP-galactose-4-epimerase were induced by P deficiency but in a similar way in both
genotypes. The succeeding steps in galactolipid synthesis facilitated by monogalactosyldiacylglycerol synthase and digalactosyldiacylglycerol synthase were equally induced by P deficiency without differences between genotypes. In contrast to the increase in expression of galactolipid-synthesis-related genes, no change was detected for the second alternative lipid biosynthesis pathway. Sulfolipid-synthesis-related genes UDP-sulfoquinovose synthase (SQD1) and UDP-sulfoquinovosyl:DAG sulfoquinovosyl-transferase (SQD2) were not affected by G or E, which distinguishes our results from those obtained by others for Arabidopsis(Misson et al.2005; Morcuende et al.2007) or rice (Wang et al.2006).
Internal Pi transport
A group of genes related to the internal translocation of P including phosphate translocators, glucose-6-phosphate/ phosphate translocators (GPT2), ABC transporters, sugar transporters, and antiporters responded to P deficiency, and the response differed between shoots and roots. Transport-related genes were more likely downregulated than upregu-lated in shoots, but in roots an upregulation was the dominant pattern, particularly for ABC transporters and peptide transporters (Table4). Genotype effects were only significant for several peptide transporters and only in roots. The putative peptide transporter PTR2 showed a 1.25-fold higher expression (constitutively) in NIL6-4; however, for three other putative PTR2s, Nipponbare showed higher expression at an overall higher level.
Hypothesis 2 NIL6-4 is tolerant to P deficiency due to more efficient Pi uptake mechanisms combined with exudation of P solubilizing compounds.
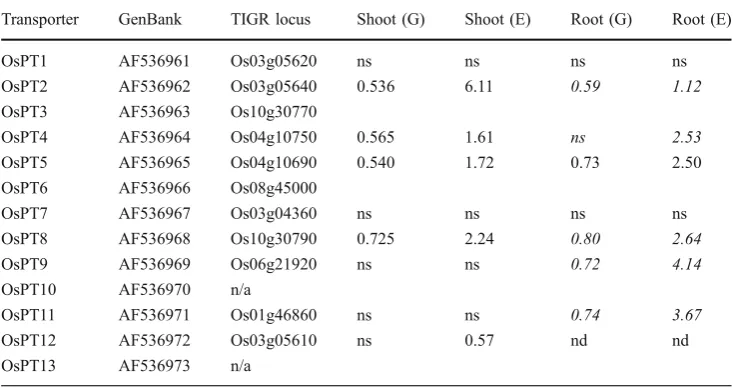
High-affinity Pi transporters
Table 4 Gene Families Associated with Internal Remobilization and Redistribution of P Differentially Regulated (p≤0.001) by P Deficiency (E) and Genotype (G)
Gene family Significant/total genes Shoot(G) Shoot(E) Root(G) Root(E)
P scavenging
Phosphatases 125/243 Os05g11550↑ 46↑ Os10g02750↓ 26↑
Os09g15670↓ 42↓ 8↓
Os01g43100↓ Os01g58640↓
Ribonuclease 10/27 – Os09g37006↑ – Os08g33710↑
Os11g05570↑ Os01g67180↑
6↓ Os02g52430↓
Nucleotidase 1/3 – Os01g14810↓ – –
ATPases 36/134 Os12g24320↓ 15↑ Os03g20949↓ Os01g52560↓
AK071141↓ 14↓ Os12g28590↓ Os03g01120↓ AK071141↓ Os03g20949↓ Lipid metabolism
Phospholipase 3/24 – Os03g02740↑ – Os04g35100↓
Os06g40170↑
Glycerophosphodiesterase (GPDE) 1/2 – Os02g31030↑ – Os02g31030↑
UDP-glucose 4-epimerase 3/5 – Os08g28730↑ – Os09g35800↑
Os09g15420↑
UDP-galactose-4-epimerase 0/2 – – – –
Digalactosyldiacylglycerol synthase (DGD) 1/3 – Os03g11560↑ – Os03g11560↑ Monogalactosyldiacylglycerol synthase (MDG) 2/2 – Os02g55910↑ – Os02g55910↑
Os08g20420↑ Os08g20420↑
UDP-sulfoquinovose synthase (SQD1) 0/1 – – – –
Sulfoquinovosyldiacylglycerol (SQD2) 0/1 – – – –
Internal P transport
Phosphate translocators 5/8 – Os05g41480↑ – –
Os09g12600↑ Os01g07730↓ Os08g25624↓ AK099799↓
Glucose-6-P translocator 1/2 – Os08g08840↑ –
Miscellaneous transporters
ABC transporters 8/27 Os03g46740↓ Os02g11760↑
Os04g51310↓ Os08g43120↑
Os09g03939↓ AK107554↑
Os12g13720↓ Os09g23640↓
Sugar transporters 6/29 – Os03g36730↑ – –
Os07g10820↑ AK109461↑ Os04g41320↓ Os12g03899↓ AK103844↓
Peptide transporters 20/52 – Os05g33960↑ Os10g02260↑ Os10g22560↑
which was not expressed in roots and only at very low levels in shoots that decreased further under P deficiency.
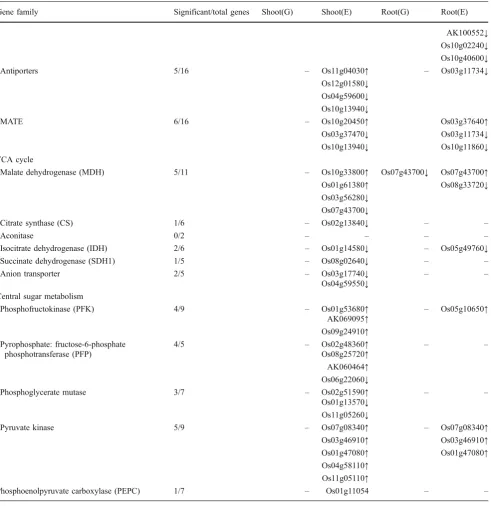
Synthesis and exudation of low molecular weight organic acids
Enhanced solubilization of soil-bound P due to root exudation of low molecular weight organic acids
(LMWOAs) is either due to increased LMWOA synthesis, regulated by genes involved in central carbon metabolism and the TCA cycle and/or with enhanced LMWOA efflux from roots. The expression of genes for phosphofructoki-nase (PFK) and pyruvate kiphosphofructoki-nase was upregulated in P-deficient roots of both genotypes (Table 4), but the key enzyme directing carbon flow to the TCA cycle, phospho-enolpyruvate carboxylase (PEPCase), was not regulated by E
Table 4 (continued)
Gene family Significant/total genes Shoot(G) Shoot(E) Root(G) Root(E)
AK100552↓ Os10g02240↓ Os10g40600↓
Antiporters 5/16 – Os11g04030↑ – Os03g11734↓
Os12g01580↓ Os04g59600↓ Os10g13940↓
MATE 6/16 – Os10g20450↑ Os03g37640↑
Os03g37470↓ Os03g11734↓ Os10g13940↓ Os10g11860↓ TCA cycle
Malate dehydrogenase (MDH) 5/11 – Os10g33800↑ Os07g43700↓ Os07g43700↑ Os01g61380↑ Os08g33720↓ Os03g56280↓
Os07g43700↓
Citrate synthase (CS) 1/6 – Os02g13840↓ – –
Aconitase 0/2 – – – –
Isocitrate dehydrogenase (IDH) 2/6 – Os01g14580↓ – Os05g49760↓
Succinate dehydrogenase (SDH1) 1/5 – Os08g02640↓ – –
Anion transporter 2/5 – Os03g17740↓ – –
Os04g59550↓ Central sugar metabolism
Phosphofructokinase (PFK) 4/9 – Os01g53680↑ – Os05g10650↑
AK069095↑ Os09g24910↑ Pyrophosphate: fructose-6-phosphate
phosphotransferase (PFP)
4/5 – Os02g48360↑ – –
Os08g25720↑ AK060464↑ Os06g22060↓
Phosphoglycerate mutase 3/7 – Os02g51590↑ – –
Os01g13570↓ Os11g05260↓
Pyruvate kinase 5/9 – Os07g08340↑ – Os07g08340↑
Os03g46910↑ Os03g46910↑
Os01g47080↑ Os01g47080↑ Os04g58110↑
Os11g05110↑
Phosphoenolpyruvate carboxylase (PEPC) 1/7 – Os01g11054 – –
or G in roots and neither were pyrophosphate:fructose-6-phosphate phosphotransferase (PFP) and phosphoglycerate mutase (supplementary Table S1). Among TCA-cycle-related genes, an upregulation of citrate synthase (CS) and malate dehydrogenase (MDH) and a downregulation of aconitase are expected to increase cellular levels of the organic acids citrate and malate that are known to effectively solubilize soil P. Only one MDH (Os07g43700; Table 4) showed an upregulation in roots (2.5-fold), but at both P levels the expression was twice as strong in Nipponbare. Citrate synthase and other TCA cycle genes were not affected by factor G and mostly unaffected by E but, if significant, genes were typically downregulated. Putative organic acid efflux transporters of the multidrug and toxin efflux (MATE) or anion transporter gene families were not differentially regulated by factor G in roots (Table4).
Hypothesis 3 NIL6-4 is tolerant to P deficiency due to modifications in root growth that maximize Pi interception.
Root hairs
Increasing the density or length of root hairs is a very effective way of increasing Pi interception at minimal cost of carbon or P, but very few genes associated with root hair development were found to be differentially regulated in roots (Table6). Extensins and GPI-anchored proteins were not regulated in roots, and only one out of 34 cellulose synthase-related proteins responded to P deficiency in roots, that gene being downregulated. The cellulose synthase-like D1 (Os10g42750), shown to be required for root hair morphogenesis in rice (Kim et al.2007), was not affected by E or G. Based on studies with root-hair-defective Arabidopsis mutants, several additional genes have been linked to root hair development: guanosine triphosphatase
(GTPase), glycerophosphoryl-diester-phosphodiesterase-like GPI-anchored protein, and the COBRA-like gene COBL9 (Roudier et al. 2002; Hochholdinger et al. 2008). In our study, these genes were not differentially regulated by factors E or G.
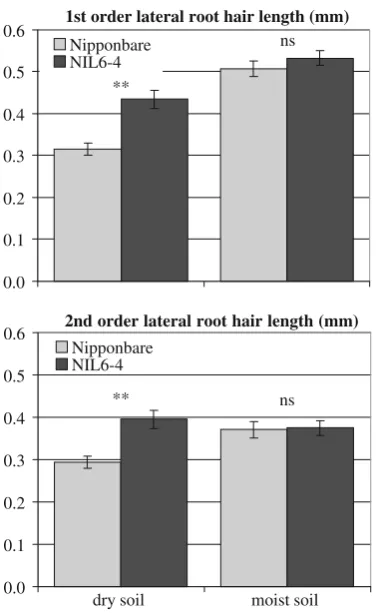
However, results of a subsequent independent experiment comparing root hair density and length did suggest the presence of a root-hair-related genotype effect. No difference between Nipponbare and NIL6-4 was observed for root hair density (data not shown), and root hair length did not differ in samples taken from roots grown in a soil that was maintained close to field capacity by daily addition of water. However, in a soil allowed to dry for a 20-day period, root hair length of Nipponbare was reduced by 20–40% whereas this reduction was less severe in NIL6-4 (Fig.2). Root hairs on first-order lateral roots were longer than on second-order laterals in moist soil, but they were more affected in dry soil, particularly in Nipponbare.
Root growth and cell wall loosening/reassembly
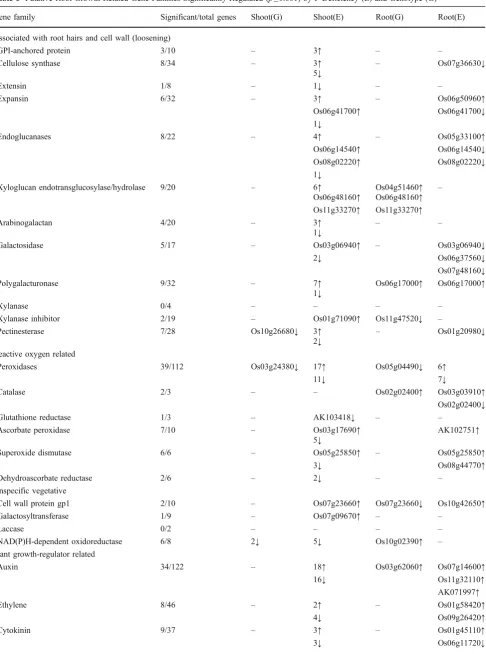
To maintain high relative root growth rates under P deficiency is crucially important and may be directly affected by processes such as cell wall loosening and changes in cell wall composition, which in turn could be mediated by reactive oxygen intermediates (ROI) and plant growth regulators such as auxin. Compared to other potential tolerance mechanisms, we detected a relatively large number of differentially regulated genes for category G in roots. Three members of the xyloglucan endotrans-glucosylase/hydrolase gene family and one polygalactur-onase were expressed at a higher level in NIL6-4, and this pattern was root specific (Table 6). Regulation of ROI-related genes was highly responsive to factor E without showing any obvious pattern. However, for two growth regulators known to affect root growth and architecture, Transporter GenBank TIGR locus Shoot (G) Shoot (E) Root (G) Root (E)
OsPT1 AF536961 Os03g05620 ns ns ns ns
OsPT2 AF536962 Os03g05640 0.536 6.11 0.59 1.12
OsPT3 AF536963 Os10g30770
OsPT4 AF536964 Os04g10750 0.565 1.61 ns 2.53
OsPT5 AF536965 Os04g10690 0.540 1.72 0.73 2.50
OsPT6 AF536966 Os08g45000
OsPT7 AF536967 Os03g04360 ns ns ns ns
OsPT8 AF536968 Os10g30790 0.725 2.24 0.80 2.64
OsPT9 AF536969 Os06g21920 ns ns 0.72 4.14
OsPT10 AF536970 n/a
OsPT11 AF536971 Os01g46860 ns ns 0.74 3.67
OsPT12 AF536972 Os03g05610 ns 0.57 nd nd
OsPT13 AF536973 n/a
Table 5 Gene Expression Pattern Observed in Shoots and Roots for High-Affinity P Transporters of the OsPT Gene Family
Table 6 Putative Root Growth-Related Gene Families Significantly Regulated (p≤0.001) by P Deficiency (E) and Genotype (G) Gene family Significant/total genes Shoot(G) Shoot(E) Root(G) Root(E)
Associated with root hairs and cell wall (loosening)
GPI-anchored protein 3/10 – 3↑ – –
Cellulose synthase 8/34 – 3↑ – Os07g36630↓
5↓
Extensin 1/8 – 1↓ – –
Expansin 6/32 – 3↑ – Os06g50960↑
Os06g41700↑ Os06g41700↓ 1↓
Endoglucanases 8/22 – 4↑ – Os05g33100↑
Os06g14540↑ Os06g14540↓ Os08g02220↑ Os08g02220↓ 1↓
Xyloglucan endotransglucosylase/hydrolase 9/20 – 6↑ Os04g51460↑ – Os06g48160↑ Os06g48160↑ Os11g33270↑ Os11g33270↑
Arabinogalactan 4/20 – 3↑ – –
1↓
Galactosidase 5/17 – Os03g06940↑ – Os03g06940↓
2↓ Os06g37560↓
Os07g48160↓
Polygalacturonase 9/32 – 7↑ Os06g17000↑ Os06g17000↑
1↓
Xylanase 0/4 – – – –
Xylanase inhibitor 2/19 – Os01g71090↑ Os11g47520↓ –
Pectinesterase 7/28 Os10g26680↓ 3↑ – Os01g20980↓
2↓ Reactive oxygen related
Peroxidases 39/112 Os03g24380↓ 17↑ Os05g04490↓ 6↑
11↓ 7↓
Catalase 2/3 – – Os02g02400↑ Os03g03910↑
Os02g02400↓
Glutathione reductase 1/3 – AK103418↓ – –
Ascorbate peroxidase 7/10 – Os03g17690↑ AK102751↑
5↓
Superoxide dismutase 6/6 – Os05g25850↑ – Os05g25850↑
3↓ Os08g44770↑
Dehydroascorbate reductase 2/6 – 2↓ – –
Unspecific vegetative
Cell wall protein gp1 2/10 – Os07g23660↑ Os07g23660↓ Os10g42650↑
Galactosyltransferase 1/9 – Os07g09670↑ – –
Laccase 0/2 – – – –
NAD(P)H-dependent oxidoreductase 6/8 2↓ 5↓ Os10g02390↑ –
Plant growth-regulator related
Auxin 34/122 – 18↑ Os03g62060↑ Os07g14600↑
16↓ Os11g32110↑
AK071997↑
Ethylene 8/46 – 2↑ – Os01g58420↑
4↓ Os09g26420↑
Cytokinin 9/37 – 3↑ – Os01g45110↑
auxin and gibberellin, an increase in transcript abundance was detected in NIL6-4 for one gibberellin receptor (Os07g44910) and a member of the IAA-amino acid hydrolase gene family. This gene (Os03g62060) was the only root-specific member of this family, and P deficiency reduced expression in Nipponbare but not in NIL6-4.
Transcription factors
Not related to our hypotheses but potentially of high significance for tolerance to P deficiency are regulatory genes. Several stress-responsive transcription factors have been identified with members of the WRKY family being particularly important under P deficiency. Twelve putative WRKYs were differentially regulated in shoots with OsWRKY34 (Os02g43560) showing a pronounced induc-tion under P deficiency (sixfold and threefold in NIL6-4 and Nipponbare, respectively; supplementary Table S1). In contrast, four WRKYs were significantly downregulated in roots, one (Os05g25770) significantly more so in NIL6-4. Transcription factors of the MYB or zinc finger family did not differ between genotypes. Some transcription factors have specifically been associated with the response to P deprivation. They include OsPTF1 (Os06g09370), which has been reported to contribute to tolerance to inorganic phosphate starvation (Yi et al. 2005), the “phosphate-induced protein” (phi-1; Os02g52040), and the “phosphate starvation response” factors (PHR1, Os03g21240; PHR2, Os07g25710) that form a regulatory circuit with PHO2 (Os06g40500) and micro-RNA399 (Fang et al.2008; Bari et al.2006). All were only regulated by the factor E and only in shoots.
Differential expression between genotypes: putative stress tolerance genes
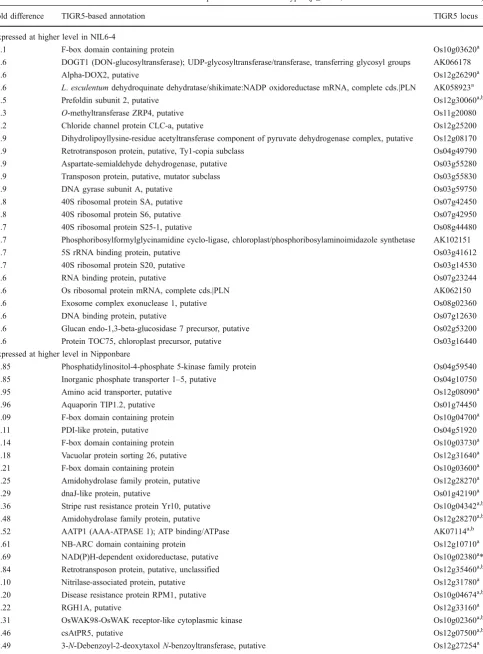
Most gene categories investigated so far have shown a much greater response for factor E than for G, corroborat-ing their stress responsiveness but not necessarily their involvement in stress tolerance. Assuming that stress tolerance genes should be differentially expressed between genotypes of high and low tolerance to P deficiency, genes that differed significantly between genotypes were sorted by fold differences for factor G. Among genes with higher expression in shoot tissue of NIL6-4 were an F-box protein, a UDP-glycosyltransferase, an alpha-dioxygenase (located 1st order lateral root hair length (mm)
0.0 0.1 0.2 0.3 0.4 0.5 0.6
Nipponbare NIL6-4
2nd order lateral root hair length (mm)
0.0 0.1 0.2 0.3 0.4 0.5 0.6
dry soil moist soil Nipponbare
NIL6-4
ns **
ns
**
Fig. 2 Root hair length on first- and second-order lateral roots of two genotypes that had been grown for 45 days in 50-L containers filled with a highly P-deficient (P-fixing) soil. The soil was either maintained close to field capacity by daily addition of water or was allowed to dry by withholding water between days 23 and 42.
Asterisksdenote statistical significance for factor genotype atp<0.01,
based on Tukey’s HSD (ns=not significant).
Table 6 (continued)
Gene family Significant/total genes Shoot(G) Shoot(E) Root(G) Root(E)
Os11g25454↓
Gibberellin 27/62 – 13↑ Os07g44910↑ Os02g35940↑
7↓ Os05g33730↑
Os07g39470↑ Os11g13570↑ Os06g20200↓ Os10g39140↓ Os12g04150↓
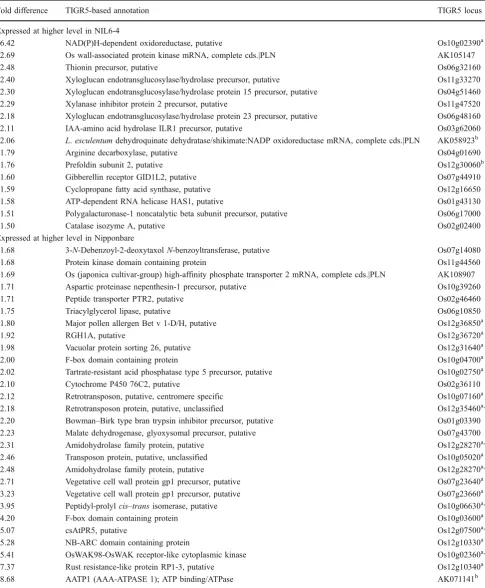
within the fine-mapped Pup1 region in chromosome 12), the O-methyltransferase ZRP4, and ribosomal proteins (Table7). In roots, the gene with the biggest positive fold differences in NIL6-4 was an NAD(P)H-dependent oxido-reductase while several other cell-wall-related genes such as a wall-associated protein kinase, three xyloglucan endo-transglucosylases (XTH), a xylanase inhibitor, and a polygalacturonase were also more highly expressed in NIL6-4 (Table 8). In addition, two genes showed this expression pattern in both root and shoot, one being a putative prefoldin subunit 2 and the other a dehydroquinate dehydratase/shikimate:NADP oxidoreductase. Most genes with the highest positive fold change in Nipponbare were located within the Kasalath introgressions on chromosomes 1, 7, 10, and 12, and one can therefore not exclude the possibility that sequence mismatches affected the analysis to some extent. Two additional experiments were carried out to (a) identify a root phenotype that could potentially be linked to the differentially expressed root genes and (b) to indepen-dently confirm whether xyloglucan endotransglucosylases and NAD(P)H-dependent oxidoreductase expression pat-terns cosegregate with Pup1. Micrographs from roots of plants grown in well-watered or slightly drought-stressed conditions showed highly developed aerenchyma under both soil water conditions and in both genotypes (supple-mentary Fig. S1; only Nipponbare is shown). However, genotypic differences were significant for root hair length in drying soil where NIL6-4 maintained longer root hairs compared to Nipponbare (Fig.2).
In root RNA samples taken from a similar experiment, expression patterns detected for three xyloglucan endotrans-glucosylases (XTH) and a NAD(P)H-dependent oxidoreduc-tase (see Table8) were independently confirmed for a set of NILs segregating for thePup1locus (NILs 6-4, Y-4, 14-4 for +Pup1; NILs 26-6, 28-10, and Nipponbare for−Pup1:). The difference between the +/−Pup1 groups was most pro-nounced for OsXTH2 followed by OsXTH11 (Fig.3), and as in the array, +Pup1 NILs showed constitutively higher expression levels irrespective of P supply. For OsXTH9, the difference between groups was only significant in the +P treatment. We were not able to confirm that the expression of the NAD(P)H-dependent oxidoreductase cosegregated with Pup1. Expression of this gene was very variable with highest levels in NILs 6-4 and 28-10 (−Pup1).
Discussion
Plant response to P deficiency has been analyzed at the transcriptome level in both Arabidopsis (Hammond et al. 2003; Misson et al.2005; Morcuende et al.2007) and rice (Wasaki et al.2003,2006; Wang et al.2006). These studies were carried out in nutrient solutions or other artificial
media and had detected a series of adaptive responses at the transcriptome levels that (1) circumvent metabolic steps requiring Pi by utilizing alternative glycolytic or respiratory pathways; (2) alter the lipid composition by enzymatic degradation of phospholipids and synthesis of galactolipid and sulfolipids; (3) remobilize Pi through enhanced expression of phosphatases and RNases; (4) enhance Pi uptake and retranslocation via an upregulation of high-affinity Pi transporters; (5) alter the carbon skeleton flow with potential benefits for root growth or organic acid synthesis and exudation; and (6) are involved in signal transduction and transcriptional regulation. It was generally concluded that the responses in rice andArabidopsisfollow similar patterns (Misson et al. 2005; Wang et al. 2006) which was largely confirmed in this study. Despite the insights gained from transcriptomic comparisons of a single genotype under different levels of P supply, it remains difficult to conclude which of the observed changes in gene expression are of practical importance and could therefore be harnessed to improve crop performance under P-limited conditions in the field.
Stress response
Our global analysis revealed that the number of genes affected by the factor E exceeded those differing between genotypes by a factor of seven in roots and a factor of 21 in shoots. Most P-responsive genes could therefore not be associated with the P deficiency tolerance in NIL6-4. For example, we observed upregulation of P stress response genes related to Pi remobilization, including genes involved in lipid metabolism, phosphatases, and other genes belong-ing to the P scavengbelong-ing system, as well as genes involved with P transporters, translocators, and antiporters; alteration of carbohydrates, amino acids, and protein metabolism; and alteration of secondary metabolism and photosynthesis. While this confirms other reports that these genes are associated with P stress response in P-deficient plants (Wasaki et al. 2003; Misson et al. 2005; Morcuende et al. 2007), these responses were typically less pronounced in NIL6-4. Our transcriptome data therefore do not support the hypothesis that tolerance of NIL6-4 is the result of superior internal P use efficiency due to more efficient Pi remobili-zation. This conclusion is supported by experimental evidence showing that shoot P concentrations of Nipponbare were equal to or lower than inPup1-NILs (Wissuwa and Ae 2001b), an observation that we could confirm here (Table1).
Table 7 Genes with the Greatest Fold Difference in Shoot Expression Between Genotypes (p≤0.001; Based on Data from Both P Treatments)
Fold difference TIGR5-based annotation TIGR5 locus
Expressed at higher level in NIL6-4
4.1 F-box domain containing protein Os10g03620a
3.6 DOGT1 (DON-glucosyltransferase); UDP-glycosyltransferase/transferase, transferring glycosyl groups AK066178
3.6 Alpha-DOX2, putative Os12g26290a
2.6 L.esculentumdehydroquinate dehydratase/shikimate:NADP oxidoreductase mRNA, complete cds.|PLN AK058923a
2.5 Prefoldin subunit 2, putative Os12g30060a,b
2.3 O-methyltransferase ZRP4, putative Os11g20080
2.2 Chloride channel protein CLC-a, putative Os12g25200
1.9 Dihydrolipoyllysine-residue acetyltransferase component of pyruvate dehydrogenase complex, putative Os12g08170
1.9 Retrotransposon protein, putative, Ty1-copia subclass Os04g49790
1.9 Aspartate-semialdehyde dehydrogenase, putative Os03g55280
1.9 Transposon protein, putative, mutator subclass Os03g55830
1.9 DNA gyrase subunit A, putative Os03g59750
1.8 40S ribosomal protein SA, putative Os07g42450
1.8 40S ribosomal protein S6, putative Os07g42950
1.7 40S ribosomal protein S25-1, putative Os08g44480
1.7 Phosphoribosylformylglycinamidine cyclo-ligase, chloroplast/phosphoribosylaminoimidazole synthetase AK102151
1.7 5S rRNA binding protein, putative Os03g41612
1.7 40S ribosomal protein S20, putative Os03g14530
1.6 RNA binding protein, putative Os07g23244
1.6 Os ribosomal protein mRNA, complete cds.|PLN AK062150
1.6 Exosome complex exonuclease 1, putative Os08g02360
1.6 DNA binding protein, putative Os07g12630
1.6 Glucan endo-1,3-beta-glucosidase 7 precursor, putative Os02g53200
1.6 Protein TOC75, chloroplast precursor, putative Os03g16440
Expressed at higher level in Nipponbare
1.85 Phosphatidylinositol-4-phosphate 5-kinase family protein Os04g59540
1.85 Inorganic phosphate transporter 1–5, putative Os04g10750
1.95 Amino acid transporter, putative Os12g08090a
1.96 Aquaporin TIP1.2, putative Os01g74450
2.09 F-box domain containing protein Os10g04700a
2.11 PDI-like protein, putative Os04g51920
2.14 F-box domain containing protein Os10g03730a
2.18 Vacuolar protein sorting 26, putative Os12g31640a
2.21 F-box domain containing protein Os10g03600a
2.25 Amidohydrolase family protein, putative Os12g28270a
2.29 dnaJ-like protein, putative Os01g42190a
2.36 Stripe rust resistance protein Yr10, putative Os10g04342a,b
2.48 Amidohydrolase family protein, putative Os12g28270a,b
2.52 AATP1 (AAA-ATPASE 1); ATP binding/ATPase AK07114a,b
2.61 NB-ARC domain containing protein Os12g10710a
2.69 NAD(P)H-dependent oxidoreductase, putative Os10g02380a*
2.84 Retrotransposon protein, putative, unclassified Os12g35460a,b
3.10 Nitrilase-associated protein, putative Os12g31780a
3.20 Disease resistance protein RPM1, putative Os10g04674a,b
3.22 RGH1A, putative Os12g33160a
3.31 OsWAK98-OsWAK receptor-like cytoplasmic kinase Os10g02360a,b
3.46 csAtPR5, putative Os12g07500a,b
Karthikeyan,2005). However, we cannot conclude that this observation assigns a critical role to these transporters in stress tolerance because expression levels in our tolerant line NIL6-4 were consistently lower than in Nipponbare. That transporter activity (in addition to transcript level) was indeed not limiting in Nipponbare could be deduced from P depletion experiments showing that Nipponbare is capable of depleting Pi from nutrient solutions as rapidly and to an equally low level (0.16 µM P) as a Pup1-NIL (Wissuwa 2005). Similarly, barley lines overexpressing a Pi transporter did not show improved tolerance to P deficiency (Rae et al. 2004), most likely because substrate (Pi) availability rather than transporter activity is the limiting step in P-deficient soils.
The exudation of LMWOAs capable of releasing soil-bound P is considered to be a highly effective way of increasing the substrate (Pi) availability for uptake (Kirk et al. 1999; Lambers et al. 2006T). P-deficiency-induced alterations in gene expression that would increase carbon supply for organic acid synthesis have been reported for rice (Wasaki et al.2003) andArabidopsis(Morcuende et al. 2007). We have detected the upregulation of genes, under P deficiency, coding for enzymes related to carbon flow through glycolysis to TCA (such as PFK, PFP, PEPCase, and pyruvate kinase). In addition, P deficiency led to an upregulation of a malate dehydrogenase and a succinate dehydrogenase, but in all cases expression levels did not differ between genotypes. In any case, increased synthesis of LMWOAs is not necessarily indicative of a higher LMWOA exudation since the limiting step is not the plant-internal concentration of LMWOAs (synthesis) but their rate of release (Delhaize et al. 2001). This release is mediated by specific efflux transporters, and their level of activity was shown to be directly linked to malate or citrate-mediated tolerance to excess aluminum (Delhaize et al. 2004; Magalhaes et al. 2007). However, putative efflux transporters were not among the root-specific genes differentially expressed between genotypes, corroborating earlier results that neither genotype exuded citrate or malate
at high enough concentrations to have a significant effect on P solubilization (Wissuwa 2005).
The number of genes regulated in shoots by P stress in our study was higher than in other studies examining P stress response (Wasaki et al.2006; Misson et al.2005; Morcuende et al.2007), likely due to differences in statistical analysis and in stress intensity. Other studies may have used a threshold (e.g., at least twofold higher expression) in their analysis, therefore ignoring genes with smaller changes. Our analysis was based on a mixed-model analysis of variance (ANOVA) using a threshold ofp≤0.001 but no additional fold change threshold. The second potential reason is that our plants were older and had experienced P deficiency for a longer period than the experimental plants used in other studies. They were thus suffering more long-term effects of P deficiency.
Stress tolerance
We can therefore conclude that neither hypothesis 1 nor hypothesis 2 adequately explains observed genotypic differ-ences in tolerance to P deficiency. The question as to which differentially regulated genes could have contributed to tolerance therefore remains unresolved so far and shall now be addressed based on a compilation of the most differentially regulated genes (by fold difference) for factor G. In shoots, no overrepresentation of any specific gene family, metabolic pathway, or functional category was detected that would have suggested the involvement of a specific tolerance strategy (Table 7). However, in roots, cell-wall-related genes were highly overrepresented (Table 8), including three members of the xyloglucan endotransglycosylases hydrolase (XTH) gene family, a xylanase inhibitor, a polygalacturonase, a cell-wall-associated protein kinase, and a root-specific cortical cell-delineating protein (root-specific protein ZRP3, signifi-cant for G × E). In addition, two genes potentially linked to the hormonal regulation of root growth, an IAA-amino acid hydrolase ILR1 precursor and a gibberellin receptor GID1L2, were among the genes expressed at a higher level in NIL6-4 roots. The higher expression for many root
cell-Table 7 (continued)
Fold difference TIGR5-based annotation TIGR5 locus
4.08 Major myoinositol transporter iolT, putative Os12g32940a
4.96 Peptidyl-prolylcis–transisomerase, putative Os10g06630a,b
5.85 Transposon protein, putative, CACTA, En/Spm subclass Os10g04050a
5.99 NB-ARC domain containing protein Os12g32660a,b
8.69 Lipoxygenase 2.1, chloroplast precursor, putative Os12g37260a
Only genes with informative annotation and that are“present”in at least one tissue are shown aLocalized within Kasalath introgressions present on chromosomes 1, 7, 10, and 12 (Torabi et al.2009)
b
Table 8 Genes with the Greatest Fold Difference in Root Expression Between Genotypes (p≤0.001; Based on Data from Both P Treatments)
Fold difference TIGR5-based annotation TIGR5 locus
Expressed at higher level in NIL6-4
6.42 NAD(P)H-dependent oxidoreductase, putative Os10g02390a
2.69 Os wall-associated protein kinase mRNA, complete cds.|PLN AK105147
2.48 Thionin precursor, putative Os06g32160
2.40 Xyloglucan endotransglucosylase/hydrolase precursor, putative Os11g33270 2.30 Xyloglucan endotransglucosylase/hydrolase protein 15 precursor, putative Os04g51460
2.29 Xylanase inhibitor protein 2 precursor, putative Os11g47520
2.18 Xyloglucan endotransglucosylase/hydrolase protein 23 precursor, putative Os06g48160
2.11 IAA-amino acid hydrolase ILR1 precursor, putative Os03g62060
2.06 L.esculentumdehydroquinate dehydratase/shikimate:NADP oxidoreductase mRNA, complete cds.|PLN AK058923b
1.79 Arginine decarboxylase, putative Os04g01690
1.76 Prefoldin subunit 2, putative Os12g30060b
1.60 Gibberellin receptor GID1L2, putative Os07g44910
1.59 Cyclopropane fatty acid synthase, putative Os12g16650
1.58 ATP-dependent RNA helicase HAS1, putative Os01g43130
1.51 Polygalacturonase-1 noncatalytic beta subunit precursor, putative Os06g17000
1.50 Catalase isozyme A, putative Os02g02400
Expressed at higher level in Nipponbare
1.68 3-N-Debenzoyl-2-deoxytaxolN-benzoyltransferase, putative Os07g14080
1.68 Protein kinase domain containing protein Os11g44560
1.69 Os (japonica cultivar-group) high-affinity phosphate transporter 2 mRNA, complete cds.|PLN AK108907 1.71 Aspartic proteinase nepenthesin-1 precursor, putative Os10g39260
1.71 Peptide transporter PTR2, putative Os02g46460
1.75 Triacylglycerol lipase, putative Os06g10850
1.80 Major pollen allergen Bet v 1-D/H, putative Os12g36850a
1.92 RGH1A, putative Os12g36720a
1.98 Vacuolar protein sorting 26, putative Os12g31640a
2.00 F-box domain containing protein Os10g04700a
2.02 Tartrate-resistant acid phosphatase type 5 precursor, putative Os10g02750a
2.10 Cytochrome P450 76C2, putative Os02g36110
2.12 Retrotransposon, putative, centromere specific Os10g07160a
2.18 Retrotransposon protein, putative, unclassified Os12g35460a,b
2.20 Bowman–Birk type bran trypsin inhibitor precursor, putative Os01g03390 2.23 Malate dehydrogenase, glyoxysomal precursor, putative Os07g43700
2.31 Amidohydrolase family protein, putative Os12g28270a,b
2.46 Transposon protein, putative, unclassified Os10g05020a
2.48 Amidohydrolase family protein, putative Os12g28270a,b
2.71 Vegetative cell wall protein gp1 precursor, putative Os07g23640a 3.23 Vegetative cell wall protein gp1 precursor, putative Os07g23660a
3.95 Peptidyl-prolylcis–transisomerase, putative Os10g06630a,b
4.20 F-box domain containing protein Os10g03600a
5.07 csAtPR5, putative Os12g07500a,b
5.28 NB-ARC domain containing protein Os12g10330a
5.41 OsWAK98-OsWAK receptor-like cytoplasmic kinase Os10g02360a,b
7.37 Rust resistance-like protein RP1-3, putative Os12g10340a
8.68 AATP1 (AAA-ATPASE 1); ATP binding/ATPase AK071141b
Only genes with informative annotation and that are“present”in at least one tissue are shown aLocalized within Kasalath introgressions present on chromosomes 1, 7, 10, and 12 (Torabi et al.2009)
b
wall-associated genes would support our third hypothesis that tolerance to P deficiency in NIL6-4 is due to modifications in root growth that maximize Pi interception. This is further corroborated by phenotypic data showing that the most consistent difference between Nipponbare and NIL6-4 is a far more pronounced reduction in root biomass and surface area due to P deficiency in Nipponbare (Wissuwa and Ae2001b; Wissuwa2005). Presumably, the increased P uptake by NIL6-4 under P-deficient conditions allowed further root growth compared to Nipponbare: however, under P-replete conditions, both genotypes acquire sufficient P for unrestricted root growth, and hence root biomass did not differ between genotypes.
The XTH genes differentially expressed for G in roots correspond to OsXTH2, OsXTH9, and OsXTH11, which are members of a 15-member XTH gene family in rice (Yokoyama et al.2004). The role of xyloglucans and XTH in rice remains a matter of debate, but it is thought that they play a role in cell wall restructuring and in cell expansion and therefore in root growth (Yokoyama et al. 2004). OsXTH2 was considered to be root specific which we cannot confirm since it was strongly (fivefold) upregulated by P deficiency in shoots whereas root expression levels were reduced by about 50%, with NIL6-4 showing a constitutively higher expression (2.3 fold) compared to
Nipponbare. An almost identical expression pattern was seen for OsXTH11 while OsXTH9 was constitutively higher in NIL6-4 roots with no difference due to G or E in shoots. A strong upregulation in shoots under stress was also seen for Os07g34580, Os02g46910, and Os03g02610, and in all cases this upregulation was about twice as high in NIL6-4.
Genotypic differences in XTH expression levels under P deficiency could have simply been a consequence of a more pronounced root growth reduction in Nipponbare; however, the observation that XTH’s are very strongly upregulated under low P stress in shoots (14-fold for OsXTH11; fivefold for OsXTH2), despite an even stronger biomass reduction in shoots compared to roots (Table1), contradicts the notion that XTH expression simply follows changes in growth. One may therefore assign a yet unknown function to XTHs under stress. In fact, enhanced expression of XTH has been observed in maize roots under flooding where it was associated with aerenchyma formation (Saab and Sachs 1996) and in drying soil where XTH was thought to help maintain root elongation rates at low water potential (Wu et al.1994). In addition, the activity of xyloglucan endotrans-glycosylases has been localized in growing root hairs (Vissenberg et al. 2001).
Aerenchyma formation and root hair elongation are two potential tolerance mechanisms that would allow plants to
Gene expression relative to Nipponbare
OsXTH2
0 1 2 3 4 5 6
-P +P
-Pup1 +Pup1
*
OsXTH9
0.0 0.5 1.0 1.5 2.0 2.5
-P +P
-Pup1 +Pup1
OsXTH11
0.0 0.5 1.0 1.5 2.0 2.5 3.0
-P +P
-Pup1 +Pup1
Os10g02390
0 4 8 16 20 24
-P +P
-Pup1 +Pup1
***
*
*
*
ns ns
***
12
Fig. 3 Relative gene expression of OsXTH2 (Os11g33270), OsXTH9 (Os06g48160), OsXTH11 (Os06g48160), and NAD(P)H-dependent oxidore-ductase (Os10g02390) in a set of NILs segregating for the Pup1 locus. Each data point represents the mean of three NILs (NILs 14-4, 6-4, Y4 for +Pup1; NILs 26-6, 28-10, and Nipponbare for−Pup1), with three biological and two techni-cal replications per NIL.‘*, **, ***’denote significance at the
produce roots at minimal carbon and Pi cost (Lynch and Ho 2005). In order to determine if Nipponbare had impaired aerenchyma formation, several micrographs of Nipponbare and NIL6-4 roots were taken. It was concluded that Nipponbare developed highly aerenchymatic roots even under fully aerobic soil conditions (supplementary Fig.S1) and that no visible differences existed in aerenchyma development between NIL6-4 and Nipponbare in root samples from both dry and moist soil (data not shown). For root hair length, on the other hand, significant genotypic differences were detected with NIL6-4 having longer hairs in dry soil compared to Nipponbare (Fig. 2). Assuming cylindrical root geometry, the observed differ-ence in hair length between genotypes would result in a 70% greater soil volume explored by the hairy portions of roots of NIL6-4. Based on model simulations by Wissuwa (2003) such an increase might be more than sufficient to account for the differences in P uptake typically detected between Nipponbare andPup1-NILs. This is because any initial small increase in P uptake (∆P) brought about by longer root hairs would get amplified through a subsequent root growth effect if plants use the∆P to produce more root biomass, which is typically observed in NIL6-4 (Table1).
That the difference in root hair length was only seen in drying soil furthermore matches our observation that differences in P uptake between NIL6-4 and Nipponbare increase under low rainfall conditions in field experiments or under imposed intermittent drought in pot experiments (unpublished data). In drying soil, P availability is further reduced, and it has been observed that P becomes the first nutrient-limiting rice growth under drought (Stephan Haefele, personal communication). That XTH activity was involved in maintaining root elongation rates at low water potential in maize (Wu et al.1994) could suggest a similar role for rice. Additional indirect evidence suggests a link between root-specific gene expression patterns and genotyp-ic difference in root growth and/or root hair length. Maize root elongation was shown to be dependent on an additional wall-loosening mechanism mediated via ROI, a process initiated by the NAD(P)H oxidase-catalyzed formation of superoxide radicals (O2−; Liszkay et al. 2004). One such NAD(P)H-dependent oxidoreductase (Os10g02390) was the gene with the biggest fold change difference between NIL6-4 and Nipponbare (6.NIL6-4-fold higher in NIL6-NIL6-4 roots). This was a highly root-specific regulation pattern as expression in shoots at −P was threefold higher in Nipponbare. A link between NAD(P)H-dependent oxidoreductase and root and root hair elongation is supported by data from studies of the root hairlessArabidopsismutant (rhd2) which is impaired in the generation of ROIs in the root due to the disruption of a NAD(P)H oxidase gene (Foreman et al. 2003). In subse-quent gene expression analyses via reverse transcription (RT)–qPCR, we were able to confirm the high expression of
Os10g02390 in NIL6-4, but all other NILs also showed higher gene expression compared to Nipponbare, raising doubt about the link between thePup1locus and NAD(P)H-dependent oxidoreductase expression.
At this point, knowledge about the regulation of root elongation and root hair growth in graminaceous plants is incomplete with competing views attributing cell wall loosening to either XTH, expansins, or NAD(P)H-oxidore-ductase-dependent ROI release (Liszkay et al. 2004; Vissenberg et al.2005). That several genes associated with two of these processes were among the few genes with significantly higher expression in roots of NIL6-4 could therefore suggest that they are involved in the ability to maintain root growth and/or root hair elongation in P-deficiency-tolerant NIL6-4. That the gene expression pattern of three XTH genes distinguished groups of NILs contrasting for the presence of thePup1locus could further imply a link between Pup1and XTH activity. However, it should be stressed that these XTHs are outside the Pup1 region and are therefore not Pup1 candidates. Within the Pup1 region, only one gene with putative regulatory function was identified (OsPupK46-1; AB458444), and it remains to be tested if a link between this gene and XTH activity can be established. Furthermore, that thePup1effect remains significant under well-watered conditions, even though not quite as strongly as under mild drought, indicated that the root hair phenotype would contribute to but not entirely account for thePup1effect. The more general effect of XTH and other cell-wall-related genes on root growth under stress therefore warrants additional studies.
Conclusion
typically coincide in this environment and therefore were not selected for.
Materials and methods
Plant material, growth conditions, and phenotypic evaluation
Two genotypes of contrasting tolerance to phosphorus deficiency, Nipponbare and NIL6-4, were used in this study. Plants were grown in 10-l pots containing soil (highly P-fixing Andosol) from two neighboring field plots located at Tsukuba, Japan. One field plot has never received P fertilizer throughout its 40-year cropping history (−P); the other plot has been fertilized with the equivalent of 60 kg P ha−1(+P). Seeds were sown directly in the soil to facilitate normal root development, and pots watered every 2–3 days to simulate “upland”growth conditions in a greenhouse. The experiment was conducted in a completely randomized design with three replications and four plants per replicate pot. Tissue samples were taken at 40 DAS; shoots (leaf blade) and roots were rapidly frozen in liquid nitrogen and stored at −70°C until analyzed. A parallel experiment was conducted for pheno-typic evaluation as described above with the exception that a second sample was taken 85 DAS from plants grown in 50-l pots. P concentrations in oven-dried root and leaf samples were determined colorimetrically by the phospho-vanadate method after digestion in a mixture of HNO3, HClO4, and H2SO4(3:1:1).
For a subsequent experiment to analyze root characteristics in more detail, seeds of Nipponbare and NIL6-4 were sown in 50-l containers filled with−P soil. Pots were maintained either at field capacity (by daily addition of water) or allowed to dry by withholding water between days 23 and 42. Samples were taken 45 DAS, when plants of each genotype were near identical and were thus experiencing a similar degree of P stress. At about 55–60 DAS, genotypes already differ in P uptake and root and shoot biomass (Wissuwa 2003); therefore, the mechanism that causes the increased root biomass (which then drives further P uptake) must be present prior to this divergence (e.g., at around 45 DAS). Individual roots were washed free of soil and subsamples stored in 50% ethanol and 5% acetic acid solution until analyzed micro-scopically using an Olympus BX50 equipped with a DP20 digital camera (Olympus Imaging, Tokyo, Japan). Root hair length was measured on digital micrographs of first- and second-order lateral roots. Aerenchyma formation was analyzed in freehand root cross section of tissue stained with phloroglucinol/HCl and mounted in 50% glycerol.
In a similar experiment, NILs segregating for thePup1 locus (+Pup1: NILs 6-4, Y-4, 14-4;−Pup1: NILs 26-6, 28-10, and Nipponbare) were grown for 50 days in either
P-deficient or P-fertilized soil, and root material was sampled and immediately shock-frozen in liquid N. Some genotype information on these NILs can be found in Heuer et al. (2009), Torabi et al. (2009), and Wissuwa et al. (2002). Total RNA was extracted and used to compare the relative expression of XTH and NAD(P)H-dependent oxidoreduc-tase genes through RT-qPCR.
Extraction of Total RNA
Total RNA was extracted using the RNeasy Mini Kit (Qiagen) according to the manufacturer’s instruction. In brief, frozen tissues were ground using a multibead shocker (Yasuikikai, Japan), then homogenized in the presence of a buffer containing guanidine isothiocyanate. Homogenate was applied to an RNeasy spin column and washed, and total RNA was eluted using RNase-free water. Purity of RNA was determined by OD using a spectrophotometer, and RNA integrity was determined by electrophoresis (2100 Agilent Technologies).
Microarray Slide Hybridization
The differential gene expression in each treatment was analyzed by the Rice Oligo Microarray G4138A (Agilent Technologies) which uses 60-mer oligonucleotides deduced from available cDNA clones of the rice cultivar Nipponbare (Rice Full-Length cDNA Consortium, 2003). Labeled cRNA was synthesized from 500 ng total RNA with cyanine-3-CTP (Cy3) and cyanine-5-CTP (Cy5) using a Low RNA Input Linear Amplification kit (Agilent Tech-nologies). Hybridization solution (500 µl) containing the Cy3- and Cy5-labeled cRNA samples (1 µg each) was prepared using the in situ Hybridization Kit Plus (Agilent Technologies). Labeled cRNA samples were then hybrid-ized to the array slide by incubating at 60°C for 17 h. Subsequently, the slide was washed twice (6× saline sodium citrate (SSC)+0.005% Triton X-102 for 10 min in room temperature and then 0.1× SSC+0.005% TritonX-102 for 5 min at 4°C) and dried with Nitrogen gas. Image file of fluorescent signal on the slide was produced with a DNA microarray scanner (Agilent Technologies). Signal intensi-ties and their significance of the difference between the two signal intensities (p value of differential gene expression) were measured using the Feature Extraction software (version 8.1, Agilent Technologies).
Data processing and statistical analysis
All analyses were based on dye-normalized signal intensi-ties of each channel, the normalization being performed by Feature Extraction ver. 8.1 (Agilent Technologies). Signif-icance analysis for the factor environment (−P vs +P) and genotype (Nipponbare vs NIL6-4) was performed using a mixed-model ANOVA which considers the effects of genotypes and environment conditions all at once (using a threshold p≤0.001). The model proposed by Wolfinger et al. (2001) was implemented for a loop design using R/ MAANOVA (Wu et al.2002), where the effect of genotype and environment alone was estimated by the no-interaction model:
Gene specific fixed effect¼ArrayþDyeþGenotypeþEnv: Random effect¼Array;
and genotype × environment interactions were estimated by the model:
Gene specific fixed effect¼ArrayþDyeþGenotype
þEnv:þðGenotypeEnv:Þ Random effect¼Array
Gene annotations were based on the Rice Genome Annotation Project annotation database (TIGR5; http:// rice.plantbiology.msu.edu/data_download.shtml). For probes lacking an annotation in TIGR5, several alternative annotations were considered either based on information provided by the manufacturer (Agilent) or on BLAST searches for the corresponding gene model inArabidopsis. Alternatively, RAP annotation (http://rapdb.dna.affrc.go.jp) was used when functional annotations were not available in the previous search (TIGR and Agilent; Supplementary Table S1).
Comparison of mRNA transcript abundance using RT–PCR
Residual DNA was removed from total RNA of samples intended for quantitative PCR using the RNase-Free DNase set (Qiagen) during the RNA extraction procedure.
Around 400 ng total RNA was reverse-transcribed using Random 6 monomers and ExScript RTase of the ExScript RT reagent kit (Takara, Japan). Thermal conditions were: 42°C for 30 min and 95°C for 2 min. Subsequently, the first-strand cDNA was used as templates for PCR. PCR thermal conditions were as follows: first denaturing step at 94°C for 2 min, followed by 30 cycles of 94°C for 30 s, 55° C to 60°C for 30 s, and 72°C for 90 s, and concluded by an extension step at 72°C for 10 min.
qPCR was performed with 10 ng RT template and SYBR Premix ExTaq (Perfect Real Time, Takara, Japan), using the
Mini Opticon Real-Time PCR system (BioRad, USA). Thermal conditions were: 94°C for 10 s as the first denaturing step, followed by 94°C for 5 s, 55°C to 60°C for10 s, and 72°C for 15 s, for 40 cycles, followed by a gradual increase in temperature from 55°C to 96°C during the dissociation stage (to monitor the specificity of each primer set). Serial dilutions of RT product were used to determine the efficiency of each primer. A rice actin (RAc1) was used as internal control. Relative expression levels between samples (the same as the microarray ones) were calculated using the delta–delta comparison and expressed as fold changes, using Nipponbare or +P soil conditions for normalization. The normalized data were analyzed by ANOVA and pairwise comparison (Tukey test) for each gene.
Acknowledgments Special thanks are given to S. Maruyama for assistance in running the 22 k arrays.
References
Bari R, Datt Pant B, Stitt M, Scheible W-R. PHO2, MicroRNA399, and PHR1 define a phosphate-signaling pathway in plants. Plant Physiol. 2006;141:988–99.
Batjes NH. A world data set of derived soil properties by FAO-UNESCO soil unit for global modeling. Soil Use Manag. 1997;13:9–16.
Delhaize E, Hebb DM, Ryan PR. Expression of a Pseudomonas
aeruginosacitrate synthase gene in tobacco is not associated with
either enhanced citrate accumulation or efflux. Plant Physiol. 2001;125:2059–67.
Delhaize E, Ryan PR, Hebb DM, Yamamoto Y, Sasaki T, Matsumoto H. Engineering high-level aluminum tolerance in barley with the ALMT1 gene. PNAS. 2004;101:15249–54.
Fageria NK, Baligar VC. Upland rice genotypes evaluation for phosphorus use efficiency. J Plant Nutr. 1997;20:499–509. Fang Z, Shao C, Meng Y, Wu P, Chen M. Phosphate signaling in
ArabidopsisandOryza sativa. Plant Sci. 2008;176:170–80.
Foreman J, Demidchik V, Bothwell JHF, Mylona P, Miedema H, Torres MA, et al. Reactive oxygen species produced by NADPH oxidase regulate plant cell growth. Nature. 2003; 422:442–6.
George TS, Simpson RJ, Hadobas PA, Richardson AE. Expression of fungal phytase gene inNicotiana tabacumimproves phosphorus nutrition of plants grown in amended soils. Plant Biotech J. 2005;3:129–40.
Hammond JP, Bennett MJ, Bowen HC, Broadley MR, Eastwood DC, May ST, et al. Changes in gene expression inArabidopsisshoots during phosphate starvation and the potential for developing smart plants. Plant Physiol. 2003;132:578–96.
Heuer S, Lu X, Chin JH, Pariasca Tanaka J, Kanamori H, Matsumoto T, et al. Comparative sequence analyses of the major QTL phosphate uptake 1 (Pup1) reveal a complex genetic structure. Plant Biotech J. 2009;7:456–71.
Hochholdinger F, Wen T, Zimmermann R, Chimot-Marolle P, da Costa e Silva O, Bruce W, et al. The maize (Zea mays L.)
roothairless3gene encodes a putative GPI-anchored,
Ismail A, Heuer S, Thomson M, Wissuwa M. Genetic and genomic approaches to develop rice germplasm for problem soils. Plant Mol Biol. 2007;65:547–70.
Karandashov V, Bucher M. Symbiotic phosphate transport in arbuscular mycorrhizas. Trends Plant Sci. 2005;10:22–9. Kim CM, Park SH, Je BI, Park SH, Park SJ, Piao HL, et al. Han C-d
OsCSLD1, a cellulose synthase-like D1 gene, is required for root hair morphogenesis in rice. Plant Physiol. 2007;143:1220–30. Kirk GJD, George T, Courtois B, Senadhira D. Opportunities to
improve phosphorus efficiency and soil fertility in rain fed lowland and upland rice ecosystems. Field Crops Res. 1998;56:73–92.
Kirk GJD, Santos EE, Santos MB. Phosphate solubilization by organic anion excretion from rice growing in aerobic soil: rates of excretion and decomposition, effects on rhizosphere pH and effects on phosphate solubility and uptake. New Phytol. 1999;142:185–200.
Lambers H, Shane MW, Cramer MD, Pearse SJ, Veneklaas EJ. Root structure and functioning for efficient acquisition of phosphorus: matching morphological and physiological traits. Ann Bot. 2006;98:693–713.
Liszkay A, van der Zalm E, Schopfer P. Production of reactive oxygen intermediates (O2·–, H2O2, and ·OH) by maize roots and their role in wall loosening and elongation growth. Plant Physiol. 2004;136:3114–23.
Lynch JP, Ho MD. Rhizoeconomics: carbon costs of phosphorus acquisition. Plant Soil. 2005;269:45–56.
Magalhaes JV, Liu J, Guimaraes CT, Lana UGP, Alves VMC, Wang Y-H, et al. A gene in the multidrug and toxic compound extrusion (MATE) family confers aluminum tolerance in sor-ghum. Nat Genet. 2007;39:1156–61.
Ming F, Mi GH, Lu Q, Yin S, Zhang SS, Guo B, et al. Cloning and characterization of cDNA for the Oryza sativa phosphate transporter. Cell Mol Biol Lett. 2005;10:401–11.
Misson J, Raghothama KG, Jain A, Jouhet J, Block MA, Bligny R, et al. A genome-wide transcriptional analysis using Arabidopsis
thaliana Affymetrix gene chips determined plant responses to
phosphate deprivation. PNAS. 2005;102:11934–9.
Morcuende R, Bari R, Gibon Y, Zheng W, Pant BD, Blasing O, et al. Genome-wide reprogramming of metabolism and regulatory networks ofArabidopsisin response to phosphorus. Plant Cell Environ. 2007;30:85–112.
Paszkowski U, Kroken S, Roux C, Briggs SP. Rice phosphate transporters include an evolutionarily divergent gene specifically activated in arbuscular mycorrhizal symbiosis. PNAS. 2002; 99:13324–9.
Rae AL, Cybinski DH, Jarmey JM, Smith FW. Characterization of two phosphate transporters from barley; evidence for diverse function and kinetic properties among members of the Pht1 family. Plant Mol Biol. 2003;53:26–36.
Rae AL, Jarmey JM, Mudge SR, Smith FW. Over expression of a high-affinity phosphate transporter in transgenic barley does not enhance phosphorus uptake rates. Functional Plant Biol. 2004;31:141–8.
Raghothama KG, Karthikeyan AS. Phosphate acquisition. Plant Soil. 2005;274:37–49.
Richardson AE, Hadobas PA, Hayes JE. Extracellular secretion of
Aspergillus phytase from Arabidopsis roots enables plants to
obtain phosphorus from phytate. Plant J. 2001;25:641–9. Roudier F, Schindelman G, DeSalle R, Benfey PN. The COBRA
family of putative GPI-anchored proteins inArabidopsis. A new fellowship in expansion. Plant Physiol. 2002;130:538–48.
Runge-Metzger A. Closing the cycle: obstacles to efficient P management for improved global food security. In: Tiessen H, editor. Phosphorus in the global environment: transfers, cycles and management. New York: Wiley; 1995. p. 27–42.
Saab IN, Sachs MM. A flooding-induced xyloglucan endotransglyco-sylase homolog in maize is responsive to ethylene and associated with aerenchyma. Plant Physiol. 1996;112:385–91.
Torabi S, Wissuwa M, Heidari M, Naghavi MR, Gilani K, Hajirezaei MR, et al. A comparative proteome approach to decipher the mechanism of rice adaptation to phosphorous deficiency. Proteo-mics. 2009;9:159–70.
Vissenberg K, Fry SC, Verbelen J-P. Root hair initiation is coupled to a highly localized increase of xyloglucan endotransglycosylase action inArabidopsisroots. Plant Physiol. 2001;127:1125–35. Vissenberg K, Fry SC, Pauly M, Hofte H, Verbelen J-P. XTH acts at
the microfibril-matrix interface during cell elongation. J Exp Bot. 2005;56:673–83.
Wang X, Yi K, Tao Y, Wang F, Wu Z, Jiang D, et al. Cytokinin represses phosphate-starvation response through increasing of intracellular phosphate level. Plant Cell Environ. 2006;29:1924– 35.
Wasaki J, Yonetani R, Shinano T, Kai M, Osaki M. Expression of the OsPI1 gene, cloned from rice roots using cDNA microarray, rapidly responds to phosphorus status. New Phytol. 2003;158:239–48. Wasaki J, Shinano T, Onishi K, Yonetani R, Yazaki J, Fujii F, et al.
Transcriptomic analysis indicates putative metabolic changes caused by manipulation of phosphorus availability in rice leaves. J Exp Bot. 2006;57:2049–59.
Wissuwa M. How do plants achieve tolerance to phosphorus deficiency? Small causes with big effects. Plant Physiol. 2003; 133:1947–58.
Wissuwa M. Combining a modeling with a genetic approach in establishing associations between genetic and physiological effects in relation to phosphorus uptake. Plant Soil. 2005; 269:57–68.
Wissuwa M, Ae N. Genotypic variation for tolerance to phosphorus deficiency in rice and the potential for its exploitation in rice improvement. Plant Breed. 2001a;120:43–8.
Wissuwa M, Ae N. Further characterization of two QTLs that increase phosphorus uptake of rice (Oryza sativaL.) under phosphorus deficiency. Plant Soil. 2001b;237:275–86.
Wissuwa M, Wegner J, Ae N, Yano M. Substitution mapping ofPup1: a major QTL increasing phosphorus uptake of rice from a phosphorus-deficient soil. Theor Appl Genet. 2002;105:890–7. Wolfinger RD, Gibson G, Wolfinger ED, Bennett L, Hamadeh P,
Bushel P, et al. Assessing gene significance from cDNA micro-array expression data via mixed models. J Comp Biol. 2001;8:625. Wu Y, Spollen WG, Sharp RE, Hetherington PR, Fry SC. Root growth maintenance at low water potentials (increased activity of xyloglucan endotransglycosylase and its possible regulation by abscisic acid). Plant Physiol. 1994;106:607–15.
Wu H, Kerr M, Cui X, Churchill G. R/MAANOVA: an extensive R environment for the analysis of spotted cDNA microarray experiments. http://www.jax.org/staff/churchill/labsite/software/ anova/(2002).
Yi K, Wu Z, Zhou J, Du L, Guo L, Wu Y, et al. OsPTF1, a novel transcription factor involved in tolerance to phosphate starvation in rice. Plant Physiol. 2005;138:2087–96.