ISSN: 2319-6505
GENETIC ANALYSIS AND QTL MAPPING OF AGRO-MORPHOLOGICAL TRAITS IN LOWLAND RICE
(
ORYZA SATIVA
L.) UNDER DROUGHT CONDITIONS
Abdourasmane K. Konaté
1,3*., Adama Zongo
2., Jean Rodrigue Sangaré
3., Honore Kam
1., Drissa Hema
1.,
Ambaliou Sanni
3and Alain Audebert
4Infectious Disease & Beliaghata General Hospital, Kolkata -10; West Bengal, India
A R T I C L E I N F O A B S T R A C T
The present study was undertaken to evaluate lowland rice genetic variability associated with agro-morphological traits under drought condition. A set of 250 recombinant inbred lines (RILs) from the cross between rice parental cultivarIR64 (sensitive to drought) and ITA112 (tolerant to drought) were used. The experiment was performed at Banfora in Burkina Faso using randomized complete block design with 2 replications. High genetic variability was observed for all studied traits. Moderate to high heritability in broad sense were observed for almost studied traits. Grain yield recorded positive correlation with all traits except day to 80% maturity and number of tillers. Using inclusive composite interval mapping software (ICIM), a total of 7 QTLs were identified for this study distributed on 5 chromosomes (2; 3; 4; 5; 6) and associated with day to 50% heading (QTL50DH), day to
80%maturity (QTL80DM), Biomass (QTLBiom), flag leaf width (QTLFLW), plant height
(QTLPH), panicle length (QTLPL) and percentage of fertile spikelet (QTLPFS). The
percentage of phenotypic variance (PVE) explained by QTLs ranged from 5.45 to 14.58%. QTL50DH, QTL80DM and QTLBiom were overlapped in same region on chromosome 3, which
was in accordance with correlation results among the traits.
INTRODUCTION
Among cereals, rice (Oryza sativa L.) is one of the most important food crops in the world. It is member of genus
Oryza and family Poaceae. In addition to cultivated species that are Oryza sativa (2n= 24 AA), grown worldwide and
Oryza glaberrima (2n=24 AA) grown in Africa (Sajid et al., 2015). Unlike other cereals, rice is cultivated across a much wider range of ecosystems, including irrigated, rainfed upland, rainfed lowland, flooded, and deepwater ecosystems across tropical and temperate climate conditions (Dixit et al., 2014). It Rice is the principal food for the two-thirds of world population. It represent an important place in human nutrition, providing 20% of the calories and 15% of proteins consumed by world’s population (Sajid et al., 2015).
Rice is grown in 117 countries across all habitable continents. According to FAOSTAT (2014), rice production covered a total area of about 163 mha with a global production of about 740 mt and an average yield of about 4,539 kg / ha. The Asian continent ranks first with over 90.1% of world production, followed by America, Africa, Europe and Oceania. China is the leading in production with 206.5 million tons followed by India (157.2 million tons), Indonesia (70.8 million tons), Bangladesh (52.2 million tons) and Viet Nam with 44.9 million tons (FAOSTAT, 2014). It is a staple food for millions of people in Africa. It is grown and consumed in more than 40 countries among the continent. More than 20 million farmers in Africa are engaged on rice production and about 100 million people are dependent on it directly for their livelihood (Nwanze et al., 2006). In sub Saharan Africa, rice
yield has increased from 2.2 t/ha in 2000 to 2.7 t/ha in 2013 (Yao et al., 2016). This yield is low compared with the average yield reported in Asia (4.6 t ha–1), South America (5.2 t ha–1) and North America (8.6 t ha–1) in 2013.
Several factors including insect, diseases, abiotic stress have contributed to low productivity in Africa. Among the major constraints, abiotic factors particularly drought constitutes a serious obstacle for rice production. Drought is the major abiotic stresses affecting plant growth and reducing crop productivity. Crop yield losses due to drought were estimated at 70% (Lang et al., 2013). Thus, where rice is grown, drought is one of the main factors that cause important reduction in yield.
In order to reduce the loss of rice yield caused by drought, new drought tolerant rice varieties are required. Hence, improved tolerance to drought is a goal in rice improvement programs. Drought tolerance is mostly conditioned by many of components responses which interact. Moreover, drought tolerance is a complex trait controlled by minor and major genes and is dependent on the environment; it is one of the most difficult traits to study (Sabouri et al., 2013). Therefore, selection based on the phenotype only, would be difficult for such traits (Dashti et al., 2007). The advent of molecular markers has revolutionized genetic analysis of complex traits. Thus, molecular markers have been widely used to identify quantitative traits loci (QTLs) for complex traits, particularly those that are polygenic in nature such as drought.
The identification of genes or QTLs is one of the prerequisites for rice improvement for drought tolerance using marker
of Current Advanced
Research
Article History:
Received 21st June, 2016
Received in revised form 16th
July, 2016 Accepted 18th August, 2016
Published online 28th September, 2016
© Copy Right, Research Alert, 2016, Academic Journals. All rights reserved.
RESEARCH ARTICLE
ISSN: 2319 - 6475
Key words:
Drought, Inclusive Composite Mapping, Qtl, Rice
International Journal of Current Advanced Research Vol 5, Issue 9, pp 1260-1267, September 2016
assisted selection (MAS). Recent studies have identified QTLs for various agro-morphological traits under drought condition in rice using for almost studies SSR markers (Sabouri et al., 2013; Lang et al., 2013; Sajid et al., 2015; Ye
et al., 2015). Thus using single nucleotide polymorphism (SNP) markers that are more polymorphic than SSR marker can gives more in formatives. According to Rafalski et al., (2002) single nucleotide polymorphism (SNP) markers constitutes a powerful tool for genetic applications due to low assay costs, high genomic abundance, co-dominant inheritance, potential for high throughput analysis and relatively low genotyping error rates. The objectives of the present study were (i) to evaluate genetic variability of rice agro-morphological traits under drought condition and analyse the relationships between these traits, (ii) to identify QTLs associated with agro-morphological traits under drought condition in bi-parental rice population genotyped with SNPs markers using Kompetitive Allele Specific PCR (KASP) genotyping system.
MATERIALS AND METHODS
Plant materials and experimental design
A population of 250 RILs was developed at Africa Rice center research station (6º25.415N and 2º19.684E; altitude: 21 m) located at Cotonou in Benin Republic through single seed descent from a cross between the two Indica parental lines IR64 and ITA112. IR64 is considered as a high yielding cultivar; however it is susceptible to drought in contrast to ITA112 witch is highly tolerant to drought. RILs and their two parents were evaluated in field under drought condition in 2014 from February to July (dry season). The experiment was performed in Banfora site (N: 10°63067 W: 004°77846) located in West of Burkina Faso using randomized complete block design with 2 treatments and 2 replications. The distance between rows and plants was 20 cm. Each line was grown in 3 rows with 15 plants per row. Experiment were managed following high input system with 300 kg of fertilizers (NPK + urea) and optimum weed and pest management. Two weeks cycling drought treatment was imposed from 45 days after sowing (around tillering stage) by withholding irrigation at the paddy field.
Trait measurements
The RILs population was assessed for 12 agro-morphological traits including number of tillers (NT), day to 50% heading (50DH, days after sowing), day to 80% physiological maturity (80DM, days after sowing), plant height (PH, cm), flag leaf length (FLL, cm), flag leaf width (FLW, cm), panicle length (PL, cm), percentage of fertile spikelet (PFS), number of panicle per m2 (NP/m2), biomass (Biom), 1000-grain weight (1000GW) and yield (kg/ha) under drought condition.
Genotyping
Young fresh leaves (2-3 week old) of each RILs and parental plants were sampled for DNA isolation. The genomic DNA was extracted using cetyltrimethylammoniumbromide (CTAB) method (Saghai-Maroof et al. 1994). Quality and quantity of DNA was checked by running aliquots of DNA samples on a 1% agarose gel. DNA was then normalized and shipped to the LGC Genomics genotyping laboratory in UK (http://www.lgcgenomics.com) as described in the user’s manual. A total of 369 SNPs markers distributed throughout
the rice genome were used for this study. Markers were initially screened on the two parents to identify the polymorphic markers. The segregating markers (250) were then used for genotyping in whole RILs population using Kompetitive Allele Specific PCR genotyping system (KASP) assay at LGC Genomics genotyping laboratory in UK.
Statistical analysis
Phenotyping analysis
The data recorded on 12 agro-morphological traits from the RILs studies, were subjected to statistical analysis. Analysis of variance (ANOVA) was performed to access the genotype effect and their interaction using the general linear model (GLM) implemented in Genstat 13th edition software (Payne
et al., 2011). In order to assess and quantify the genetic variability among the RILs for the characters under study the variance components and values of heritability were estimated for each trait. The frequency distributions of all the traits were performed to test the skewness of the traits towards the parents. Correlation analysis was performed using the same software to determine relationship between the characters under drought condition.
QTL analysis
Inclusive Composite Interval Mapping (ICIM) was used to detect QTL-marker for the agro-morphological traits under drought condition using QTL IciMapping software (Meng et al., 2015). The LOD value of 2.5 was selected as the minimum to declare the presence of a QTL in a given genomic region. In addition, additive effects of the detected QTLs and the percentage of phenotypic variance (PVE) explained by each QTL were also estimated.
RESULTS
Phenotyping of mapping population
The mapping population, have been phenotyped extensively for 12 agro-morphological traits. Frequency distribution of RILs and their parents for all the characters studied showed normal distribution pattern (Figure 1). For each of these traits the two parents present significative differences except for flag leaf width. Some RILs showed lower values than their parents for any studied characters, whereas some others showed higher values than the parents, suggesting the involvement of multiple genes with quantitative inheritance for these agro-morphological traits under drought condition.
Relationship between agro-morphological traits under drought condition in rice
Knowledge about correlation degree between the characters is a key factor in plant breeding. Hence, the correlation
is necessary to determine the direction of selection. The correlation coefficients among the agro-morphological traits under drought condition in this study were given in Table 2. Significant and positive correlations were observed between biomass under stress and 1000 grains weight (0.1876), day to 50% heading (0.2577), day to 80% maturity (0.2258), flag
Figure 1 Frequency distribution for 12 agro-morphological in rice under drought of IR64 x ITA212 RILs populations. (a) number of tillers per m2, (b) : day to 50% heading, (c): day to 80% maturity, (d): plant height, (e): number of pani
(i): panicle length, (j): biomass, (k): 1000 grains weight, (k): yield.
Tableau 1 Mean of parents and RILs and estimates of phenotypic coefficient of variation (PCV), genotypic coefficient of variation (GCV)
and broad sense heritability (H
Traits
ITA212 IR64
NT 321.14 441.41
50DH 142.24 121.41
80DM 152.9 145.51
PH (cm) 79.25 67.22
NP 332.4 391.73
FLL (cm) 22.22 18.07
FLW (cm) 1.17 1.16
PSF 35.81 63.93
PL (cm) 22.89 18.69
Biom (g) 10887.5 7150
1000GW (g) 22.28 20.8
Yield (kg/ha) 3804.53 1052.32
NT: number of tillers, 50DH: day to 50% heading, 80DM: day to 80% physiological maturity,
PFS: percentage of fertile spikelet, NP: number of panicle per m
morphological traits under
Knowledge about correlation degree between the characters is a key factor in plant breeding. Hence, the correlation analysis is necessary to determine the direction of selection. The morphological traits under drought condition in this study were given in Table 2. Significant and positive correlations were observed between under stress and 1000 grains weight (0.1876), day to 50% heading (0.2577), day to 80% maturity (0.2258), flag
leaf length (0.1604), flag leaf width (0.2549), number of tillers (0.1584), number of panicles (0.2225), plant height (0.4217), panicle length (0.287) and yield (0.3965). Day to 80% maturity showed also positive and high significant correlation with day to 50% heading (0.7532), biomass (0.2258) and panicle length (
negative correlation with number of panicles ( number of tillers (-0.0356), percentage of fertile spikelet ( 0.4784), 1000 grains weight (
Similar, significant and positive correlation were obtaine
morphological in rice under drought of IR64 x ITA212 RILs populations. (a) number of tillers per m2, (b) : day to 50% heading, (c): day to 80% maturity, (d): plant height, (e): number of panicle, (f): flag leaf length, (g): flag leaf width, (h): percentage of fertile spikelet,
(i): panicle length, (j): biomass, (k): 1000 grains weight, (k): yield.
RILs and estimates of phenotypic coefficient of variation (PCV), genotypic coefficient of variation (GCV) and broad sense heritability (H2b.s) for 12 agronomical traits under drought
MEANS
f proba GCV
IR64 Range RILs
441.41 130 - 775 435.6 ± 8.60 * 7.91
121.41 64 - 158 126.7 ± 0.59 *** 4.75
145.51 138 - 163 145.7 ± 0.24 *** 1.93
67.22 53.4 -106.6 77.33 ± 0.50 *** 6.71
391.73 140 - 625 329.1 ± 6.02 ns 4.83
18.07 11 - 39 21.7 ± 0.34 ns 1.54
1.16 0.7 - 1.9 1.21 ± 0.02 * 2.97
63.93 13.43 - 95 60.39 ± 1.44 *** 12.01
18.69 14 - 29 21.11 ± 0.19 *** 4.83
7150 2450 - 13950 8050 ± 124.55 *** 21.59
20.8 11.25 - 31.28 22.21 ± 0.18 ns 2.2
1052.32 187.7 - 5125 2258 ± 50.11 *** 37.54
day to 80% physiological maturity, PH: plant height, FLL: flag leaf length, FLW
number of panicle per m2, Biom: biomass, 1000GW: 1000-grain weight,
leaf length (0.1604), flag leaf width (0.2549), number of panicles (0.2225), plant height (0.4217), panicle length (0.287) and yield (0.3965). Day to 80% maturity showed also positive and high significant correlation with day to 50% heading (0.7532), biomass ) and panicle length (0.2664), whereas it showed negative correlation with number of panicles (-0.0722), 0.0356), percentage of fertile spikelet (-0.4784), 1000 grains weight (-0.4041) and yield (-0.0275). Similar, significant and positive correlation were obtained
morphological in rice under drought of IR64 x ITA212 RILs populations. (a) number of tillers per m2, (b) : day cle, (f): flag leaf length, (g): flag leaf width, (h): percentage of fertile spikelet,
RILs and estimates of phenotypic coefficient of variation (PCV), genotypic coefficient of variation (GCV) b.s) for 12 agronomical traits under drought
GCV PCV H2b.s
7.91 17.02 21.57
4.75 5.95 63.83
1.93 2.33 68.4
6.71 8.39 63.97
4.83 14.77 10.71
1.54 12.13 1.61
2.97 8.34 12.71
12.01 22.01 29.75
4.83 8.44 32.8
21.59 24.6 77.01
2.2 6.76 10.62
37.54 41.19 83.08
International Journal of Current Advanced Research Vol 5, Issue 9, pp 1260-1267, September 2016
between yield per hectare and 1000 grains weight (0.3502), biomass (0.3965), flag leaf width (0.1356), percentage of fertile spikelet (0.254), plant height (0.4375) and panicle length (0.2566) under drought condition. Among these characters, plant height gives the highest correlation coefficient value with yield following by biomass and 1000 grains weight under drought. In addition, panicle length showed positive correlation with all the characters studies except number of panicle, number of tillers and percentage of fertile spikelet.
Identification of QTL for agro-morphological traits under drought condition
Firstly a total of 369 SNPs markers were used to screen the two parental genotypes IR64 and ITA212. Among the screened 369 SNPs markers, 253 (68.56%) markers showed polymorphism between IR64 and ITA212. These polymorphic markers were used for genotyping the 230 RILs.
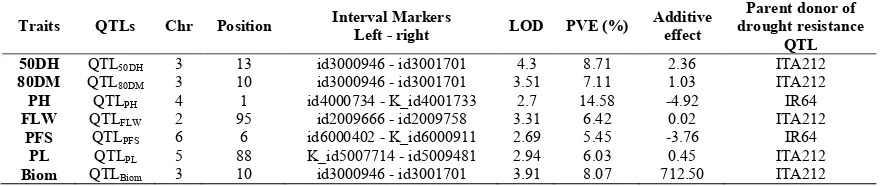
Phenotypic data obtained for all agro-morphological traits studied were analyzed together with genotyping data for all mapped using QTL IciMapping software. The results from Inclusive Composite Interval Mapping (ICIM) showed seven QTLs for seven various agro-morphological traits under drought stress in this study (Table 3, Figures 2 and 3). The seven QTLs identified in the RILs population were distributed on five chromosomes (Table 3). Thus, QTLs for day to 50% heading (50DH), day to 80%maturity (80DM), Biomass (Biom) are located in chromosome 3 and QTLs for fag leaf width (FLW), plant height (PH), panicle length (PL) and percentage of fertile spikelet (PFS) are respectively located in chromosomes 2; 4; 5 and 6.
The LOD value and the phenotypic variance explained (PVE) were respectively ranging from 2.69 for QTLPFS to 4.3 for QTL50DH and from 5.45% for QTLPFS to 14.58% for QTLPH (Figure 2). The PVE was less than 10% for all traits studied
except the percentage of fertile spikelet. Overlapping of QTLs for different traits was identified in this study. For example, QTLs for day to 50% heading (QTL50DH), day to 80% maturity (QTL80DM) and biomass (QTLBiom) under drought stress were mapped to id3000946 - id3001701 region on chromosome 3. Positive values (>0) of additive effects were obtained with the QTLs related to day to 50% heading, day to 80% maturity, flag leaf width, panicle length and biomass. Therefore, the favorable alleles for these QTLs came from the resistant parent ITA212.
However, some negative values of additive effects were obtained with the QTLs for plant height (-4.92) and percentage of fertile spikelet (-3.76) indicating that the favorable alleles were contributed by the susceptible parent IR64.
DISCUSSION
Phenotypic variation
The present study was undertaken to discover QTLs and marker-trait association from the mapping population derived from the cross between drought resistant (ITA212) and susceptible (IR64) parents followed by screening with SNPs markers and subsequently, identify the potential QTLs and markers linked to agro-morphological traits under drought condition. The mapping population consisting of 230 RILs exhibited significant variation for all traits studied except flag leaf length, number of panicles and 1000 grains weight.
This result indicates huge genetic variability existing among the genotypes. So, the parents used for crossing were genetically different.
Table 2 Correlation coefficients among agronomic traits of rice recombinant inbred lines under drought conditions
Traits 1000GW 50DH 80DM Biom FLL FLW NP NT PFS PH PL
1000GW -
50DH -0.29** -
80DM -0.40** 0.75** -
Biom 0.18** 0.2-** 0.22** -
FLL 0.16* 0.139ns 0.09ns 0.16* -
FLW 0.005ns 0.03ns 0.04ns 0.25** 0.24** -
NP 0.06ns -0.05ns -0.07ns 0.22** -0.04ns -0.004ns -
NT 0.21** 0.03ns -0.03ns 0.15* 0.035ns 0.043ns 0.14* -
PFS 0.52** -0.35** -0.47ns 0.002ns -0.01ns -0.025ns -0.03ns 0.19** -
PH 0.38** 0.17** 0.12ns 0.42** 0.41** 0.13* -0.07ns 0.08ns 0.14* -
PL 0.14* 0.22** 0.26** 0.28** 0.39** 0.24** -0.13* -0.04ns -0.05ns 0.52** -
yield 0.35** 0.03ns -0.02ns 0.39** 0.12ns 0.13* 0.03ns -0.004ns 0.25** 0.43** 0.25**
NT: number of tillers, 50DH: day to 50% heading, 80DM: day to 80% physiological maturity, PH: plant height, FLL: flag leaf length, FLW: flag leaf width, PL: panicle length,
PFS: percentage of fertile spikelet, NP: number of panicle per m2, Biom: biomass, 1000GW: 1000-grain weight, *: significant at 0.05 probability level, **: Significant at 0.01
probability level; ns: no significant.
Table 3 QTLs detected for agro-morphological traits under drought stress in IR64 × ITA212 recombinant inbred lines using Inclusive Composite Interval Mapping (ICIM)
Traits QTLs Chr Position Interval Markers
Left - right LOD PVE (%)
Additive effect
Parent donor of drought resistance
QTL
50DH QTL50DH 3 13 id3000946 - id3001701 4.3 8.71 2.36 ITA212
80DM QTL80DM 3 10 id3000946 - id3001701 3.51 7.11 1.03 ITA212
PH QTLPH 4 1 id4000734 - K_id4001733 2.7 14.58 -4.92 IR64
FLW QTLFLW 2 95 id2009666 - id2009758 3.31 6.42 0.02 ITA212
PFS QTLPFS 6 6 id6000402 - K_id6000911 2.69 5.45 -3.76 IR64
PL QTLPL 5 88 K_id5007714 - id5009481 2.94 6.03 0.45 ITA212
Biom QTLBiom 3 10 id3000946 - id3001701 3.91 8.07 712.50 ITA212
Figure 2 QTLs detected for rice agro-morphological traits under drought condition
Figure 3 Mapping of QTLs day to 50% heading, day to 80% physiological maturity, plant height, flag leaf width, panicle length, percentage of fertile spikelet and biomass under drought condition.
50DH: day to 50% heading,
80DM: day to 80% maturity,
PH: plant height,
FLW: flag leaf width,
PL: panicle length,
PFS: percentage of fertile spekelets,
International Journal of Current Advanced Research Vol 5, Issue 9, pp 1260-1267, September 2016
Similar variation and transgressive segregation for various morphological and production traits under drought condition have been reported earlier in several rice lines by Gomez et al., (2006), Amiri Fahliani et al., (2011) and Ahmad et al., (2015). Estimation of genetic variability revealed a magnitude of variation from low too high for PCV and GCV for the traits studied. Also, PCV values were higher than GCV values for all the characters, indicating that the expression of these characters was influenced by environment. Similar results were reported by Lafitte et al., (2004), Gomez et al., (2010) and Sabouri et al., (2013) in rice agronomical traits under drought. The minimum difference between GCV and PCV values were estimated for all the characters except number of panicles (NP), flag leaf length (FLL), flag leaf width (FLW) and percentage of spikelet fertile (PSF) under drought condition indicated minimum environmental influence. Manikya and Reddy (2011); Singh Alok et al., (2015) and Anis et al., (2016) also reported that the PCV was higher than GCV indicating the influence of environment on the characters and also reported the reduction in genetic variance under severe stress condition. High GCV and PCV coupled with high heritability were observed for the characters biomass (Biom) and yield. This indicates the lesser influence of environment in expression of these characters and prevalence of additive gene action in their inheritance. Thus, these characters could be easily improvement through conventional methods under drought conditions. The characters day to 50% heading (50DH), day to 80% maturity (80DM) and plant height (PH) had high heritability with low PCV and GCV, indicating that the characters were governed by both non-additive gene actions. These results are accordance with those of Sadimantara et al., (2014), Sedeek and El-Wahsh (2015); Singh Alok et al., (2015) and Anis et al., (2016).
Correlation analysis
Correlation analysis of characters can be used as tool for indirect selection. In this study, day to 80% maturity showed significant and positive correlation with day to 50% heading and biomass. Also, the character yield showed significant and positive correlation with 1000 grains weight, biomass, flag leaf width, percentage of fertile spikelet, plant height and panicle length under drought condition, indicating that simultaneous selection for these characters would result in improvement of yield. Similar finding are already notified in previous studies (Gomez et al., 2010; Ahmad et al., 2015). Plant height showed a negative correlation with the character number of panicles under drought. Thus, lower plant height results to higher panicle number. This result is in accordance to those of Spielmeyer et al., (2002) and Ahmad et al., (2015). In addition plant height, biomass and 1000 grains weight gives the highest correlation coefficient value with yield under drought. This finding indicated that these characters will be considered in simultaneous selection on enhancing the yield under drought for next population. Similar findings also observed in the study made by Dashti et al., (2007) and Gomez et al., (2010).
QTLs linked to agro-morphological traits under drought
The DNA of the two parents (IR64 and ITA212) was surveyed and 253 (68.56%) of the 369 SNPs primers generated informative polymorphism between the parents. Despite a relatively low number of SNPs markers used in this
cross, the parents exhibited high level of polymorphism as both are indica ecotypes. High level of polymorphism had already been reported between the parents by previous studies (Sabouri et al., 2013 and Ye el al., 2015). In contrast, a low level polymorphism was reported between the parents in the intra-sub-specific and even in inter-sub-specific crosses of rice (Price and Tomos 1997; Ali et al., 2000 and Gomez et al., 2010). This low polymorphism between parents can be attributed to its origin. Varshney et al. (2007) suggested also that the low level of polymorphism can attributed to the marker techniques used.
In this study, the 253 SNPs DNA markers were performed to search potential QTL regions. Using ICIM method, a total of seven QTLs were located that associated with day to 50% heading (50DH), day to 80% maturity (80DM), Biomass (Biom), fag leaf width (FLW), plant height (PH), panicle length (PL) and percentage of fertile spikelet (PFS) under drought condition. The map position and characteristics of QTLs associated with the seven traits under drought condition are presented in Figures 3. The QTL associated to 50DH (chromosome 3 near id3000946 - id3001701) was already mapped to a similar region in previous studies (Lafitte et al., 2004; Gomez et al., 2006). In addition QTLs associated to PL and PSF located in chromosome 5 and 6 were also mapped near the same region by several studies (Kamoshita et al., 2008; Sabouri et al., 2013; Ye et al., 2015). Overlapping of QTLs for different traits was observed in this study. Some QTLs identified for some traits in drought condition were co-localized. Thus, QTLs associated with 50DH, 80DM and Biom under drought stress were mapped to id3000946 - id3001701 region on chromosome 3. These findings were supported by the correlation analysis among traits. Similar collocation of QTLs associated to agronomical traits under drought were reported in the same region early in rice by Gomez et al., (2010) and Lang et al., (2013). Whether this region might contain one or more key genes for drought resistance ability in this mapping population needs to be further tested. Others QTLs associated with PH (chromosome 4) and FLW (chromosome 2) mapped here were also located early in previous studies (Nguyen et al., 2013; Dixit et al., 2014).
CONCLUSION
The lowland rice RILsused in this study showed significant variation in agro-morphological traits under drought condition. Seven QTLs linked to various agro-morphological under drought stress in field condition were identified. Colocation of QTLs associated with day to 50 heading, day to 80% maturity and biomass traits was observed in these rice RILs. In conclusion, the present study has identified QTLs linked to drought tolerance traits in locally adapted indica
ecotypes and may be useful for improved breeding programs using marker assisted selection (MAS) for drought tolerance in rice.
Acknowledgments
The authors thank warmly the whole team of INERA, Cirad and AfricaRice for their active participation to this study. Financial support from General Challenge Program (GCP) is dully acknowledged.
References
Ahmad, F. Hanafi, M.M. Hakim, M.A. Rafii, M.Y. Arolu, I.W. Akmar Abdullah, S.N. 2015. Genetic divergence and heritability of 42 coloured upland rice genotypes (Oryzasativa) as revealed by microsatellites marker and agro-morphological traits. PLoS ONE 10(9): e0138246. doi:10.1371/journal.pone.0138246
Ali, M.L. Pathan, M.S. Zhang, J. Bai, G. Sarkarung, S. Nguyen, H.T. 2000. Mapping QTLs for root traits in a recombinant inbred population from two indica ecotypes in rice. Theor Appl Genet 101:756–766 Amiri Fahliani, R. Khodambashi, M. Houshmand, S.
Arzani, A. Sorkheh, K. 2011. Heritability for some agronomic characters of rice (Oryza sativa L.) and their linked microsatellites identification. Turk J Agric For 35, 481-490c TUBİTAK doi:10.3906/tar-1001-645 Anis, A. EL-Sabagh, A. Ghareb, A. EL-Rewainy, I. 2016.
Evaluation of promising lines in rice (Oryza sativa L.) to agronomic and genetic performance under Egyptian conditions. Int. J. Agri. Agri. R. Vol. 8, No. 3, p. 52-57 ;
Bernier, J. Kumar, A. Venuprasad, R. Spaner, D. Atlin, G. 2007. A large effect QTL for grain yield under reproductive-stage drought stress in upland rice. Crop Sci. 47, 505–517.
Collard, B.C.Y. Jahufer, M.Z.Z. Brouwer, J.B. Pang, E.C.K. 2005. An introduction to markers, quantitative trait loci (QTL) mapping and marker-assisted selection for crop improvement: the basic concepts. Euphytica 142(1–2):169–196
Dashti, H. Yazdi-Samadi, B. Ghannadha, M. Naghavi, M.R. Quarri, S. 2007. QTL analysis for drought resistance in wheat using doubled haploid lines. International Journal OF Agriculture & Biology 1560– 8530/2007/09–1–98–101.
Dixit, S. Huang, B.E. Sta Cruz, M.T. Maturan, P.T. Ontoy, J.C.E. Kumar, A. 2014. QTLs for tolerance of drought and breeding for tolerance of abiotic and biotic stress: an integrated approach. PLoS ONE 9(10): e109574. doi:10.1371/journal.pone.0109574
FAOSTAT, 2014. Statistical data base. Food and Agriculture Organizations of the United Nations. Rome, Italia.
Gomez, S.M. Boopathi, N.M. Kumar, S. Ramasubramanian, T. Chengsong, Z. Jeyaprakash, P. Senthil, A. Babu, R.C. 2010. Molecular mapping and location of QTLs for drought-resistance traits in indica rice (Oryza sativa L.) lines adapted to target environments. Acta Physiol Plant 32:355–364
Gomez, S.M. Kumar, S. Jeyaprakash, P. Suresh, R. Biji, K.R. Boopathi, N.M. Price, A.H. Babu, R.C. 2006. Mapping QTLs linked to physio-morphological and plant production traits under drought stress in rice (Oryza sativa L.) in the target environment. Am. J. Biochem. & Biotech., 2 (4): 161-169 ;
Kamoshita, A. Chandra Babu, R. Manikanda Boopathi, N. Fukai, S. 2008. Phenotypic and genotypic analysis of drought resistance traits for development of rice cultivars adapted to rainfed environments. Field Crops Research 109: 1– 23.
Kumar, R. Venuprasad, R. Atlin, G.N. 2007. Genetic analysis of rainfed lowland rice drought tolerance under naturally-occurring stress in eastern India: Heritability and QTL effects. Field Crops Research. 103 42–52
Lafitte, H.R. Price, A.H. Courtois, B. 2004. Yield response to water deficit in an upland rice mapping population: associations among traits and genetic markers. Theor. Appl. Genet., 109:1237- 1246.
Lang, N.T. Nha, C.T. Ha, P.T.T. Buu, B.C. 2013. Quantitative trait loci (qtls) associated with drought tolerance in rice (Oryza sativa L.). SABRAO Journal of Breeding and Genetics 45 (3) 409-421.
Manikya, C.M. Reddy, T.D. 2011. Studies on genetic divergence in medium duration elite rice genotypes (Orzya sativa L.). J. Res. ANGRAU, 39(4), 122. Meng, L. Li, H. Zhang, L. Wang, J. 2015. QTL
IciMapping: Integrated software for genetic linkage map construction and quantitative trait locus mapping in biparental populations. The Crop Journal 3(3): 269 - 283. Doi:10.1016/j.cj.2015.01.001
Nguyen, N.M.T. Hoang, L.H. Furuya, N. Tsuchiya, K. Nguyen, T.T.T. 2013. Quantitative trait loci (QTLs) associated with drought tolerance in Vietnamese local rice (Oryza sativa L.). J. Fac. Agr., Kyushu Univ., 58 (1), 1–6.
Nwanze, K.F. Mohapatra, S. Kormawa, P. Keya, S. Bruce-Olivier, S. 2006. Rice developmentt in sub-saharanAfrica.J. Sci. Food Agri. 86:675-677;
Payne, R.W. Murray, D.A. Harding, S.A. 2011. An introduction to the GenStat command language (14th edition). VSN International, Hemel Hempstead, UK. Price, A.H. Tomos, A.D. 1997. Genetic dissection of root
growth in rice (Oryza sativa L.). II: mapping quantitative trait loci using molecular markers. Theor Appl Genet 95:143–152
Rafalski, A. 2002. Applications of single nucleotide polymorphisms in crop genetics. Current Opinion in
Plant Biology. 5(2):94–100.
http://dx.doi.org/10.1016/S1369-5266(02)00240-6. PMID: 11856602
Sabouri, H. Dadras, A.R. Sabouri, A. Katouzi, M. 2013. Mapping QTLs for agronomic traits in rice under water stress condition using Iranian recombinant inbred lines population. Journal of Plant Physiology and Breeding
International Journal of Current Advanced Research Vol 5, Issue 9, pp 1260-1267, September 2016
Sadimantara, G.R. Muhidin, Cahyono, E. 2014. Genetic analysis on some agromorphological characters of hybrid progenies from cultivated paddy rice and local upland rice. Advanced Studies in Biology, Vol. 6, no. 1, 7 – 18
Saghai-Maroof, M.A. Biyashev, R.M. Yang, G.P. Zhang, Q. Allard, R.W. 1994. Extraordinarily polymorphic microsatellite DNA in barely species diversity, chromosomal location, and population dynamics. Proceedings of the National Academy of Sciences, USA 91: 5466–5570.
Sajid, M. Khan, S.A. Khurshid, H. Iqbal, J. Muhammad, A. Saleem, N. Shah, S.M.A. 2015. Characterization of rice (Oryza Sativa L.) germplasm through various agro-morphological traits. Sci. Agri. 9 (2), 83-88
Sedeek, S.E.M. EL-Wahsh, S.M. 2015. Performance of some agronomic traits of selected rice breeding lines and its reaction to blast disease. J. Agric. Res. Kafr El-Sheikh Univ., 41(1), 118-134.
Singh Alok, K. Mall, A.K. Singh, P.K. Singh, A.K. 2015. Genetic variability and physiological, biochemical, agromorphological response to drought resistance in upland rice (Oryza sativa L.). SABRAO Journal of Breeding and Genetics 47 (3) 268-277;
Spielmeyer, W. Ellis, M.H. Chandler, P.M. 2002. Semidwarf (sd-1),“green revolution” rice, contains adefective gibberellin 20-oxidase Gene. Plant Biol 99:9043–9048.
Varshney, R.K. Hoisington, D.A. Upadhyaya, H.D. Gaur, P.M. Nigam, S.N. Saxena, K. Vadez, V. Sethy, N.K. Bhatia, S. Aruna, R. Gowda, M.V.C. Singh, N.K. 2007. Molecular genetics and breeding of grain legume crops for the semi-arid tropics. In: Varshney RK, Tuberosa R (eds) Genomic assisted crop improvement genomics applications in crops. Springer, Dordrecht, pp 207– 2420
Yao, N. Lee, C.R. Semagn, K. Sow, M. Nwilene, F. Kolade, O. Bocco, R. Oyetunji, O. Mitchell-Olds, T. Ndjiondjop, M.N. 2016. QTL Mapping in three rice populations uncovers major genomic regions associated with african rice gall midge resistance.
PLoS ONE 11(8): e0160749.
doi:10.1371/journal.pone.0160749
Ye, C. Tenorio, F.A. Argayoso, M.A. Laza, M.A. Koh, H.J. Redoña, E.D. Jagadish, K.S.V. Gregorio, G.B. 2015. Identifying and confirming quantitative trait loci associated with heat tolerance at flowering stage in different rice populations. BMC Genetics (2015) 16:41 DOI 10.1186/s12863-015-0199-7