ISSN: 2319-6505
DETERMINATION OF STABILITY CONSTANT AND RELATED THERMODYNAMICS OF BIVALENT
TRANSITION METAL COMPLEXES WITH DERIVATIVE OF SCHIFFS BASE AS LIGANDS
Prem Mohan Mishra
1., Govind Singh
2., Jai Prakash Mishra
3and Veena Mishra
41Department of Chemistry M L S M College, Darbhanga, Bihar-846004 2Vill – Bijulia, PO – Sher Bijulia, Dist. Darbhanga
3Vill – Kahara, Dist – Saharsa 4Dighiwest, Darbhanga- 846004
A R T I C L E I N F O A B S T R A C T
Schiff’s base ligands were synthesized by the condensation reaction of salicylaldehyde with 7- hydroxy naphthalene – 2 – amine. Nitrate salts of divalent cobalt, nickel, copper and zinc were estimated by standard volumetric and gravimetric methods. Ligand was analysed for elements by literature methods. pH metric titrations were carried out in an inert atmosphere of nitrogen gas at constant ionic strength of 0.1M KNO3 with the help of digital
pH meter and stability constant of complexes of these metals with the ligands synthesized were computed by Irving- Rossoti technique1 modified by Calvin Bjerrum2 at temperature 298K.
The stability constant values of metals for the given ligand at the given temperature were found to be in the order Cu(II) > Ni(II), Co(II) > Zn (II).
This result is in agreement with the natural order proposed by Irving-William.
INTRODUCTION
In continuation of our previous work here also, we have been interested in studying the stability of complexes of transition metals with biologically active ligands.
Here we are presenting determination of stability constant and related thermodynamic parameters of complex compounds using ligands synthesised from salicylaldehyde with 7- Hydroxy naphthalene 2 – amine with bivalent transition metals i.e. Co(II), Ni(II), Cu(II) and Zn(II).
Schiff’s base offers a versatile and flexible series of ligands capable to bind with variety of metal ions to give complexes with varying properties. These complexes are biologically active3, have wide potential applications in many fields such as catalysis4, electrochemistry5 and medicines like anti tumour, anti viral6, anti cancer7 and other many anti bacterial agents8.
Metal ions play vital role in a vast number of widely different biological processes. The interaction of these ions with biologically active ligands is a subject of considerable interest. Some of the biologically active compounds act via Chelation8. A large number of such chelates have been synthesized, their structure and activity have been studied, but little is known about its stability in solution which will be its functioning condition.
Experimental
Nitrate salts of divalent Co, Ni, Cu and Zn all were E. Merck. All other chemicals used were Anal R grade and used without further purification. Elemental analysis of metal salts were
done by volumetric and gravimetric methods11. Double distilled and deionised water was used throughout the experiment. All titrations were done in aqueous-dioxane medium in the ratio 3:2 (v/v). Dioxane was purified by standard method.
Schiff’s base ligands were synthesised by reported method12 2.6 g salicylaldehyde in solution were mixed with 3.0 g 7 – Hydroxy naphthalene – 2 – amine. The mixture was refluxed in the presence of glacial acetic acid for 2 – 2.5 hours. The solution was concentrated and cooled to 00 C. The product obtained was filtered, washed several times and recrystallised from ethanol. The yield of product was nearly 2.10 g
7' – Hydroxynaphthyl – 2 – hydroxy benzene Carbaldimine (HNBCI)
Solution of metal salts, ligands, electrolytes etc were prepared in doubly distilled CO2 free water – strength of various
solutions used were tabulated in table – 1.
pH metric titration of acid, acid + ligand and acid + ligand + metal ion solutions were done at constant ionic strength of 0.1 M KNO3 at temperature 298k in an inert atmosphere of
nitrogen.
The same process of titration were repeated for all the four Co, Ni, Cu and Zn metal ions. The change in colour and appearance of turbidity at particular pH value were recorded simultaneously.
Available Online at http://journalijcar.org
International Journal
of Current Advanced
Research
Article History:
Received 8th September, 2016
Received in revised form 16thOctober, 2016
Accepted 26th November, 2016 Published online 28th December, 2016
© Copy Right, Research Alert, 2016, Academic Journals. All rights reserved.
RESEARCH ARTICLE
ISSN: 2319 - 6475
The change in pH of the solutions with each addition of alkali was recorded in Table no. 2.
RESULTS
A graph was plotted between pH meter reading [B] and volume of alkali added in each case, graph-1. The three titration curves obtained for each metal ions are acid titration curve (a), ligand titration curve (b) and complex titration curve (c) respectively.
The values of volumes (V1, V2, & V3) corresponding to the
same pH values were read from acid, ligand and complex titration curves (a), (b) and (c) respectively from the experimental curves at temperature 298 K given in graph 1.
Table No. – 2
Volume of alkali consumed in different titrations of acid, acid + ligand and acid + ligand + metal ion solution.
Ligand: HNHBCI
Temperature 298
1Kµ0=0.1(M) KNO3, water–dioxane (v/v) = 3:2
Calculation Of
n
A,n
AND PLThe
n
A,n
& PL were calculated using standardexpressions
n
A= 1 + [(V1-V2) / (VO + V1) ] (NO + EO) / TO
L
n
= [ (V3 – V2) / (VO + V1)][(NO + EO) / TO M] x 1/ A
n
PL=log
0 ) /( ) 3 V O B)(V0 (1/antilog
0 V O M T n O L T j
j
jHProton – Ligand Stability Constant.
The ligand titration curve separates from acid titration curve at pH 5.16 at temperature 298 K. The ligand titration curves run parallel to the acid titration curves indicating the smooth
dissociation of ligand. The value of
n
A at various pHreading [B] were calculated from the acid and ligand titration curves (table no. 3) at temperature 298 K. The formation curves obtained from the plot of
n
A vs [B] (graph 2) attemperature 298 K, show that values of
n
A lies between0.3324 and 0.7920. This indicates that ligand is monoprotic. Dissociation of ligand may be given as,
LH H++ L
-The value of proton ligand stability constant was calculated by half – integral method and it was further corroborated by linear plot method (log
n
A/(1-n
A) vs [B](graph 3) attemperature 298 K . Table No 1 Concentrations Used In the Experiment
Metal / Ions
Vo
(mL) Y N
O EO
TOL TOM
Co (II) 100 1 1.0
(M)
1.0 x 10⁻²
(M)
2.4 x
10-3 (M)
5.0 x 10⁻⁴
(M)
Ni(II) 100 1 1.0
(M)
1.0 x 10⁻²
(M)
2.4 x
10-3 (M)
5.0 x 10⁻⁴
(M)
Cu(II) 100 1 (M) 1.0 1.0 x 10
-2
(M)
2.4 x
10-3 (M) 5.0 x 10
-4
(M)
Zn(II) 100 1 1.0
(M)
1.0 x 10⁻²
(M)
2.4 x
10-3 (M)
5.0 x 10⁻⁴
(M)
Vol. of alkali added in
mL
H+ H+ + L
H+ + L + Co(II)
H+ + L + Ni(II)
H+ + L + Cu(II)
H+ + L + Zn(II)
0.0 5.4 5.4 5.5 5.52 5.6 5.6
0.1 5.4 5.8 5.66 5.6 5.56 5.8
0.2 5.6 5.76 5.85 5.86 5.62 5.8
0.3 5.8 5.86 5.92 5.98 5.76 5.92
0.4 5.9 6.34 6.45 6.56 6.38 6.3
0.5 6.2 6.42 6.57 6.74 6.4 6.48
0.6 6.4 6.76 6.85 6.86 6.66 6.78
0.7 6.6 7.34 7.41 7.36 7.28 7.3
0.8 7.7 7.92 7.93 7.86 7.76 7.34
0.9 11.4 8.64 8.63 8.8 8.06 8.82
1.0 12.16 12.28 10.35 10.3 9.74 10.46
1.1 12.48 12.64 11.44 11.56 10.52 11.76
1.2 12.76 12.86 11.8 11.65 10.75 11.96
Graph No. 1 Experimental Curve with ligand – HNHBCI
µ0=0.1 M KNO
3 Temp: 298
1K Water: Dioxane 3:2 (v/v)Table No 3 Ligand: HNHBCI Temperature 298
1Kµ0=0.1(M) KNO3, Water–Dioxane medium (V/V) = 3:2
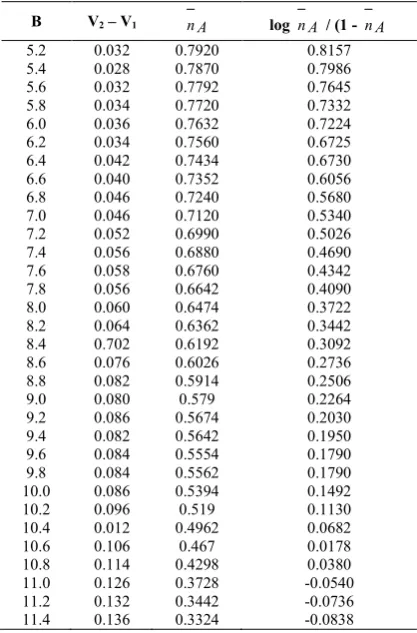
B V2 – V1 nA log nA / (1 - nA
5.2 0.032 0.7920 0.8157
5.4 0.028 0.7870 0.7986
5.6 0.032 0.7792 0.7645
5.8 0.034 0.7720 0.7332
6.0 0.036 0.7632 0.7224
6.2 0.034 0.7560 0.6725
6.4 0.042 0.7434 0.6730
6.6 0.040 0.7352 0.6056
6.8 0.046 0.7240 0.5680
7.0 0.046 0.7120 0.5340
7.2 0.052 0.6990 0.5026
7.4 0.056 0.6880 0.4690
7.6 0.058 0.6760 0.4342
7.8 0.056 0.6642 0.4090
8.0 0.060 0.6474 0.3722
8.2 0.064 0.6362 0.3442
8.4 0.702 0.6192 0.3092
8.6 0.076 0.6026 0.2736
8.8 0.082 0.5914 0.2506
9.0 0.080 0.579 0.2264
9.2 0.086 0.5674 0.2030
9.4 0.082 0.5642 0.1950
9.6 0.084 0.5554 0.1790
9.8 0.084 0.5562 0.1790
10.0 0.086 0.5394 0.1492
10.2 0.096 0.519 0.1130
10.4 0.012 0.4962 0.0682
10.6 0.106 0.467 0.0178
10.8 0.114 0.4298 0.0380
11.0 0.126 0.3728 -0.0540
11.2 0.132 0.3442 -0.0736
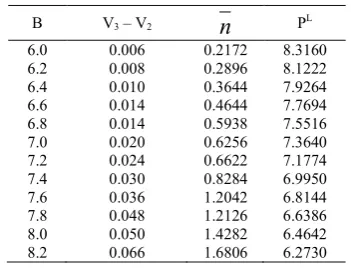
Co(II) –HNHBCI System
Complex titration curves separated from ligand mixture curve at
pH = 6.23 the curves diverge at pH above 9.58.
The value of
n
lies between 0.2172 and 1.6806 (table no. 4 graph no.4a) at temperature 298 K. indicating the formation of ML and ML2 types of complexes.From the formation curves (graph 4a) the values of log K1
and log K2 were calculated by half – integral method13 at
given temperature. The values were further corroborated by mid point slope method14 and linear plot of log
n
/(
1
n
)
vs PL (table no. 5 graph no. 5a) and plot of log ( 2 -)
2
/(
)
n
n
vs PL.(table no. 5, graph 6a) at temperature 298K.Ni (II) – HNHBCI System
The complex titration curves crossed the ligand titration curve at pH = 5.38 indicating the start of complexation. The curve increases regularly upto pH = 7.62 indicating quick but incomplete dissociation of ligand.
No turbidity appears; hence hydrolysis does not take place. values of
n
falls between 0.07 and 1.89 (graph 4b ; table no. 6) at temperature 298 K indicating the formation of ML and ML2 type of complexes.From the formation curves, graph 4b, the values of log K1
and log K2 were calculated by half integral method at given
temperature and verified by mid – point slope method15 and linear plot of log (
n
/
1
n
) vs PL(Table no. 7, graph no. 5b) and plot of log ((
2
n
)
/(
n
1
)
vs PL(Table 7, graph no. 6b).Cu(II) –HNHBCI System
The complex, titration curve separated from ligand mixture curve at pH 6.30 indicating the start of complex formation. As the metal titration curves did not join up and run parallel to the ligand titration curves indicating liberation of extra proton due to hydrolysis which was observed at pH = 8.46. Hence, in order to preclude error due to hydrolysis in the calculation of
n
, only the lower pH region of titration curves were used.The values of
n
lies between 0.04 to 1.90 (graph – 4c, table no. 8) at temperature 298 K indicating the formation of ML and ML2 type of complexes.From the formation curves (graph – 4c, table no. 8) of
n
vs PL, the value of log K1 and log K2 at the given temperaturewere calculated by half – integral method. It was verified by the mid point slope method and straight line plot method and linear plot of log (
n
/
1
n
) vs PL(Table no. 9; graph no. – 5c) and also plot of log ((
2
n
)
/(
n
1
)
vs PL(table no. 9, graph no. 6c).Zn(II) – HNHBCI SYSTEM
The complex curves separated from ligand titration curves at pH = 5.74 and diverges at pH above 7.58
During the titration no turbidity appears, hence hydrolysis does not take place.
The values of
n
lies between 0.056 to 1.68 (table – 10, graph 4d) at temperature 298 K indicating the formation of ML and ML2 type of complexes.From the formation curve (graph –4d) at 298 K values of log K1 and log K2 were calculated by half – integral method.
It was further verified by mid-point slope method and linear plot of log
n
/(
1
n
)
vs PL (graph no. 5d, table no. 11) and plot of log(
2
n
)
/(
n
1
)
vs PL (graph – 6d, table – 11) at temperature 298 K.Graph No. 2 Formation Curve of ligand HNHBCI
Plot of
n
A Vs [B] Temp: 298
1K µ0= 0.1 M KNO3 Water:
Dioxane 3:2 (v/v)
Graph No. 3 Formation Curve of ligand HNHBCI
Plot of log
n
A / (1 -n
A) Vs [B] Temp: 298
1Kµ0= 0.1 M KNO
Table No. 4 Co(II) HNHBCI Temp: 298
1 K µ0=0.1 M KNO 3Water:Dioxane 3:2 (v/v)
B V3 – V2
n
PL6.0 0.006 0.2172 8.3160
6.2 0.008 0.2896 8.1222
6.4 0.010 0.3644 7.9264
6.6 0.014 0.4644 7.7694
6.8 0.014 0.5938 7.5516
7.0 0.020 0.6256 7.3640
7.2 0.024 0.6622 7.1774
7.4 0.030 0.8284 6.9950
7.6 0.036 1.2042 6.8144
7.8 0.048 1.2126 6.6386
8.0 0.050 1.4282 6.4642
8.2 0.066 1.6806 6.2730
Table No. 5 Co (II) HNHBCI Temp: 298
1 K µ0=0.1 M KNO 3Water: Dioxane 3:2 (v/v)
log
n
/(
1
n
)
PL log ( 2 -n
)
/(
n
1
)
PL-0.9764 8.3160 0.8350 6.8140
-0.7300 8.1226 0.4430 6.6386
-0.5402 7.9290 -0.0584 6.4646
-0.3410 7.7384 -0.6506 6.2730
0.3230 7.3640
0.5714 7.1764
Table No. –6 Ni (II) + HNHBCI Temp : 298
1 K µ0=0.1 M KNO 3Water:Dioxane 3:2 (v/v)
[B] V3 – V2
n
PL5.2 0.006 0.0774 9.1114
5.4 0.008 0.2364 8.9180
5.6 0.016 0.3396 8.7262
5.8 0.016 0.4240 8.5350
6.0 0.018 0.5456 8.3460
6.2 0.020 0.6690 8.1580
6.4 0.024 0.7962 7.9712
6.6 0.030 0.9504 7.7870
6.8 0.036 1.0212 7.6042
7.0 0.042 1.2012 7.4254
7.2 0.050 1.3972 7.2486
7.4 0.062 1.6254 7.0770
7.6 0.064 1.8920 6.9132
Table No. 7 Ni (II) + HNHBCI Temp: 298
1 K µ0=0.1 M KNO 3Water: Dioxane 3:2 (v/v)
log
n
/(
1
n
)
PLlog ( 2 -
)
1
/(
)
n
n
PL-0.7004 8.9174 0.5974 6.4256
-0.6258 8.7264 0.1796 6.2486
-0.4182 8.5350 -0.2234 6.0772
-0.0846 8.3466
0.2214 8.1586
0.4606 7.9710
0.8550 7.7872
Table No. – 8 Cu(II) + HNHBCI Temp: 298
1 K µ0=0.1 M KNO3Water:Dioxane3:2(v/v)
[B] V3 – V2
n
PL5.2 0.004 0.0450 9.3096
5.4 0.006 0.1132 9.1154
5.6 0.010 0.1820 8.9220
5.8 0.014 0.2752 8.7304
6.0 0.018 0.3940 8.5416
6.2 0.020 0.5162 8.3530
6.4 0.022 0.6644 8.1680
6.6 0.032 0.8160 7.9832
6.8 0.040 0.9966 7.8026
7.0 0.042 1.1834 7.6234
7.2 0.052 1.4022 7.4776
7.4 0.066 1.6260 7.2772
7.6 0.074 1.9092 7.1158
Table No. – 9 Cu(II) + HNHBCI Temp: 298
1 Kµ0=0.1 M KNO
3 Water:Dioxane 3:2(v/v)
log
n
/(
1
n
)
PLlog ( 2 -
n
)
/(
n
1
)
PL-0.9940 9.1152 0.7472 7.6230
-0.7526 8.9222 0.2726 7.4490
-0.2860 8.5410 -0.3240 7.2772
0.3966 8.1682
0.5486 7.9830
Table No. 10 Zn(II) + HNHBCI Temp: 298
1 Kµ0=0.1 M KNO
3 Water: Dioxane 3:2(v/v)
[B] V3 – V2
n
PL6.0 0.004 0.0564 8.3102
6.2 0.006 0.0852 8.1140
6.4 0.008 0.2682 7.9204
6.6 0.012 0.3424 7.7274
6.8 0.014 0.4204 7.5346
7.0 0.016 0.3256 7.3448
7.2 0.020 0.5094 7.1624
7.4 0.032 0.8992 6.9822
7.6 0.036 1.0352 6.8054
7.8 0.040 1.3516 6.6292
8.0 0.052 1.5730 6.4582
8.2 0.064 1.6802 6.2980
Table No. – 11 Zn(II) + HNHBCI Temp: 298
1 Kµ0=0.1 M KNO
3 Water:Dioxane 3:2(v/v)
Log
)
1
/(
n
n
PL
log ( 2 -
)
1
/(
)
n
n
PL
-0.7946 7.9206 0.6214 6.6292
-0.5932 7.7278 0.0356 6.4582
-0.4262 7.5346 -0.4498 6.2984
-0.2300 7.3442
0.2942 7.1628
0.5010 6.9822
Graph No. 4 Formation Curve
Plot of
n
Vs [PL]Ligand : HNHBCI Temp: 298
1KThe most representative values of log K1 and log K2 obtained
are given in table – 12.
DISCUSSION
The values of stepwise stability constants and over all stability constants are given in table no. 12. For the given ligand the stability constants of complexes for different metals show the sequence
Cu(II) > Ni(II) > Co(II) > Zn(II)
This is natural order given by Irving – William15. A theoretical justification of the order of stability constants follows from the consideration of the reciprocal of the ionic radii and 2nd ionization enthalpy of metal. Calvin – Bjerrum titration technique modified by Irving and Rossotti was used to determine the practical proton ligand and metal ligand stability constants at constant ionic strength maintained by using dilute KNO3 solution. Irving and Rossotti pointed out
that the formation constant of metal chelates can be obtained without converting the pH – meter reading [B] to stoichiometric hydrogen ion concentration and without knowing the stiochiometric concentration of neutral salts added to maintain ionic strength. This method is valid for both aqueous and non-aqueous medium.
The nitrate (NO3) ion has very slight complexing tendency. Therefore, competition between nitrate ion and the ligand under study is of no importance16.
The stability of the chelates is greatly affected by the electron density around the imino nitrogen ( - C = N - )17. Higher the electron density around the nitrogen atom, stronger is the metal ligand bond.
The difference between the successive stepwise stability constant is large, which suggest that the formation of ML and ML2 chelates take place. The results obtained are in
conformity of our previous studies18-26 and other workers21-22
References
1. Irving H.M., Rossotti H.S., J. Chem Soc., 2904, 1954. 2. Bjerrum, J.: Metal amine formation in aqueous
solution. P. Hasse and Sons. Copenhagen 1941. 3. Liu C. M. ; Xiong R.G.; You X. Z.; Liu Y.J.; Cheung
K.K., Polyhedron,15 1996, 45651.
4. Djebbar S.S.; Benali B.O.; Deloume J.P., Transit Metal Chem., 23, 1998,443.
5. Hamada Y.J., IEEE Trans. Electron Devices, 44, 1997, 1208.
6. Srivastava R.S., Ind. J. Chem., 29, 1990, 1024 – 1026. 7. Waish C., Nature, 409, 2001, 226.
8. He L.; Gou S. H. ; Shi Q.F., J. Chem. Crystallogr., 29, 1999, 207.
Graph No. 5
Linear Plot of log(
n
/1-n
) Vs PLLigand : HNHBCI Temp: 298
1K µ0=0.1 M KNO3 Water:Dioxane 3:2 (v/v)Graph No. 6
Linear Plot of log(2-
n
/n
-1) Vs PLLigand : HNHBCI Temp: 298
1Kµ0=0.1 M KNO3 Water:Dioxane 3:2 (v/v)
Table No. – 12 log of stepwise and overall stability constants of complex compounds of various metals with
ligand HNHBCI at 298.
0
= 0.10 (M) KNO3 Water – dioxane medium (V/V)= 3:2
System
Ligand (HNHBCI)
log K1 log K2 log
11.10 - 11.10
Co (II) 7.31 6.31 13.62
Ni (II) 7.22 6.14 13.36
Cu (II) 6.49 5.42 11.91
9. Wu J.C.; Tang N.: Liu W.S.; Tan M.Y. ; Chan A.S., Chin Chem. Lett., 12, 2001, 757.
10. Pandey V. K.; Sarah, T and Zehra T: Indian J. Chem.
43 B, 2004, 180
11. Joshi, L.D.; Kumar, R. and Parmar, S.S., Curr.Sci. 42,1973,847
12. Otto, H. and Houlohan, W.W.; Swiss Pat 1971, 499, 540, Chem Abstr. 75, 1771,20435
13. Djebbar S. S.; Benali B.O.; Deloume J.P. Polyhedron, 16, 1997, 2175.
14. Irving, H. and Rossotti, H. J. J. Chem. Soc. 3397 (1953)
15. Bhattacharrya P.; Parr J.; Ross A. T., Chem. Soc. Dalton, 1998, 3149.
16. Brown D. H., Smith W.E., Teape J.W. et al., J. Med. Chem., 23(7), 1980,729.
17. Mukherjee, S. K. and Rawat N.S., J. Ind. Chem. Soc. 58,614,1981
18. P. M. Mishra et al: Asian Journal of Chemistry vol. 21(7) p – 5055 – 5060 (2009).
19. P. M. Mishra et al: Asian Journal of Chemistry vol. 21(9) p –7195 – 7199(2009).
20. P. M. Mishra et al: Journal of Ultra Chemistry vol. 5(2) p – 131-136 (2009).
21. P. M. Mishra et al: Journal of Ultra Chemistry vol. 9(1) p – 149 - 155 (2013).
22. P. M. Mishra et al: Rasayan Journal of Chemistry vol. 4(2) p – 303-319 (2011).
23. T. Suresh et. al : J. Ind. Council of Chem. Vol. 24(1) pp – 123 (2007)
24. T. Suresh et. al : J. Ind. Council of Chem. Vol. 25(2) pp – 68-70 (2008)
25. P. M. Mishra, Bimlesh Kumar Yadav : Ultra Scientist Vol. 27(3) B, p – 139-154 (2015)
26. P. M. Mishra : Journal of Applicable Chemistry vol. 5 No.-5, p. 1163-74 (2016)
27. P. M. Mishra : Oriental Journal of Chemistry vol. 32 No.-5, (2016)
28. P. M. Mishra : Journal of Ultra Chemistry vol. 12 No.-2,
p. 38-51 (2016)