e-ISSN: 2278-7461, p-ISSN: 2319-6491
Volume 7, Issue 10 [October 2018] PP: 17-23
Comparative analysis about the source identification (tsunami
case in the Black Sea - 7
thMay, 2007)
Orlin Dimitrov
1, Boyko Ranguelov
2 1-Institute of Oceanology-Bulgarian Academy of Science2-Mining – Geological university, St. Ivan Rilski” Corresponding author: Orlin Dimitrov
ABSTRACT
:
Extreme sea level changes have been documented with a lot of photographs, movies and clips recorded by the eyewitnesses during the water surface oscillations at the morning of 7th May, 2007. Short time after the event (less then a week) a field expedition have been organized and explored the consequences on the sea coast. The data about the debris on the coastal line, the moved tetrapodes in walls of the wave breakers, as well as boats disturbed and partially damaged and stories of the eyewitnesses have been collectedNot so many in situ ocean and meteorological measurementsalong the western Black Sea coastline wereavailable during the tsunami event of 7thMay 2007, especiallyconcerning high-frequency (a minute timescale) data. Sea observations were available at a number of locations,including tide gauge measurements conducted at Ahtopoland Varna as well as at Irakllyand eyewitnesses’ reports. The possible sources of tsunami in the area are earthquakes, on land and in the sea landslides and possible atmospheric disturbances. As no earthquakes and on land landslides activity have been registered, two hypotheses have been explored - the tsunami have been produced by a submarine landslide or by atmospheric pressure pulses – both reasonable and suggested by researchers even in the first days after the tsunami event. The numerical simulations of the both possible sources – turbidities and atmospheric pressure pulses gave quantitative results which are under a comparative analysis in this study. It is very important to identify the real origin of this significant event. Both explored methods presented the acceptable results, but the comparison with the observations are still not enough to be considered as real confirmation of the source origin of the case of 7th May, 2007. As it is known the tsunami generation, propagation and interaction with the coast a strongly nonlinear processes, their numerical modeling and assessment are the most important conditions about the new tsunami zoning of the Bulgarian Black Sea coast
KEY WORDS:
tsunami-like event, Black Sea, numerical simulations, comparative analysis, source identification--- --- Date of Submission: 27-12-2018 Date of acceptance: 12-01-2019 ---
---I.
INTRODUCTION
There are a lot of data and results (especially obtained during the last years) about the tsunami cases observed and documented in the Black Sea. [1]. Usually the sources of the described tsunamis have been identified as seismic events – earthquakes with significant magnitudes [2, 3, 4]. As possible sources many authors suggested as well as the on land fast moving landslides and rock falls observed many times in the affected area [5,6]. Some also considered the possibility of underwater slumps as a source of local tsunamis [4].
A tsunami-like extreme sea level disturbance of nonseismic origin was observed on 7thMay 2007 on the Bulgarian Black Sea coast. The maximum wave amplitude was about three meters, and the sea oscillations lasted for several hours. The anomalous behaviour was seen in many places of the coast of Bulgaria and was stronger to the north. Several accounts of eyewitnesses as well as reports of local port authorities and three tide-gauge recordings are available and have been collected and analyzed. As before and during the investigated event, no any seismic and or landslides activity have been reported [7, 8], the only reasonable sources of the sea level disturbances are possible atmospheric changes (so called meteotsunamis) and underwater sliding masses (called “turbidities” [6]). Two hypotheses have been explored - the tsunami have been produced by turbidities or by atmospheric pressure pulses – both reasonable and suggested by researchers even in the first days after the tsunami event..We explore by the numerical modeling the both hypothesis [9, 10].
II.
MATERIALS AND METHODS
(1) sea levelretreat was observed first in time and larger than sea level rise; (2) turbulence and mudcurrents were reported;
(3) oscillations had 4–8 min period; and
(4) maximum and minimum sea levels were +1.2 and−2.0 m, respectively.
Fig.1. Map of the Bulgarian coast with locations named there from Shabla to Ahtopol
(Localities in the northern coasts were more affected by tsunami. To the south, observations of sea level changes were reported only at Sozopol and Ahtopol. Observed sea level maxima and minima are given in figures and displayed in vertical bars. Bathymetric contour lines show the several tens of kilometers wide shelf platform and the rather steep slope from 100 m to 1000 m depth)
The use of comparison methodology for the Black Sea tsunamis has been firstly performed to study the comparison of the historical,instrumental and numerical data investigated in [12].
Then several papers have been published dealing with the event of the 7th May, 2007 and its origin. Different numerical simulation models have been executed using in general the shallow water equations constructed and explored in different numerical simulation codes [10, 9].
Exploiting the results of the numerical simulations and up to now existing uncertainties, we tried to compare the results of the different models and to obtain more reliable conclusions and to solve the problem: What generated the sea level oscillations happened on 7th May, 2007.
Possible Atmospheric Origin
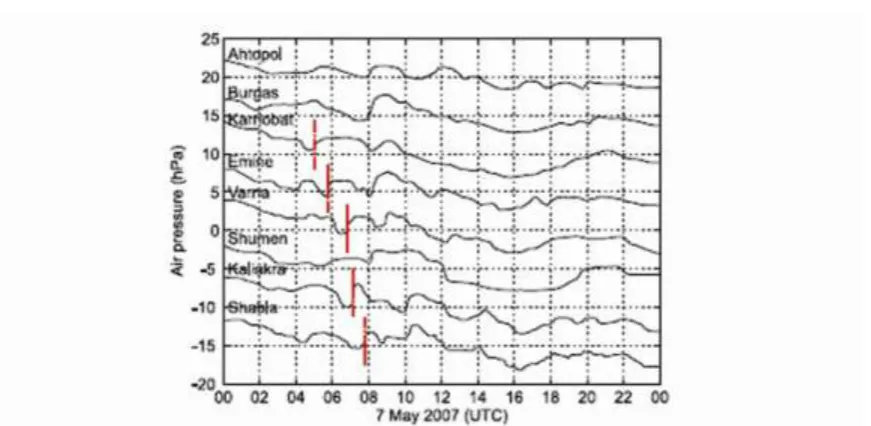
Figure 2 Ground air pressure series at a number of eastern Bulgarian barograph stationsas digitized from barograms of 7 May 2007(Vertical line marks the disturbance whichpresumably generated meteotsunami
waves)
A two-dimensional nonlinear shallow-water model has been used to reproduce the ocean waves generated over the western Black Sea shelf. The model is based on the momentum equations containing the air pressure forcing and the continuity equations. The details are pretty well defined in [10].
Hipothetic Turbidites Slumps Origin
In this part we examine the case of a sea water disturbance bearing the same characteristics of a tsunami that was observed on 7thMay 2007 on the Black Sea coast of Bulgaria. It is a well documented event, seen by several people in many places along the Bulgarian coast, along which it was observed to have varying intensity, stronger in the north and weaker in the south. There is no certain cause for the tsunami, which occurred in the absence of any submarine or on land near field earthquakes. In the following section, we presented the collection of available data and observations first, then considers a number of simulations of tsunamis from submarine mass movements.
The most relevant observed phenomena:
1. In most places people were more impressed by the sea withdrawal than by the sea rise, which may be suggestive that sea retreat was more remarkable than sea level increase.
2. Turbulence, strong water currents, mud waters and foam in some sites (e.g., in Balchik and Kavarna) were observed.
3. The chief period of the oscillations was between 4–8 minutes at most places. 4. The maximum sea level rise and lowering were respectively +1.2 m and -2.0 m.
It is important to point out that, according to the seismic network centre in Bulgaria (NOTSSI– National Observation Telemetric Seismic System of Information) and to the main World Data centers CSEM, IRIS, USGS, no significant earthquakes in the region were recorded on this same day.
For the generating mechanism of the event of 7thMay 2007 we explore the hypothesis of an underwater landslide called turbidities. The candidate detachment region of such a slide is the margin off Bulgaria, that has been recognized to be an area of major submarine mass failures with a number of known movable and active landslide bodies [7]. Further, many underwater fine deposits have been discovered during the exploration surveys related to the oil and gas prospecting works carried out in the 1960’ies and 1970’ies.
with submarine instabilities or that have a role in triggering landslides, that in turn are the direct cause of the tsunami.
The simulations have been performed via the Lagrangian block model developed by the University of Bologna research team, implemented in the UBO-BLOCK2 code. The model discretises the sliding mass into a set of interacting constant-volume blocks. For each block all forces (namely gravity, basal friction, surface drag, buoyancy as well as the interaction with the neighbour blocks) are evaluated and hence the velocity and displacement of the corresponding block centre of mass and of the block boundaries are computed (for further details see [9]).
Simulations show similar dynamics for all examined cases: a velocity peak of about 20 m/s after 200– 300 seconds from motion initiation, followed by a phase of slow deceleration or by a speed plateau. Then a new acceleration is observed, due to a bathymetry steepening in deeper waters. The sliding body reaches 1000 m depth, with a runout of around 20 km. The associated Froude number (the parameter measuring the tsunamigenic potential of the slide, that is here defined as the ratio between the horizontal velocity of the slide and the phase velocity of the tsunami wave, depending on the local sea depth) indicates that the most tsunamigenic phase corresponds to the first acceleration stage (200–300 seconds).
III.
RESULT AND DISCUSION
The results of the numerical simulations about the meteotsunami origin are presented to fig.3.
Except the symmetrical up and down amplitudes, this method is giving the velocity of the currents, which is an important parameter to fit the observations. Visible sea water currents have been reported near Shabla coast (about 1 m/s) and around the Balchik port (in and out water currents in the yacht port of about 50-60 cm/s and a huge water turbulence outside the port with significant larger velocity. Both cases are easy modeled by the meteotsunami simulation (fig.3)
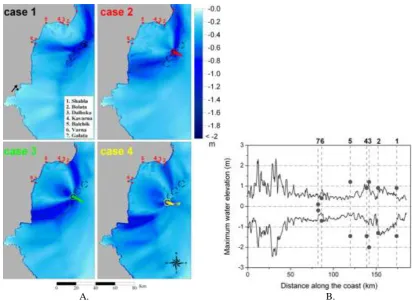
The results of the numerical simulations about the turbidities origin are presented to fig.4A. (all cases) and fig.4B (the most adequate case 4).
A. B.
Figure 4A. Tsunami simulation: fields of minimum sea water elevations are displayed for the four cases of underwater landslide sources with the typical double-beam pattern
(Coastal simulation grid nodes marked by solid circles denote the points where observations of the tsunami were collected and where comparison with the computations are performed. The open circle offshore indicate the assumed source region of the landslides at the top of the shelfbreak. For each case, the computed trajectories of the submarine mass are displayed)
Figure 4B. Case 4: Maximum and minimum water elevations vs. distance along the coast, obtained by the turbidities modeling.(Dashed vertical lines mark the observation positions, solid circles the observed
extremeheight values.)
It is important to mention that the meteotsunami model gives symmetrical oscillations up and down, which is rather rough interpolation to the observations. All of them show higher retreat of the sea level and less intrusion.
In the case of the best fit to the turbidities (case 4 of fig. 4B) the minimum and maximum water oscillations are different and closer to the observations.
Very important to this model is that the focusing effect of the bottom and coastal geometry leading sometimes to significant lateral changes along the coastal line is clearly visible (for example as for Bolata and Dalboka in case 4).
The analyses of the results presented are similar, but at the same time different for some of the observational points. For example the mean difference for Bolata is 0 according the turbidities model. At the same time the highest difference is that to the Balchik port. Probably the closed port increased the observed values due to the resonance effects (this point is still not modeled and considered).
At the same time the meteotsunami simulations have lower amplitude’s differences at Dalboka and Shablapoints, but have highest accuracy about the current velocities in Shabla and Balchik (fig.3b), observed by the eye witnesses.
All these observations and comparison about the two methods did not solve clearly the origin of the observed extreme sea level oscillations due to the 7th May 2007 disturbances.
According to the table it seems more correct to consider the turbidities origin more correct but with a high level of uncertainties.
Table-comparative table of the waves height obtained by the different methods
Point Observed
amplitude min(-), max(+) (real) [m]
Modeled amplitude by the turbidities [m]
Modeled amplitude by the meteotsun. [m]
Mean
difference for the turbidities
Mean difference for the meteotsunami
Average difference
Varna -0.7,+0.4
(1.1)
-0.4,+0/8 (1.2) -0.8,+0.8 (1.6)
10 40 25
Balchik -1.5,+1.2 (2.7) -0.5,+0.5 (1.0)
+0.9,-0.9 (1.8)
170 90 180
Kavarna -1.8,+0.9 (2.7) -0.8,+1.1 (1.9)
-1.0,+1.0 (2.0)
80 70 75
Dalboka -2.0,+1.2 (3.2) -1.0,+1.2 (2.2)
-0.9,+0.9 (1.8)
50 140 95
Bolata -1.3,+0.9 (2.2) -1.3,+0.9 (2.2)
-0.7,+0.7 (1.4)
0 80 40
Shabla -1.5,+0.9
(2.4)
-1.0,+0.5 (1.5)
-0.5,+0.5 (1.0)
90 140 115
IV.
CONCLUSIONS
1. A comparative analysis is performed using data of the observations and numerical simulations of the two different origin sources of the tsunami generation mechanisms of the observed sea level oscillations happened on 7th May, 2007.
2. Both models explain some of the features observed on the field as at the same time significant differences between the simulated results and the observations exist.
3. The average error established during this research does not permit us to be clearly supporting one of the suggested hypotheses. The lower errors of the turbidities simulations, as well as the geological conditions in the area of possible turbidities movements and some confidential and not secure data about underwater fresh slide masses observed after the event by the submarine vessel of the Institute of Oceanology (BAS), gives us the possibility to consider the origin of the observed sea water oscillations on 7th May 2007 as more probable of the turbidities tsunami driving mechanism.
Acknowledgments: This work is supported by the Contract DNTS/Russia02/20 (27.06.2018)
REFERENCES
[1]. Papadopoulos G., G. Diakogianni, A. Fokaefs, and B. Ranguelov., 2011. Tsunami hazard in the Black Sea and the Azov Sea:A new tsunami catalogue., Nat. Hazards Earth Syst. Sci., 11, 945–963,doi:10.5194/nhess-11-945-2011
[2]. Ranguelov B., 2010. Atlas of the tsunami risk susceptible areas along the Northern Bulgarian Black Sea coast – Balchik site. 25 p. ISBN 978-954-9531-15-2.
[3]. Ranguelov B., 2011. Natural Hazards – nonlinearities and assessment, Acad. Publ. House (BAS), ISBN 978-954-332-419-7, 327 pp.
[4]. Ranguelov B., 2013, Risk profiles and hazards for the Black Sea area. In Landslide Science and Practice, Vol. 7: Social and Economic Impact and Policies (Editors:Claudio Margottini, Paolo Canuti, Kyoji Sassa), ISBN: 642-31312-7, (Print) 978-3-642-31313-4 (Online). DOI 10.1007/978-3-978-3-642-31313-4, Springer-Verlag, Berlin, Heidelberg. pp. 3-9.
[5]. Ranguelov B., 2003, Possible tsunami deposits discovered on the Bulgarian Black Sea coast and some implications, in “Submarine Landslides and Tsunamis”., (Eds. A.Yalciner, E.Pelinovsky, E.Okal, C. Synolakis), Kluwer Acad.Publ., pp. 237-242.
[6]. Evstatiev D., Y. Evlogiev, M. Nedelcheva., 2017. The landslides Zapadni Karamanlii and Momchilski Rid - Balchik Black Sea Coast. REVIEW OF THE BULGARIAN GEOLOGICAL SOCIETY, vol. 78, part 1-3, 2017, pp. 19-39
[7]. Dobrev N., 2011. 3D Monitoring of geological hazard processes in Bulgaria., BlackSeaHazNet Series, vol.2. Tbilisi, Workshop 13-16 Sept. 2011, pp. 135-146.
[8]. Avramova-Tacheva, E., KostakB., N. Dobrev., 1998. Present RESENT Dynamics of a landslide process in the Black Sea coast region of Varna (BULGARTA). ACTA MONTANA IRSM AS CR (1998). series A No.12(107), pp.5 -15
[10]. Vilibić Iv., Šepić J., Ranguelov B., Mahović N.S., Tinti S. Possible atmospheric origin of the 7th May 2007 western Black Sea shelf tsunami event // JGR 2010.Vol. 115, C07006, P. 1-12., 2010, doi:10.1029/2009JC005904
[11]. Monserrat S., I. Vilibić, and A. B. Rabinovich. Meteotsunamis:Atmospherically induced destructive ocean waves in the tsunami frequency band // Nat. Hazards Earth Syst. Sci., 2006. 6, P. 1035–1051, doi:10.5194/nhess-6-1035-2006.1
[12]. Yalçiner A., E. Pelinovsky, T. Talipova, A. Kurkin, A. Kozelkov, and A. Zaitsev. Tsunamis in the Black Sea: Comparison of the historical,instrumental and numerical data // J. Geophys. Res., 2004. 109, C12023, doi:10.1029/2003JC002113.