Abstract—A sampling program was conducted to assess watershed influences such as land use, catchment size and weather periodic variability on water quality of Kinta River. The percentage of land use of five predictor variables specifically forested land, agricultural land, developed area, water body and mine area were extracted from entire catchment and buffer zone with radii ranging from 200 to 1000 m. Correlation and regression analysis were conducted against twelve water quality parameters at ten selected water quality monitoring stations within the Kinta River watersheds. In most cases, the entire catchment landscape characteristics appear to have slightly greater influence on water quality rather than the specific sampling site of predetermined buffer radii. Percentages of developed area and water body indicate significant positive relationship within the entire catchment, but no significant relationship found at most of the sites within the buffer radii on the concentrations of water pollutants. Percentages of forested land and agriculture land show significant negative relationship with most of the water quality parameters tested within the entire catchment and site within the buffer radii respectively. Night-time was proved to discharge more effluents from agricultural land, industrial and residential areas.
Index Terms—Buffer zone radii, correlation and regression, land use, water quality.
I. INTRODUCTION
In recent years, results of many conducted research show that the watershed management and catchment scale have become an important factor in determining the impact of human development on water quality as well as of the receiving waters. Many studies around the world indicated that land use has a strong impact on water quality, and significant correlations exist between water quality parameters and land use types [1]–[5]. The impacts of land use on water quality found in the aforesaid studies are all caused by human activities including agricultural activities, forest management, and industrial and residential wastes discharge. Human activities would potentially impair the water quality, which subsequently reduce the utility of water as a resource, and degrade the aquatic ecosystems. Geographic information system (GIS) software and increasingly available land use data facilitate watershed analysis by linking indicators of landscape condition to water quality parameters [6]–[8].
Manuscript received January 30, 2012; revised March 8, 2012. Y. Azyana is with School of Distance Educations, Universiti Sains Malaysia (USM), 11800 Minden, Penang, Malaysia (e-mail: yana_hyt@ yahoo.com).
N. A. Norulaini is with the Division of Biological Sciences, School of Distance Educations, Universiti Sains Malaysia (USM), 11800 Minden, Penang, Malaysia (e-mail: [email protected])
Kinta River lies between latitude: 4.1° and longitude: 101.0166667°. The major tributary of the Kinta River from the northwest is the Pari River (245 km2) which joins at
Ipoh. Kinta River is one of the sources of water supply in Perak and is considered as a significant tourist attraction among other well-known heritage in this country. However, the quality of its water has deteriorated and currently has been classified as under average, i.e. Class III and IV of Interim National Water Quality Standards of Malaysia (INWQS) with a water quality index (WQI) of 51.9 to 76.5 which is considered as moderate clean and an extensive treatment is required. Deterioration of the river is synonymous to the degradation of its water quality due to the multifarious pollutants that find their way into the river from various sources. These sources are closely annexed to the use of the land within the river surroundings or transported long distance via the water medium to ultimately accumulate high enough a concentration. Water quality can be affected either directly or indirectly by activities conducted within a watershed.
This study illustrates the use of GIS combined with statistical analysis as an effective spatial data analysis tool in a watershed study. The objectives of this study are (1) to determine the effects of human (land use) activities and natural landscape influences on water quality; (2) to compare the influences of the sampling sites buffer zone radii of 200 m, 500 m and 1000 m and the whole catchment landscape characteristics on water quality; and (3) to investigate the water quality changes in the river based on three diurnal changes of the day for prediction of peak period of pollution.
II. MATERIALS AND METHOD
A. Site Selection and Data Sets
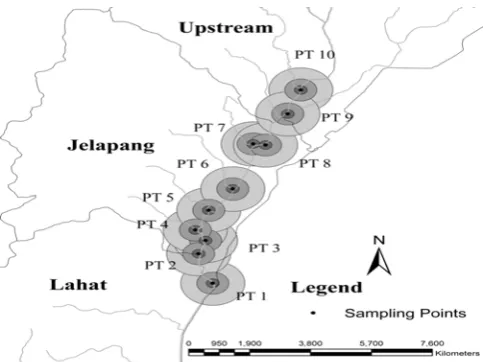
Ten sampling points were selected within three watersheds located adjacent to each other at the upper regions of Kinta catchment (Fig. 1). A complete set of 90 samples were obtained within three days. On each day of sampling, three trips were made in response to the diurnal rhythm of in-stream activities at the three watersheds. The first trip was made before in-stream activities at 8 a.m., second trip was made during the afternoon peak session at 12 p.m. whilst the third trip was done after the evening peak session at 8 p.m. This schedule was repeated three times, starting on Friday, being the last day of the working week and continuously repeated the whole weekend. The time and days were chosen based on the characteristic of river-discharged pattern as well as on the region’s growing season. Twelve water quality parameters determined were
The Entire Catchment and Site Buffer Radii Landscape
Variables, Urban Land Use as Predictors of Water Quality
Variation
temperature, dissolved oxygen (DO), conductivity, salinity, total dissolved solids (TDS), pH, chemical oxygen demand (COD), turbidity, nitrate, phosphate, biochemical oxygen demand (BOD) and suspended solids (SS) to represent the state of surface water quality.
Fig. 1. Buffer of radii of 200 to 1000 m surrounding the water sampling sites.
B. GIS Analysis
ArcView [9], a vector-based GIS software package, was used to determine the composition of the land use and its characteristics within the three watersheds. For each of the sub-watersheds, ArcView’s buffer facility was used to extract landscape data for the area 200 m, 500 m and 1000 m that will allow a comparison of the influence of landscape data on water chemistry.
C. Statistical Analysis
Multiple regression [10] was used to determine whether landscape factors have positive or negative influence on different water quality variables and how strong this interaction is, using five predictor variables (forested land, agricultural land, developed area, water body and mine area variables).
III. RESULTS
A. Relationship between Agricultural Land and Water Quality
Most of the water quality parameters of night samplings such as temperature, conductivity, salinity, TDS, pH and COD that gave a significant negative relationship between the percentage of agricultural land and the concentrations of water quality parameters were found most at buffer radii (500 m and 1000 m). Generally, the watersheds with a lower percentage of agricultural land will have much higher percentage in developed area that might become the primary pollution sources of the river. Hence, night sampling sessions with 500 m buffer radius were proven to be the most perfect condition indicating the higher percentage of agricultural land as a good predictor of water quality parameters.
B. Relationship between Developed Area and Water Quality
Percentage of developed area in all buffer areas in and around the sampling sites is higher than the percentage of whole catchment. This higher percentage leads to both significant and insignificant positive and negative correlations with twelve water quality parameters. Otherwise, the whole catchment gave the most significant positive relationship. TDS demonstrated the strongest positive correlation in the morning and night sampling sessions with r = 0.71 and r = 0.67 respectively. While BOD concentrations seemed to have the strongest relationship during night session (r = 0.68). Significant negative relationship was observed between DO and developed areas for all sessions. Higher percentage in developed area leads to the degradation of river water quality. No significant relationships were observed between percentage of developed area and salinity, TDS, COD, turbidity, phosphate, BOD and SS for all sampling sites and the buffer regions. This result indicates that the developed area is generally associated with lower concentration of water pollutants.
C. Relationship between Forestland and Water Quality Percentage of forestland was observed to have significant positive relationship with DO concentrations for all sessions and sampling sites. This strong relationship suggests that forestland is a good predictor of water quality where higher percentage of DO will lead to the increment of DO level. In addition, other parameters such as temperature and pH were estimated to have negative relationship with the percentage of forestland, meaning that the temperature and pH of the river water are independent of the extent of forest-covered land. However, not all the relationships were significant and because of that, the forested land might not be an important factor of most water quality indicators. Thus, the relationship between percent coverage of forestland and these water quality parameters becomes weaker as the development level increases.
D. Relationship between Water Body and Mine pool Area and Water Quality
Significant positive and negative relationships in respect to the water body and mining pools respectively were observed in most water quality parameters of the whole catchment. However, for all sampling sites and its buffer regions, the water body area and mining pools gave insignificant relationship to the water quality, which indicated there were no pollutant sources of concern that would affect these two indicators. Hence, these two indicators are not the key issues of disconcert over water quality of Kinta River.
F. Relationship between Diurnal Changes of the Day and Water Quality
Night-time became the most preferred time for discharging all the effluents either from agricultural land or developed land especially from the industrial and residential areas. Table I shows that night-time either from whole catchment or sampling site buffer radii of 200 m, 500 m or 1000 m gave the strongest influence on the water quality parameters compared to mornings and afternoons. Positive sign (+) represents a significant positive correlation while negative sign (−) represents a significant negative correlation and no symbol represents no significant correlation. The parameters that do not have any significant relationship with any predictors are not included in the table.
TABLEI:RESULT OF MULTIPLE REGRESSION OF THE EFFECT OF
LANDSCAPE WITHIN THE ENTIRE CATCHMENT AND BUFFER RADII ON
WATER QUALITYOVER THREE DIURNAL PERIODS.
Forest Ag Dev WB Mine R2
a) Morning sampling time Entire catchment
Temperature − 0.50
DO + − − + 0.40
Conductivity − + + − 0.76
Salinity − − + 0.32
TDS − + + − 0.55
pH 0.10
COD − + + 0.27
Turbidity 0.09
Nitrate − + + 0.35
Phosphate − + + 0.95
BOD − + + 0.52
SS − + 0.33
200 m buffer radius
Temperature + + 0.60
500 m buffer radius
Temperature + 0.64
DO + + − + 0.61
Conductivity − − 0.57
TDS − 0.30
1000 m buffer radius
Temperature + 0.62
DO + + 0.33
Conductivity − 0.40
Forest Ag Dev WB Mine R2
b) Afternoon sampling time Entire catchment
Temperature − + − 0.37
DO + + − − + 0.44
Conductivity − + + − 0.65
Salinity − + + 0.51
TDS − + + − 0.65
COD − 0.23
Nitrate − + 0.20
Phosphate − + + 0.91
BOD − + + 0.50
SS + 0.28
200 m buffer radius
Conductivity + + 0.41
Salinity + + 0.36
TDS + + 0.41
SS + 0.24
500 m buffer radius
DO + + − + 0.57
Conductivity − − 0.62
TDS − + 0.62
1000 m buffer radius
DO + + − + 0.46
Forest Ag Dev WB Mine R2
c) Night sampling time Entire catchment
Temperature − + − 0.27
DO + − − + 0.56
Conductivity − + + − 0.79
Salinity − + + − 0.50
TDS − + + − 0.79
pH − 0.36
COD − 0.36
Turbidity + 0.27
Nitrate − + + 0.51
Phosphate − + + 0.74
BOD − + + 0.47
200 m buffer radius
Salinity + + 0.48
Nitrate + − 0.20
Phosphate + + 0.41
BOD + + 0.3
500 m buffer radius
Temperature − − + − 0.38
DO + + − + 0.68
Conductivity − − + − 0.66
Salinity − − 0.63
TDS − − 0.67
pH − − + + 0.43
COD − 0.31
Nitrate − 0.29
1000 m buffer radius
Temperature − − + − 0.40
DO + + − 0.54
Conductivity − 0.52
Salinity − 0.47
TDS − 0.52
pH − − + 0.42
COD − 0.42
# Dev = Developed area, Mining = Mining area, Forest = Forested area, WB =Water body area, Ag =Agricultural land
IV. DISCUSSION
Developed land, including commercial, residential, industrial, and recreational premises, are usually related to water degradation caused by various human activities, including discharges of residential, municipal, and industrial sewage, fertilizer and pesticide use in vegetable farms, fruit orchards and rubber and oil palm plantations, so higher percentage of developed land is usually associated with higher concentrations of water-borne pollutants in different watersheds around the world [1]–[3], [5], [13]. Otherwise, no significant relationships were observed in most areas within the buffer radii of the sampling sites even though there was higher percentage of developed area compared to other land use predictors. A relationship between land use type and water quality parameters found in one study might not be true or even opposite in other studies. In certain cases, higher percentage of developed area did not contribute much to river pollution or rather is not a significant contributor to the river degradation as obtained in this research. The main reason due to this result is the watershed characteristics which were defined earlier and the pollution sources are not the same in different places. Thus, the adverse impact of land use changes on the water quality is more substantial in less-urbanized suburban areas than in highly urbanized areas.
Jelapang watershed is the most developed watershed compared to the other two watersheds. The rapid population growths, land development within the river basin, urbanization and industrialization have subjected the river to increased stress, giving rise to water pollution and environmental deterioration of the rivers [14]. Accumulation of wastewater from scattered industrial areas [15] released to the nearest river from Jelapang watershed caused the increased levels of some water quality variables equating to water pollution. Most of the rivers in the urban areas of the developing world are the end points of effluents discharged from the industries [16]. Nowadays, the enforcement of law and policies regarding effluent discharge to watercourse (i.e Environmental Quality (Industrial Effluent) Regulations 2009) have improved; nonetheless still remain inefficient to markedly meet the water quality criterion of ‘not polluted’. Certain industries have resorted to discharging untreated of partially treated industrial effluent into the river, leading to the water quality degradation. These illegal discharges frequently take place at night. When the effluent fails to meet the regulatory standard, the fine assessed tends to be so low that the enterprises simply can pay the fines and continue the pollution process, rather than upgrade the pollution control measures.
Generally, the watersheds with a lower percent agricultural land will have much higher percentage in developed area that might become the primary pollution sources to the river water. The percentage of agricultural area for this research appeared only in small amounts for PT 8 (only for 1000m buffer) and PT 9-PT10 (all buffer radii). Agrobased industries such as oil palm plantations, rubber estates, orchards and a multitude of horticulture dominate these upstream areas. Results of the correlation analysis showed that most of the water quality parameters of night session such as temperature, conductivity, salinity, TDS, pH and COD that gave a significant negative relationship
between the percentage of agricultural land and the concentrations of water quality parameters were found most at buffer radii (500m and 1000m). Reference [17] also examined the relationship between land use and water quality where the percentage of developed area that ranged from 18.0 to 74.9% while percentage of agricultural land that is below than 10% supported this concrete finding.
The accelerated urbanization worldwide has transformed agricultural landscape patterns, affected their ecological functions and processes, and finally threatened human sustainability [18]–[20]. Agricultural landscapes in many regions, evidenced by numerous cases, have become highly fragmented and transformed in response to intensive settlement expansion [21]–[22]. Under such circumstances, interpreting the relationships between agricultural landscape patterns and urbanization should provide important references for ecological planning and management.
Another factor that also appeared important in this study to determine the water quality changes is the extent of forest coverage. Undisturbed forest areas do not affect the water quality, as expected, except in a few cases where the influence of point source pollution such as from quarry located in the forest or non point sources from logging activities, most likely masked the interaction. However, in general, undisturbed forestland has little impact on water quality. Forest is mostly related to good water quality in various studies in different watersheds around the world [1]–[22], [4]. This significant negative relationship suggested that forestland is a good predictor of water quality, and lower percentage of forestland is usually related to higher concentrations of water pollutants.
The degree of pollution is generally assessed by studying physical and chemical characteristics of the water bodies [23]. Nights are the best times for discharging untreated or partially treated effluents especially from industrial areas and the statistical analyses show a strong relationship between samples taken at night and the water quality parameters measured. Sullage or grey-water is synonymous to the household or residential discharges where it is defined as wastewater without any input from toilets (excreta) mainly originates from kitchen sinks, washing machines, bathrooms, restaurants, wet markets and car washing centers. Sullage contains untreated organic materials, household chemicals and pathogens that can cause serious damage to the river ecology. It is very polluting in nature and must be treated properly before being allowed to enter the water body.
V. CONCLUSION
Based on the findings, and from the multiple statistical techniques, correlations between lands use predictors and water quality variables have been elucidated. The preliminary results show that there are clear differences between catchments with varying land uses that are worth further investigation. Results also show that there are changes in water quality parameters through the diurnal changes of the day. Night periods are when the discharge of the effluents is the greatest, especially from industrial areas. Water quality parameters are being influenced more by activities conducted within the entire catchment rather than within a smaller zone within the sampling sites as defined by the buffer zone radii 200 m, 500 m and 1000 m. Forested land has no effect on river water quality. On the other hand, rivers running through and near developed areas, are seriously influenced by the activities within the whole catchment, rather than specifically based on the narrow zones of up to 1000 m around the sampling sites. While agricultural land has been found is not to be a major contributor to the river pollution, to the contrary of the findings of previous researches.
ACKNOWLEDGMENT
Author thanks Mr. Mohamad Afizi Jamadin at Buditrans Consult Sdn Bhd for providing digitized maps and information on local watersheds, Mrs. Nur Amaleena Radzali that provided statistical advice and Ms. Nurul Jannah Hasnan, Mr. Arif Razali, Mr. Muhammad Hafizie Yusuf and Ms. Ch’ng Chin Ee gave technical assistance.
REFERENCES
[1] L. Sliva, and D. D. Williams, “Buffer zone versus whole catchment approaches to studying land use impact on river water quality,” Water
Research, vol.35, pp. 3462-3472, 2001.
[2] K. P. Woli, T. Nagumo, K. Kuramochi, and R. Hatano, “Evaluating river water quality through land use analysis and N budget approaches in liverstock farming areas,” Science of the Total
Environment, vol. 329, pp. 61-74, 2004.
[3] M. H. Mehaffey, M. S. Nash, T. G. Wade, D.W. Ebert, K. B. Jones, and A. Rager, “Linking land cover and water quality in New York City’s water supply watersheds,” Environmental Monitoring and
Assessment, vol. 107, pp. 29-44, 2005.
[4] J. E. Schoonover, B. G. Lockaby, and S. Pan, “Changes in chemical and physical properties of stream water across an urbane rural gradient in western Georgia,” Urban Ecosystems, vol. 8, pp. 107-124, 2005.
[5] M. I. Stutter, S. J. Langan, and B. O. L. Demars, “River sediments provide a link between catchment pressures and ecological status in a mixed land use Scottish River system,” Water Research, vol.41, pp. 2803-2815, 2007.
[6] C. T. Hunsaker, and D. A. Levine, “Hierarchical approaches to the study of water- quality in rivers,” Bioscience, vol. 45, pp. 193–203, 1995.
[7] G. D. Johnson, W. L. Myers, and G. P. Patil, “Predictability of surface water pollution loading in Pennsylvania using watershed-based landscape measurements,” J. Am. Water Resour. Assoc., vol. 37, pp. 821–835, 2001.
[8] F. R. Kearns, N. M. Kelly, J. L. Carter, and V. H. Resh, “A method for the use of landscape metrics in freshwater research and management,” Landsc. Ecol., vol. 20, pp. 113–125, 2005.
[9] ESRI, ArcView User’s Manual, Environmental Systems Research Institute, Redlands, California, 1996, pp. 1–349.
[10] MathSoft, S-plus, Version 4.0 for Windows, MathSoft Inc., Seattle, WA. 1998, pp. 1–243.
[11] D. L. Strayer, R. E. Beighley, L. C. Thompson, S. Brooks, C. Nilsson, G. Pinay and R. J. Naiman, “Effects of land cover on stream ecosystems: roles of empirical models and scaling issues,”
Ecosystems, vol. 6, pp. 407–423, 2003.
[12] L. L. Osborne, and M. Wiley, “Empirical relationships between land use/cover and stream water quality in an agricultural watershed,”
Journal of Environmental Management, vol. 26, pp. 9–27, 1988.
[13] S. T. Y. Tong, and W. Chen, “Modeling the relationship between land use and surface water quality,” Journal of Environmental
Management, vol. 66, pp. 377-393, 2002.
[14] P. Sumok, “Riverwater quality monitoring: sharing Sarawak experience,” Proc. 6th Sabah Inter-Agency Tropical Ecosystem (SITE) Research Seminar, Kota Kinabalu, Malaysia, September 13– 14, p. 4. 2001.
[15] M. Wang, M. Webber, B. Finlayson, and J. Barnett, “Rural industries and water pollution in China,” Journal of Environmental
Management, vol. 86, pp. 648–659, 2008.
[16] O. Phiri, P. Mumba, B. H. Z. Moyo, and W. Kadewa, “Assessment of the impact of industrial effluents on water quality of receiving rivers in urban areas of Malawi,” Int. J. Environ. Sci. Technol., vol. 2, pp. 237–244, 2007.
[17] J. Tu, and Z. G. Xia, “Assessing the impact of land use changes on water quality across multiple spatial scales in eastern Massachusetts,”
Middle States Geographer, vol. 39, pp. 34-42, 2006.
[18] B. Fu, C. Hu, L. Chen, O. Honnay, and H. Gulinck., “Evaluating change in agricultural landscape pattern between 1980 and 2000 in the Loess hilly region of Ansai County, China,” Agriculture,
Ecosystems & Environment, vol. 114, pp. 387-396, 2006.
[19] C. Schleupner, and P. M. Link, “Potential impacts on important bird habitats in Eiderstedt (Schleswig-Holstein) caused by agricultural land use changes,” Applied Geography, vol. 28, pp. 237-247, 2008. [20] R. Hewitt, and F. Escobar, “The territorial dynamics of fast-growing
regions: unsustainable land use change and future policy challenges in Madrid, Spain,” Applied Geography, vol. 31, pp. 650-667, 2011. [21] H. Long, Y. Liu, X. Wu, and G. Dong, “Spatio-temporal dynamic
patterns of farmland and rural settlements in Su-Xi-Chang region: implications for building a new countryside in coastal China,” Land
Use Policy, vol. 26, pp. 322-333, 2009.
[22] S. Su, Z. Jiang, Q. Zhang, and Y. Hang, “Transformation of agricultural landscapes under rapid urbanization: a threat to sustainability in Hang-Jia-Hu region,” China. Applied Geography,
vol. 31, pp. 439-449, 2011.
[23] M. Duran, and M. Suicmez, “Utilization of both benthic macroinvertebrates and physicochemical parameters for evaluating water quality of the stream Cekerek (Tokat, Turkey),” J. Environ.
Biol., vol. 28, pp. 231-236, 2007.
[24] P. R. Kannel, S. Lee, Y. Lee, S. R. Kanel, and S. P. Khan, “Application of water quality indices and dissolved oxygen as indicators for river classification and urban impact assessment,”
Environ. Monit. Assess., vol. 132, pp. 93 -110, 2007.