e-ISSN: 2278-067X, p-ISSN: 2278-800X, www.ijerd.com
Volume 12, Issue 12 (December 2016), PP.47-52
Basic Study on Discharge flow Characteristics of Roller Tube
Pump
Shinji Akitomi
1,2,Koichi Hirose
3,Takashi Fukue
4,Jun Suzuki
51,3,4,5Iwate University, 4-3-5 Ueda, Morioka, Iwate Japan.
2 National Defense Medical College, 3-2, Namiki Tokorozawa, Saitama, Japan.
Abstract:-
This study describes a discharge flow characteristic of a roller tube pump when an operating condition of the pump is changed and a compression cycle of a tube becomes different. A roller tube pump is one of a fluid transport system which can generate a fluid flow by compressing tube by a roller and a plunger. Tube pumps have following advantages: The roller which moves fluid in the tube does not touch the fluid directly. The number of components is small and downsizing of the pump may be achieved. A power consumption is small. Therefore, the roller tube pump is used for chemical analysis processes and an infusion system. In the recent years, a novel infusion pump is urgently needed to prepare for the future sudden disaster. The novel pump should be available for use in the following situations: emergency medical situations which an emergency treatment of a hypovolemic shock caused by a trauma is needed, disaster situations which there is not enough space around victims which general infusion bags cannot be hung and a long transport of patients is assumed. There is a possibility that the novel pump can be developed based on a roller tube pump due to the above advantages. However, due to the operating principle of the tube pump, the discharge flow becomes pulsation flow according to a compression cycle of a tube by rollers. In order to use the pump regardless of the surrounding condition, the novel pump has to supply the constant flow rate regardless of a height of the infusion bag. This study aims to investigate a relationship among the discharge flow condition, the surrounding condition of the pump and the tube compression in order to optimize the pump structure to develop the novel tube pump system. In this report, we especially focused on the effects of a height of an infusion bag, which simulates infusion bags and a compression cycle of the tube by a roller on the discharge flow characteristic. We obtained following information experimentally: discharge flow rate is affected by a potential of water head when the number of the roller is small. When the number of the roller becomes large and the tube is enough compressed, the supply flow rate becomes stable. However, when the number of the roller increases, a net supply flow rate becomes small.Keywords:-
Disaster, Emergency Medicine, Fluid Machinery, Pulsating Flow, Roller Tube PumpI.
INTRODUCTION
A roller tube pump (Fig. 1) is one of a fluid transport system which can generate a fluid flow by compressing tubes by rollers and a plunger [1]. This is widely used for chemical analysis processes and an infusion system. Currently, in order to prepare for the future sudden disaster, a novel infusion pump emergency patient is urgently needed. We are now developing the novel pump which is available for use in the following situations: emergency medical situations which an emergency treatment of a hypovolemic shock caused by a trauma is needed, disaster situations which there is not enough space around victims which general infusion bags cannot be hung and a long transport of patients is assumed. The general infusion pumps don’t have a performance which can be used in the above emergency situations. The roller tube pump has the following advantages: The rollers, which transports working fluid by compressing the tube, do not contact the working fluid directly. There are a few components and the tube pump can achieve downsizing. The power consumption is small. Therefore, in order to develop the novel infusion pump which can be available for the above situations, the novel pump can be developed based on a roller tube pump.
With this as a background, our study aims to obtain basic information about the pump structure and the flow phenomena in order to develop the novel infusion pump based on the tube pump. In this report, we especially focused on a relationship among the discharge flow condition, the surrounding condition of the pump and the tube compression. The flow phenomena and the discharge flow condition of the tube pump were investigated experimentally while changing a height of an inlet water tank which simulates infusion bags and a compression cycle of the tube by a roller. Through the experiment, we obtained information about the design of the tube pump for optimizing the tube pump structure.
roller
tube
Fig.1:Image of roller type tube pump; left) schematic, right) flow of ink in tube
II.
EXPERIMENTAL
DEVICE
AND
METHOD
A. Experimental Apparatus
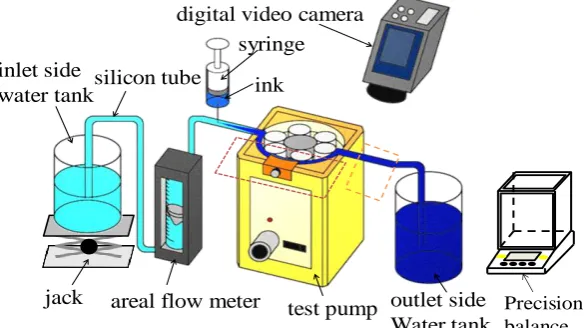
Figure 2 shows the schematic of the experimental apparatus to investigate the discharge flow condition of the tube pump. The experimental system is composed of a test tube pump, an inlet side water tank which simulates an infusion bag, an areal flow meter (Japan flow-cell, SCO-4, Range: 0 - 30 ml/min), a syringe, a digital video camera, an outlet side water tank and a precision balance (Sartorius, TE64, Range: 0 – 60 g). Water is used as the working fluid. The water is supplied to the tube pump from the inlet water tank through areal flow meter and finally flows to the outlet tank. The supply flow rate of the tube pump was measured by using the outlet water tank and the precision balance. Firstly, we measured the mass flow rate of the water by using the precision balance. The weight of the outlet water from the pump for 30 minutes was measured. Secondly the mass flow rate was calculated by dividing the obtained mass flow rate by the collected time. Finally, the volume flow rate is calculated by dividing the mass flow rate by the density. We evaluated the performance of the tube pump from the calculated volume flow rate. The areal flow mater was used to confirm whether the water flows without troubles or not.
jack areal flow meter test pump outlet side Water tank inlet side
water tanksilicon tube
syringe
ink
digital video camera
Precision balance
Fig.2:Schematic of experimental system for investigating flow characteristic of roller tube pump
volume flow rate. Therefore, we assumed that the height of the water surface in the inlet tank did not change during the experiment.
In order to investigate the flow phenomena of the exhaust flow from the tube pump, we additionally tried to perform flow visualization by using the ink tracer method. The syringe was installed at the upstream side of the tube pump and a methylene blue solution was supplied to the flow as the flow tracer. By observing the flow of the ink, we evaluated the change of the flow phenomena in the tube.
tube
Flow
T
he
s
ur
fac
e
of
w
ate
r
he
ig
ht
h
[m
m
]
0
85
- 85
water
jack flow meter pump
Fig.3:Position of water surface in the inlet tank
B. Test Pump
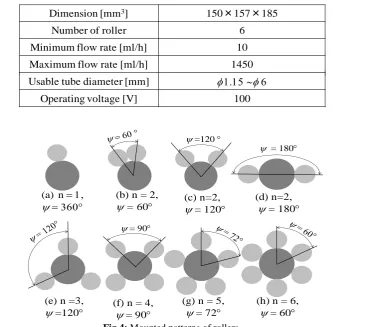
MP-3 model tube pump manufactured by EYELA as shown in Fig. 1 and Table 1 was used as the test pump. A silicon tube which has the inside diameter of 3 mm and the outer diameter of 5 mm was used as the flow pass. In order to investigate the relationship between the discharge flow condition and a compression cycle of the tube by a roller, we operated the tube pump while changing the placement and the number of the roller as shown in Fig. 4. Here, n [-] is the number of the attached roller, [deg.] is a smallest angle between the mounted rollers at each roller pattern.
Table I: Parameters of tube pump
Dimension [mm3] 150×157×185
Number of roller 6
Minimum flow rate [ml/h] 10
Maximum flow rate [ml/h] 1450
Flow rate control dial 1 (minimum) ~ 10 (maximum)
Usable tube diameter [mm]
f
1.15 ~f
6Operating voltage [V] 100 Dimension [mm3] 150×157×185
Number of roller 6
Minimum flow rate [ml/h] 10
Maximum flow rate [ml/h] 1450
Flow rate control dial 1 (minimum) ~ 10 (maximum)
Usable tube diameter [mm]
f
1.15 ~f
6Operating voltage [V] 100
(a) n= 1,
= 360 (b) n = 2, = 60
(c) n=2, = 120
(d) n=2, = 180
(e) n =3,
=120 (f) n = 4,= 90 (g) n = 5,= 72 (h) n = 6,= 60
=120
= 180
= 90
III.
RESULTS
AND
DISCUSSION
To begin with, we describe the change of the volume flow rate when the position and number of the roller and the height of the water surface in the inlet tank is changed. Figure 5 shows the difference of the volume flow rate. When the number of the roller was less than three, the volume flow rate decreased. Especially, when the number of roller was one or two and value was small, the deterioration of the supply flow rate becomes significant. h value also affects the supply flow rate. When the number of the roller was small and h became low, the flow rate deteriorated.
0
1
2
3
4
◆h = 85 mm
■h = 0 mm
▲h = -85 mm
V
o
lu
m
e
flo
w
r
ate
[
1
0
-7
m
3
/s
]
Fig.5:Relationship between volume flow rate and roller pattern
The change of the supply flow rate is caused by the occurrence of the period which the tube is not compressed by the roller. The tube pump transports the working fluid by compressing the tube. Some rollers rotate along the tube as shown in Fig. 1 while compressing the tube. At this time, the tube is pressed by the roller and the working fluid is trapped between the rollers as shown in Fig. 6. In the tube pump, the trapped working fluid is transferred by the rotation of the rollers. From the other point of view, the compression of the tube by the roller plays important role in order to achieve the steady supply of the flow rate because the flow in the tube can be controlled by the compression of the tube. When the tube is pressed by the roller, the working fluid cannot flow by itself. However, if there are some periods which the tube is not compressed completely, the working fluid flows in the tube freely. If the tube is not completely crashed and the potential head of the fluid in the inlet tank becomes higher, the working fluid flows by the support of the higher potential head at the upstream side of the pump. On the other hand, if the tube is not completely pressed and the potential head at the inlet tank becomes lower than the tube pump, a counter flow may cause because the working fluid flows to the target which has a lower potential head if there is no other pressure source. The occurrence of the counter flow can be confirmed by the result of flow visualization as shown in Fig. 7 (a). From these results, we can conclude that the supply flow rate changes when the number of the roller becomes small. This is because the period which the tube is not crashed by the roller is caused and the working fluid flows according to the potential head of the inlet flow tank.
(a) n = 2, = 60, h = - 85 (b) n = 6, = 60, h = - 85
Fig.7:Difference of flow pattern in the downstream side tube when the number of the roller is changed
On the other hand, when the number of the roller is larger than 4, the supply flow rate is not changed regardless of and h value. In these cases, the water flow in the tube pump is perfectly trapped by the rollers and the reverse flow cannot be caused as shown in Fig. 7 (b). Hence the net supply flow rate was dependent on the rotation speed of the centre gear. However, when the number of the roller increases, the supply flow rate decreases. This may be caused by the increase of the frictional force between the roller and the tube. When the number of the roller increases, the contact area of the roller with the tube increases and the frictional force become higher. This causes the deterioration of the rotation speed of the roller and the supply flow rate of the pump deteriorates. Therefore, we can conclude that there is an optimum value of the roller number.
IV.
OPTIMUM
ROLLER
NUMBER
In our test pump, the roller tube pump can supply the highest flow rate in the case of n = 4 without the effects of the potential head of the inlet tank. We can say that the optimum number of the roller in the case of our test pump was 4. Here, we will consider how the optimum value of the roller tube pump is decided.
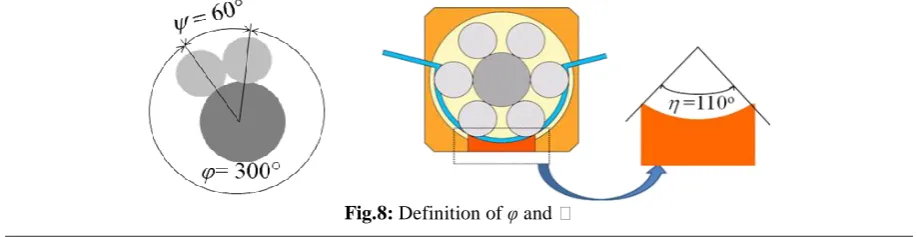
We focused on the relationship between the span of the roller and the size of the plunger. In order to investigate the above relationship, we defined the following angle ratio .
= / [-] (1)
Here, [deg.] is a biggest angle between the mounted rollers at each roller pattern. is the angle of the plunger as shown in Fig. 8. In this test pump, was 110 o. = means that at least two rollers can press the tube on the plunger.
Figure 9 show the relationship between the supply flow rate of the tube pump and the angle ratio. In the case of < 1.0, when value approaches 1, the supply flow rate become higher regardless of the height of the water surface in the inlet tank. However, the level of the supply flow rate is strongly dependent on the height of the water surface. On the other hand, in the case of > 1.0, the water surface height did not affect the net supply flow rate. From Fig. 9, the flow rate when = 1.2 shows the highest flow rate. When is smaller than 1.0, the period which no roller exists on the plunger and the tube is not compressed by the roller was caused. On the other hand, when is larger than 1.0, there are at least 2 rollers on the plunger regardless of the rotation of the roller. Therefore, the tube is certainly pressed and the tube pump can supply the water without the change of the flow rate by surrounding conditions. However, when becomes larger, the number of the roller unnecessarily increases and the friction force become higher. This causes the deterioration of the flow rate.
From this investigation, we concluded that the flow rate becomes higher when approaches 1.0. There is the possibility that the optimum number of the roller can be obtained from the relationship between the arrangement of the roller and the length of the plunger.
0.0
1.0
2.0
3.0
4.0
0.0
0.5
1.0
1.5
2.0
h = 85 mm h = 0 mm h = - 85 mm
Angle ratio
[-]
1.2
Fig.9:Relationship between flow rate and angle ratio
V.
CONCLUSIONS
This paper targeted to investigate the pump structure and the flow phenomena of the tube pump in order to develop the novel infusion pump based on the tube pump. We especially focused on a relationship among the discharge flow condition, the surrounding condition of the pump and the tube compression. The change of the supply flow rate and the discharge flow characteristic were investigated experimentally while changing a height of an inlet tank, which simulates infusion bags and a compression cycle of the tube by a roller. Through the experiment, we obtained following information.
The supply flow rate changes when the number of the roller becomes small. This is because the period which the tube is not crashed by the roller is caused and the working fluid flows according to the potential head of the inlet flow tank. On the other hand, when the number of the roller increases, the supply flow rate is not changed regardless of the change of the potential head in the inlet water tank.
However, when the number of the roller unnecessarily increases, the supply flow rate is decreased by the increase of the friction force at the contact surface of the roller with the tube.
There is the possibility that the optimum number of the roller can be predicted from the relationship between the arrangement of the roller and the length of the plunger.
Here, even if the number of the roller increases and the discharge flow rate is not affected by the surrounding condition such as h value, if the novel pump is developed based on the roller tube pump, the flow pulsation is caused as shown in Fig. 7 (b). As our future works, we should investigate the mechanism of the tube pump to decrease the flow pulsation.
ACKNOWLEDGMENT
The authors also wish to acknowledge the assistance of Mr. Katsuya Sato and Mr. Takuya Hashimoto, the former students at Iwate University.
REFERENCES
[1]. V. Shkolnikov, J. Ramunas and J.G. Santiago, “A self-priming, roller-free, miniature, peristaltic pump operable with a single, reciprocating actuator”, Sensors and Actuators A: Physical, Vol. 160, pp. 141-146, 2009.
[2]. T. Fukue, T. Hatakeyama, M. Ishizuka, K. Hirose and K. Koizumi, “Relationships between Supply Flow Rate of Small Cooling Fans and Pressure Drop Characteristics in Electronic Enclosure”, Proceedings of the ASME InterPACK2013 Conference, Paper No. InterPACK 2013-73089, 2013. [3]. A. Souma, K. Iwamoto and A. Murata, “Measurement of Pulsating Turbulent Pipe Flow for Energy
Saving”, Proceedings of the 21st International Symposium on Transport Phenomena, 2010.
[4]. Y. Yoshioka and H. Saitoh, “Effect of Pulsating Amplitude on Flow Structure and Associated Heat Transfer around the Flat Plate Installed in Pulsating Duct Flow”, Proceedings of the 21st International Symposium on Transport Phenomena, 2010.
[5]. T. Fukue, K. Hirose and N. Yatsu, “Basic Study on Flow and Heat Transfer Performance of Pulsating Air Flow for Application to Electronics Cooling”, Transactions of The Japan Institute of Electronics Packaging, Vol. 7, No. 1, 123-131, 2014.